Open Access
Research article
Identification of new reference genes for the normalisation of
canine osteoarthritic joint tissue transcripts from microarray data
Lindsey J Maccoux
†1,3, Dylan N Clements
†1,2, Fiona Salway
1and
Philip JR Day*
†1,3Address: 1Centre for Integrated Genomic Medical Research, University of Manchester, The Stopford Building, Oxford Rd, M13 9PT Manchester,
UK, 2The Musculoskeletal Research Group, Faculty of Veterinary Science, University of Liverpool, L69 3BX Liverpool, UK and 3ISAS – Institute for
Analytical Sciences, Bunsen-Kirchhoff-Str. 11-13, D-44139 Dortmund, Germany
Email: Lindsey J Maccoux - [email protected]; Dylan N Clements - [email protected]; Fiona Salway - [email protected]; Philip JR Day* - [email protected]
* Corresponding author †Equal contributors
Abstract
Background: Real-time reverse transcriptase quantitative polymerase chain reaction (real-time RT-qPCR) is the most accurate measure of gene expression in biological systems. The comparison of different samples requires the transformation of data through a process called normalisation. Reference or housekeeping genes are candidate genes which are selected on the basis of constitutive expression across samples, and allow the quantification of changes in gene expression. At present, no reference gene has been identified for any organism which is universally optimal for use across different tissue types or disease situations. We used microarray data to identify new reference genes generated from total RNA isolated from normal and osteoarthritic canine articular tissues (bone, ligament, cartilage, synovium and fat). RT-qPCR assays were designed and applied to each different articular tissue. Reference gene expression stability and ranking was compared using three different mathematical algorithms.
Results: Twelve new potential reference genes were identified from microarray data. One gene (mitochondrial ribosomal protein S7 [MRPS7]) was stably expressed in all five of the articular tissues evaluated. One gene HIRA interacting protein 5 isoform 2 [HIRP5]) was stably expressed in four of the tissues evaluated. A commonly used reference gene glyceraldehyde-3-phosphate dehydrogenase (GAPDH) was not stably expressed in any of the tissues evaluated. Most consistent agreement between rank ordering of reference genes was observed between Bestkeeper© and geNorm, although each method tended to agree on the identity of the most stably expressed genes and the least stably expressed genes for each tissue. New reference genes identified using microarray data normalised in a conventional manner were more stable than those identified by microarray data normalised by using a real-time RT-qPCR methodology.
Conclusion: Microarray data normalised by a conventional manner can be filtered using a simple stepwise procedure to identify new reference genes, some of which will demonstrate good measures of stability. Mitochondrial ribosomal protein S7 is a new reference gene worthy of investigation in other canine tissues and diseases. Different methods of reference gene stability assessment will generally agree on the most and least stably expressed genes, when co-regulation is not present.
Published: 25 July 2007
BMC Molecular Biology 2007, 8:62 doi:10.1186/1471-2199-8-62
Received: 11 May 2007 Accepted: 25 July 2007
This article is available from: http://www.biomedcentral.com/1471-2199/8/62
© 2007 Maccoux et al; licensee BioMed Central Ltd.
Background
The quantification of gene expression allows the mecha-nism organising biological activity to be determined. At present, real-time RT-qPCR provides the most accurate and specific measure of gene expression, with an unsur-passed dynamic range and a high level of reproducibility.
A number of variables will contribute to the variability of gene expression measurements, such as the number and type of cells in the tissue evaluated, the method and effi-ciency of mRNA extraction, mRNA handling techniques [1], mRNA integrity [2,3], method of reverse transcription [4] and analytical detection chemistry method [1]. These inter-sample differences are addressed through the proc-ess of normalisation [5], whereby the exprproc-ession of an individual gene within a sample is related to that of a cal-ibrating gene known as a reference, control or "house-keeping" gene. Ideally, a reference gene is expressed at a consistent and repeatable quantity across all samples being compared, so that relative differences in gene expression can be measured with confidence. Commonly used reference genes such as beta-2-microglobulin (B2M), glyceraldehyde-3-phosphate dehydrogenase (GAPDH) and beta actin (ACTB), are not constantly expressed across all tissue types and disease states [6,7]. Thus it is widely accepted that the selection of reference genes should be established through the validation of expression stability in the tissue or cells of interest, before use.
A number of statistical algorithms exist for the optimisa-tion of reference gene selecoptimisa-tion, such as geNorm [6], Glo-bal Pattern Recognition [8], Bestkeeper©[9], equivalence tests [10] and NormFinder [11]. In each case, mathemati-cal evaluation of expression data allows the ordering of candidate reference genes, on the basis of the relative expression stabilities. At present, no gold standard exists for the selection of reference genes, and although meth-ods have been compared with similar results in some reports [12-14] but not in others [11], the optimal method for selections remains unknown.
The identification of new reference genes from microarray data, within a particular tissue type, has been demon-strated to provide more "stable" reference genes than those conventionally used [11,14-16], as determined using stability algorithms. Microarray data can be strati-fied on the basis of fold changes in expression [14], the variance of expression [11,16] or integrative correlations [15]. Candidate genes can then be selected from stratified data, and frequently demonstrate expression stabilities greater than conventionally used reference genes [11,14,15]. However microarray data has yet to identify a new reference gene which shows consistent stability across multiple tissue or cell types, and/or disease situa-tions. Therefore a ubiquitous reference gene suitable for
normalisation of gene expression of all experiments prob-ably does not exist, but the identification of new reference genes to improve in reference gene stability is important to reduce error in RT-qPCR experiments.
In this study, we identified candidate reference genes from microarray expression profiling data generated from the evaluation of two different canine articular tissues (carti-lage and cranial cruciate ligament). The relative stability of expression of each reference gene in normal and osteoar-thritic canine articular tissues was determined from RT-qPCR reactions using statistical algorithmic packages. The stability of the new reference genes were compared between tissues, and related to a commonly used refer-ence gene(GAPDH).
Results
New reference genes
Identities and putative functions of each of the new refer-ence genes are listed in Table 1. Although the genes selected did not localise to common pathways or func-tions, two of the genes coded for mitochondrial ribos-omal proteins. The metrics of the candidate reference gene stability are presented in Table 2.
Articular cartilage
All methods of stability analysis agreed in finding the new genes MRPS7 and MRPS25 to be stably expressed. Like-wise, C7orf28B and NCK2 were determined to be the least stably expressed genes by both geNorm (Figure 2B) and NormFinder (Figure 2A). GAPDH was identified as the 4th
most stably expressed gene by both geNorm and Best-keeper©, and the 8th most stably expressed gene by
NormFinder.
Infrapatella fat pad
All three methods of reference gene analysis agreed on the most stably expressed reference genes, which were
C7orf28B, MRPS7 and MAPK6. GeNorm (Figure 2B) and NormFinder (Figure 2A) agreed that the least stably expressed gene was NCK2. GAPDH was identified as the 9th most stably expressed gene by NormFinder, the 7th
most stably expressed gene by geNorm, and the 5th most
stably expressed gene by Bestkeeper©.
Cranial cruciate ligament
Methods did not agree on the most stably expressed genes, although all methods agreed on the five most stably expressed genes (albeit, not their order); ATIC, MRPS7,
C7orf28B, ORMDL2 and HIRP5. MRPS25 was the least sta-bly expressed gene as determined by both NormFinder (Figure 2A) and geNorm (Figure 2B). GAPDH was identi-fied as the 7th most stably expressed gene by NormFinder,
the 9th most stably expressed gene by geNorm, and the 8th
Synovial membrane
Although Bestkeeper© and NormFinder agreed on the six most stably expressed genes (MRPS25, ATIC, HIRP5, TKT,
MRPS7, PTDSS1), and NCK2 was determined to be the least stably expressed gene by NormFinder (Figure 2A)
and geNorm (Figure 2B), no further patterns of agreement in rank ordering of the expression profiles were identified.
[image:3.612.56.553.109.490.2]ATIC was identified as the most stably expressed gene by NormFinder (Figure 2A) and Bestkeeper© (Figure 2C), and the 6th most stably expressed gene by geNorm.
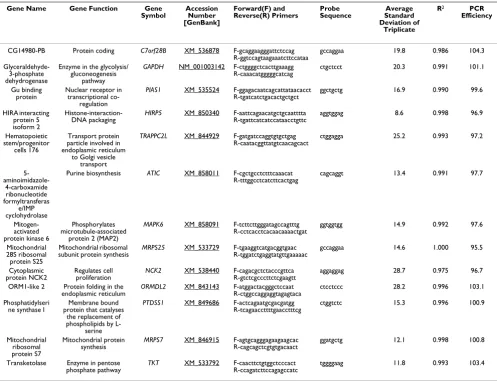
Table 1: A list of the gene annotations, functions, primer and probe sequences, and qPCR metrics for the 12 new reference genes, and glyceraldehyde 3-phosphate dehydrogenase
Gene Name Gene Function Gene
[image:3.612.56.551.594.729.2]Symbol Accession Number [GenBank]
Forward(F) and
Reverse(R) Primers Probe Sequence Standard Average Deviation of
Triplicate
R2 PCR Efficiency
CG14980-PB Protein coding C7orf28B XM_536878 F-gcaggaagggattctccag
R-ggtccagtaagaaatcttccataa gccaggaa 19.8 0.986 104.3
Glyceraldehyde-3-phosphate dehydrogenase
Enzyme in the glycolysis/ gluconeogenesis
pathway
GAPDH NM_001003142 F-ctggggctcacttgaaagg
R-caaacatgggggcatcag ctgctcct 20.3 0.991 101.1
Gu binding protein
Nuclear receptor in transcriptional
co-regulation
PIAS1 XM_535524 F-ggagacaatcagcattataacacct R-tgatcatctgacactgctgct
ggctgctg 16.9 0.990 99.6
HIRA interacting protein 5 isoform 2
Histone-interaction-DNA packaging HIRP5 XM_850340 F-aattcagaacatgctgcaattttaR-tgattcatcatccataacctgttc aggtggag 8.6 0.998 96.9
Hematopoietic stem/progenitor
cells 176
Transport protein particle involved in endoplasmic reticulum
to Golgi vesicle transport
TRAPPC2L XM_844929 F-gatgatccaggtgtgctgag R-caatacggttatgtcaacagcact
ctggagga 25.2 0.993 97.2
5-
aminoimidazole-4-carboxamide ribonucleotide formyltransferas
e/IMP cyclohydrolase
Purine biosynthesis ATIC XM_858011 F-cgctgcctctttcaaacat
R-tttggcctcatcttcactgag cagcaggt 13.4 0.991 97.7
Mitogen-activated protein kinase 6
Phosphorylates microtubule-associated
protein 2 (MAP2)
MAPK6 XM_858091 F-tcttcttgggatagccagtttg R-cctcacctcacaacaaaactgat
ggtggtgg 14.9 0.992 97.6
Mitochondrial 28S ribosomal protein S25
Mitochondrial ribosomal
subunit protein synthesis MRPS25 XM_533729 F-tgaaggtcatgacggtgaacR-tggatctgaggtatgttgaaaaac gccaggaa 14.6 1.000 95.5
Cytoplasmic protein NCK2
Regulates cell proliferation
NCK2 XM_538440 F-cagacgctctacccgttca R-gtctcgcccttctcgaagtt
aggaggag 28.7 0.975 96.7
ORM1-like 2 Protein folding in the endoplasmic reticulum
ORMDL2 XM_843143 F-atggactacgggctccaat R-ctggccaggaggtagagtaca
ctcctccc 28.2 0.996 103.1
Phosphatidylseri ne synthase I
Membrane bound protein that catalyses
the replacement of phospholipids by
L-serine
PTDSS1 XM_849686 F-actcagaatgcgacgatgg R-tcagaaccttttgaacctttcg
ctggtctc 15.3 0.996 100.9
Mitochondrial ribosomal protein S7
Mitochondrial protein
synthesis MRPS7 XM_846915 F-agtgcagggagaagaagcacR-cagcagctcgtgtgacaact ggatgctg 12.1 0.998 100.8
Transketolase Enzyme in pentose phosphate pathway
TKT XM_533792 F-caacttctgtggctcccact R-ccagatcttccagagccatc
tggggaag 11.8 0.993 103.4
Table 2: Correlation coefficients for the rank ordering of gene stability by different reference gene analysis methods
Tissue Method NormFinder GeNorm
Cartilage GeNorm 0.462
BestKeeper 0.515 0.721
Cruciate GeNorm 0.835
BestKeeper 0.915 0.794
Synovium GeNorm 0.833
BestKeeper 0.745 0.579
Fat Pad GeNorm 0.907
BestKeeper 0.867 0.939
Bone GeNorm 0.710
Bone
Rank ordering between NormFinder and geNorm agreed on the seven most stably expressed (C7orf28B, MRPS25,
PIAS1, PTDSS1, ATIC, MRPS7 and HIRP5) genes but not their order, and the least stably expressed gene (NCK2).
Bestkeeper© (Figure 2C) and NormFinder (Figure 2A) agreed on the most stably expressed gene (C7orf28B). Comparison of reference gene performance in all tissues Using the reference gene stability value (M) of 0.40 as the determinant of stable expression [6], MRPS7 was stably expressed in all five tissues, and HIRP5 was found to be stably expressed in four tissues (Figure 2B). GAPDH was found to be unstable in all of the tissues evaluated, which
is consistent with the findings of a previous study of refer-ence genes in these tissues [17]. Comparison of gene sta-bility (M) and pairwise stasta-bility (V) values with a previous study of commonly used reference genes using similar tis-sues further illustrates how optimal reference gene stabil-ities, as assessed by geNorm, can be achieved using the new reference genes rather than the commonly used refer-ence genes (Table 3).
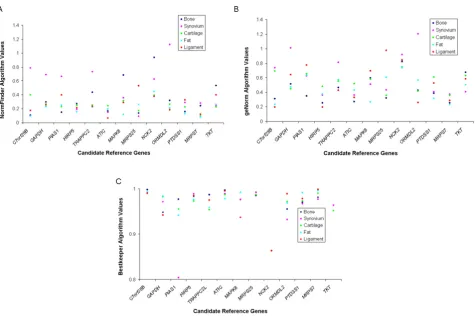
[image:4.612.76.551.86.419.2]No single reference gene was consistently identified as being the most stably expressed by NormFinder, geNorm or Bestkeeper© across most tissues. There was not consist-ent agreemconsist-ent in the rank ordering, or the selection of the optimal candidates by the different methods, although Reference gene stability measures as determined by: 2A
Figure 2
agreement was generally reached on the most and least stable gene. For example Bestkeeper© and NormFinder always identified the same gene as being most stably expressed. When looking at rank order across all three ref-erence gene stability programs, fat pad showed the highest correlation between methods, followed by cruciate liga-ment, cartilage, bone and synovium as the least consistent (Table 2).
When the data for all tissues was compared together (Fig-ure 2A, B, C), a much clearer pattern of reference gene sta-bility was observed. The stasta-bility metrics of the reference genes in different tissues show similar patterns across all three methods. MRPS7 demonstrates the most consistent metric (low geNorm M value, low NormFinder value and high Bestkeeper© correlation), with HIRP5 and ATIC dem-onstrating a similarly consistent stability across all tissues. This is supported by the finding that MRPS7 was consist-ently identified as being stably expressed in all tissues by geNorm (MRPS7), as well as being ranked as one of the two most stable reference genes in four of the five tissues by geNorm (cartilage, fat, bone and synovium), and in three of the five tissues using NormFinder and Bestkeeper©
(cartilage, ligament and fat).
Comparison genes identified by different methods Identification of new reference genes using RT-qPCR methodology for gene normalisation was not successful at identifying new reference genes with increased stability.
NCK2 was determined to be the least stably expressed gene in synovium and fat pad, and one of the four least stably expressed genes in cruciate ligament and cartilage.
TRAPPC2L was not identified as being stably expressed in any tissue using the geNorm algorithm, and was not ranked higher than the 8th most stably expressed gene in
any tissue using the NormFinder algorithm.
Discussion
A number of different strategies have been employed to filter microarray data to identify new reference genes, such as selection on the co-efficient variation and level of expression [11], fold changes of expression [14,16], or integrative correlations [15]. We used a combination of filtering on statistical significance, fold change and coeffi-cient of variation (percentage standard deviation) to nar-row the potential number of reference genes. Furthermore, these criteria were applied to three different experiments, using two different data sets, to identify genes which were more likely to have generic stability across multiple tissues for diseases. Genes were finally fil-tered on the basis of defined annotation and level of expression. In retrospect, genes should also have been selected on the basis of single transcript expression (i.e. the absence of splice variants). Although the two most sta-bly expressed genes (MRPS7 and HIRP5) currently have no splice variants reported, the absence of splice variants did not necessarily confer reference gene stability across multiple tissues (as demonstrated by GAPDH and
MRPS25, genes which do not have splice variants anno-tated and were not the most stably expressed) but should be taken into account when selecting new reference genes, as another potential indicator of instability. Our filtering method was straightforward, quickly performed and eas-ily completed by any person without a full understanding of microarray data set handling, and as such could be applied to publicly available microarray data sets for a given experiment or disease.
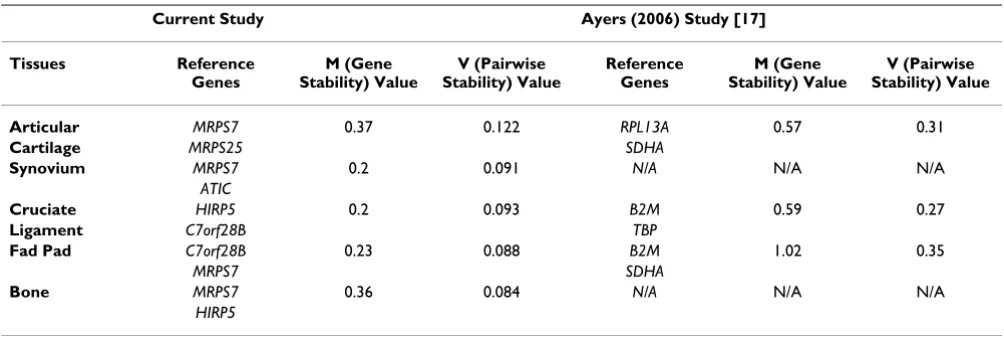
[image:5.612.54.556.99.267.2]Variability in the expression of commonly used reference genes has been recognised on the analysis of cell culture experiments [18] and clinical tissue specimens [19]. The selection of reference genes upon their stability as deter-mined by the mathematical assessment of their expression values is a widely accepted technique [6,12-15,20,21]. We identified one gene which showed stable expression Table 3: Comparison of M and V values generated in this study when compared to a previous study evaluating similar tissues
Current Study Ayers (2006) Study [17]
Tissues Reference Genes
M (Gene Stability) Value
V (Pairwise Stability) Value
Reference Genes
M (Gene Stability) Value
V (Pairwise Stability) Value
Articular MRPS7 0.37 0.122 RPL13A 0.57 0.31
Cartilage MRPS25 SDHA
Synovium MRPS7 0.2 0.091 N/A N/A N/A
ATIC
Cruciate HIRP5 0.2 0.093 B2M 0.59 0.27
Ligament C7orf28B TBP
Fad Pad C7orf28B 0.23 0.088 B2M 1.02 0.35
MRPS7 SDHA
Bone MRPS7 0.36 0.084 N/A N/A N/A
across normal and diseased articular tissues (MRPS7), and a number of genes which demonstrated a relatively con-sistent stability across the majority of tissue specimens (HIRP5). One should bear in mind that the tissues evalu-ated were from the same embryological origin (mesenchy-mal tissue), and hence there may have been a tendency towards identifying a reference gene which was stable in all tissues, although this is not supported by reports of ref-erence gene stability in different tissues [21]. Likewise, the diseases compared in the microarray data sets were the same as those affecting the tissue samples evaluated by real-time RT-qPCR, which may further tend towards iden-tifying reference genes whose stability was constant. Therefore, although we identified one gene as being stably expressed in all tissues, we would not advocate its use as a reference gene in other tissues or diseases without assess-ment of its stability in the samples to be evaluated [6,16,21], as the utopia of a universal reference gene suit-able for all studies probably does not exist on basis of the published evidence to date.
Mitochondrial ribosomal protein S7 is involved in mito-chondrial protein synthesis. The precise function of this gene is unknown in eukaryotes, but the protein is thought to be involved in organising the 3' domain of the 16 S rRNA in the mitochondria of prokaryotes, and thus be involved in the initiation of translation in mammalian mitochondria [22]. Microarray data analysis indicated the mitochondrial ribosomal protein S25 was also stably expressed, although it was only stably expressed in two of the four tissues analysed by RT-qPCR (cartilage and fat pad). In a separate study, mitochondrial ribosomal pro-tein L19 was one of six genes identified from microarray data obtained from different tissues and cells, as a good reference gene for real-time RT-qPCR experiments, when compared to conventional reference genes for mammary tumour expression profiling [16]. Mitochondrial ribos-omal gene expression appears to show greater stability across different tissues and thus may be less affected by tis-sue type or disease status, and better potential candidate reference genes for other real-time RT-qPCR experiments.
Comparing the results of this study to a similar previous study of commonly used reference genes in multiple artic-ular tissues demonstrates the increased stability of the "new" reference genes (Table 3) [17]. The selection of can-didate reference genes from microarray data identified new genes which were more stably expressed and is con-sistent with the general outcome of previous studies using this methodology [11,14-16]. The normalisation of microarray data by geometric mean of three reference genes [6] did not identify genes (NCK2 or TRAPPC2L) with appropriate stability to be suitable for use as refer-ence genes. The instability of these genes may be reflected, in part, by the greater variation identified in the triplicate
repeats of each assay when compared to more genes deter-mined as being more stably expressed such as HIRP5 or
MRPS7. The less stable expression of the three conven-tional reference genes (GAPDH, RPL13A and SDHA) probably resulted in the selection of similarly "unstably" expressed reference genes from microarray data, and thus accounted for this being a futile method of trying to select reference genes, which agrees with the evaluation of these types of methodologies for the accurate normalisation of microarray data [23]. These genes were selected on the basis of a preliminary study of reference gene stability in canine OA tissues [24], however subsequent work evalu-ating greater sample numbers has determined that one of these genes (SHDA) demonstrates differential expression in OA cartilage [25] and thus its use may have further pre-disposed to the selection of genes which were not stably expressed. Furthermore, the conventionally used refer-ence gene we evaluated (GAPDH) did not show accepta-ble staaccepta-ble expression in any of the tissues we analysed.
We used three different methods of ranking reference gene stability in each experiment. Correlation co-efficient could be generated to compare methods and quantify the agreement of the rank ordering of different methods. Pre-vious studies have demonstrated that the generation of rank orders can be very similar between different methods [14], but this is not always the case [11]. The best correla-tion in rank ordering was observed between geNorm and
Bestkeeper©, across all the tissues which is unsurprising as both are generated by pairwise comparisons (although geNorm uses transformed data, whereas Bestkeeper© uses threshold cycle values), although Bestkeeper© and NormFinder always identified the same gene as being most stably expressed. The rank order of reference gene stability was identified most consistently for fat pad, fol-lowed by cruciate ligament, cartilage, bone and least con-sistently for synovium.
the co-regulated genes [26]. The different methods for determining reference gene stability did not necessarily agree on rank order, but were good at determining both the most and least stably expressed genes, regardless of method. The top two most stably expressed genes ana-lysed by geNorm for each tissue were then used to study cytokine gene expression in canine osteoarthritis [27].
Conclusion
The use of microarray data for the selection of reference genes allowed the identification of multiple genes dem-onstrating greater stability than a conventional reference gene in multiple tissues. Mitochondrial ribosomal protein S7 is suitable for use in all the experimental conditions we analysed, and is suitable for investigation in other experi-ments. Different methods of assessment of gene stability do not always show correlation between the rank order of gene expression stability, but they do generally agree on which genes are suitable for use to normalise gene expres-sion experiments.
Methods
Microarray dataExpression profiling data from 10 hip articular cartilage samples (5 control, 5 from osteoarthritic [OA] joints) and 16 cranial cruciate ligament (CCL) samples (4 normal low-risk of rupture, 7 normal high-risk of rupture, and 5 ruptured ligament from OA joints) were generated from a custom designed 44 k transcript canine whole genome 60 mer oligonucleotide microarray [28]. Raw data was nor-malised by two methods; locally weighted scatterplot smoothing (LOWESS), or using the geometric mean of 3 conventional reference genes arbitrarily selected (glyceral-dehyde-3-phosphate dehydrogenase [GAPDH], ribos-omal protein L13a [RPL13A], succinate dehydrogenase flavoprotein subunit A [SDHA]). Expression quantifica-tion was exported into an Excel Datasheet (Microsoft Excel 2003), and the data compared in three separate experiments as follows;
1) Normal hip articular cartilage was compared to OA car-tilage,
2) Normal CCL (high-risk of rupture) was compared to normal CCL (low-risk of rupture),
3) Normal CCL (high risk of rupture) was compared to ruptured CCL
Selection of reference gene candidates
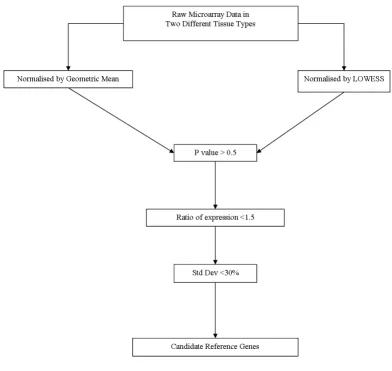
The stepwise procedure for identifying candidate ence genes is illustrated in Figure 1. Data for each refer-ence gene candidate was compared in each experiment by calculating the fold change in mean expression level (between the two comparison groups), student's t-tests
and percentage standard deviation (co-efficient of varia-tion). To identify the most stably expressed genes across each of the experiments, the prospective reference genes were then selected using the following the criteria;
1. Student's t-test P value > 0.5 (in all experiments).
2. Ratio of expression between the two groups compared in each experiment <1.5 (in all experiments).
3. Standard deviation of the mean expression in each experimental group being <30% (in all experiments).
The data sets were reduced to 420 transcripts (LOWESS normalised) and 13 transcripts (reference gene normalisa-tion). To further refine and filter the new reference gene list, data was ordered on the average signal intensity and;
4. The probe sequences used from the microarray experi-ments were entered into the NCBI BLAST® database [29] to
confirm the gene identity,
5. Gene function was determined [29] and the associated gene information checked to ensure no known involve-ment in OA.
Complete filtering reduced the data set to 12 genes, of which 10 were selected from the LOWESS normalised data, (CG14980-PB [C7orf28B], Gu binding protein [PIAS1], HIRA interacting protein 5 isoform 2 [HIRP5], 5-aminoimidazole-4-carboxamide ribonucleotide formyl-transferase/IMP cyclohydrolase [ATIC], Mitogen-activated protein kinase 6 [MAPK6], Mitochondrial 28S ribosomal protein S25 [MRPS25], ORM1-like 2 [ORMDL2], Phos-phatidylserine synthase 1 [PTDSS1], Mitochondrial ribos-omal protein S7 [MRPS7] and Transketolase [TKT]), and 2 were selected from the reference gene normalised data (Hematopoietic stem/progenitor cells 176 [TRAPPC2L] and Cytoplasmic protein NCK2 [NCK2]). Glyceralde-hyde-3-phosphate dehydrogenase [GAPDH] was also selected as it is a commonly used reference. The sequence details and putative functions (determined by reference to the human transcripts [29]) are listed in Table 1.
Sample collection and storage
Con-trol samples (healthy) were obtained from infrapatellar fat pad (n = 5), cranial cruciate ligament (n = 5), synovial membrane (n = 5), hip articular cartilage (n = 5) and ulnar bone (n = 5) of dogs euthanized for reasons other than, and with no evidence of, joint disease. Following the col-lection of the tissue, the samples were weighed and imme-diately stored in RNAlater™ (Qiagen Inc, Crawley, UK), according to the manufacturer's instructions, until extrac-tion.
RNA extraction
For all of the tissue samples total RNA was extracted using a phenol/guanidine hydrochloride reagent (Trizol, Invit-rogen Ltd, UK) with a chloroform extraction and ethanol precipitation, as previously described [30]. An on column DNA digestion step was included (RNase-Free DNase Set,
Qiagen Ltd, Crawley, UK). Final elution of the total RNA was performed using 30 μl of RNase free water, and repeated to maximize the amount of RNA eluted. Total RNA samples were stored at -80°C until use. The concen-tration of total RNA representing each sample was quanti-fied by using a NanoDrop® ND – 1000 UV/Visible
Spectrophotometer (NanoDrop Technologies Ltd, Utah, USA).
cDNA synthesis
[image:8.612.98.491.91.463.2]Reverse transcription was performed using Superscript II reverse transcriptase (Invitrogen, Dorset, UK) according to the manufacturers instructions [31]. Initially 200 μg (10 μl) total RNA was pre-incubated with 0.5 μg (1 μl) oligo-dT12–18 (Invitrogen, Paisley, UK) and 10 mM (1 μl) dNTP mix (Invitrogen, Paisley, UK) at 65° for 5 minutes. After
Figure 1
chilling on ice, 4 μl of 5 × first strand buffer (containing 250 mM Tris-HCI (pH 8.3), 375 mM KC1, 15 mM MgCl2), 2 μl of 0.1 M DTT and 40 units (1 μl) of RNAse (Promega, Southhampton, UK) were added to each sam-ple and the samsam-ples incubated for 2 minutes at 42°C, fol-lowed by the addition of 200 units (1 μl) of Superscript II reverse transcriptase (Invitrogen, Doreset, UK) and incu-bated for 50 minutes. Reverse transcriptase activity was terminated by incubation at 70°C for 15 minutes, and samples stored at -80°C until use.
Real-time reverse transcriptase quantitative PCR assay design
Transcript sequences were obtained from the National Centre for Biotechnology Information [29] and were cross referenced to the Ensembl canine genome database [32]. Primer and probe sequences were then designed for each of the reference genes by using the Universal Probe Library Assay Design Centre (Roche Diagnostics Ltd; [33]) BLAST searches were performed for all primer sequences to con-firm gene specificity, and electrophoresis of the PCR reac-tion mixture confirmed a single product of the appropriate length in all cases. Primers were synthesized by Metabion International AG (Martinsried, Germany), and probes were synthesized by Roche Diagnostics (Lewes, UK) using locked nucleic acid with 5'-end reporter dye fluorescein (FAM (6-carboxy fluorescene)) and 3'-end dark quencher dye.
Real-time RT-qPCR assays were performed in triplicate using the LightCycler® 480 (Roche Diagnostics; Lewes,
UK) in 384 well format, with three no template controls used for each assay. The reaction volume in each well con-sisted of 5 μL LightCycler® 480 Probes Master 2 ×
concen-tration (Roche Diagnostics) (containing FastStart Taq DNA Polymerase, reaction buffer, dNTP mix (with dUTP) and 6.4 mM MgCl2), 0.7 μL of LightCycler® 480 Probes
Master H2O (Roche Diagnostics), 0.1 μL of 20 μM forward primer, 0.1 μL of 20 μM reverse primer, 0.1 μL of 10 μM fluorescently-labelled probe and either 4 μL of sample cDNA, diluted template, or 4 μL of LightCycler® 480
Probes Master H2O. The standard amplification condi-tions consisted of 1 cycle at 95°C for 5 minutes, followed by 50 cycles of 95°C for 15 seconds and 60°C for 30 sec-onds. Real-time RT-qPCR data was then analysed by using LightCycler® 480 Basic Software (Roche Diagnostics;
Lewes, UK). Standard curves were generated for each ref-erence gene by employing cDNA or template oligonucle-otides [34], the parameters of which are listed in Table 1. All samples were checked for absence of genomic DNA contamination using a canine genome specific RT-qPCR assay, previously described [25]. The assays were deemed to be reproducible, as determined by the average standard deviation of the triplicate repeats of each assay being less than 30% (Table 1).
Reference gene stability analysis
Real-time RT-qPCR data was exported into an Excel datasheet (Microsoft Excel 2003) and analysed using three separate reference gene stability analysis software pack-ages; geNorm [6], Bestkeeper©[9] and NormFinder [11]. Each of these methods generates a measure of reference gene stability, which can be used to rank the reference genes in order of stability. GeNorm generates a stability measure (the M value) for each gene which is arbitrarily suggested to be lower than 0.4 (with a lower value indicat-ing increased gene stability across samples), and a pair-wise stability measure to determine the benefit of adding extra reference genes for the normalisation process, with again a lower value indicating greater stability of the nor-malised genes, and a lower value indicating greater stabil-ity with an arbitrary cut off value of lower than 0.15 indicating acceptable stability of the reference gene com-bination [6]. NormFinder generates a stability measure of which a lower value indicates increased stability in gene expression. By using a model-based approach, NormFinder groups samples to allow for a direct estima-tion of expression variaestima-tion, compared to the pairwise comparison approach that ranks genes according to the similarity of their expression profiles. Therefore, taking a sample set which consists of two sample subgroups where all of the candidates but one show little difference between the groups, the one candidate which shows no difference will have the smallest stability value across all candidates and be the most stably expressed gene. Best-keeper© generates a pairwise correlation co-efficient between each gene and the Bestkeeper© index (the geomet-ric mean of the threshold cycle values of all the reference genes grouped together). Stability measures for combined (normal and diseased) samples were recorded, as ulti-mately it is these measures which would be used to deter-mine which genes were suitable for normalising expression data from genes of interest in a particular dis-ease (osteoarthritis) in practice.
Authors' contributions
DNC and LM carried out the microarray data analysis. LM and FS carried out the assay design. DNC, LM and FS per-formed the molecular genetic studies and DNC perper-formed the statistical analysis. DNC and PJRD conceived the study, its design and coordination, and drafted the manu-script with LM.
Acknowledgements
LM was self funded, DNC was funded by the Biotechnology and Biological Sciences Research Council, FS was funded by the University of Manchester, and PJD was funded by the Higher Education Funding Council of England. The study was funded in part by a grant from the PetPlan charitable trust, UK, and in part by a project grant from the University of Manchester. The manuscript preparation was funded by the University of Manchester. Nei-ther funding body had any role in the study design; in the collection, analysis, and interpretation of data; in the writing of the manuscript; or the decision to submit the manuscript for publication.
References
1. Bustin SA, Nolan T: Pitfalls of Quantitative Real-Time Reverse-Transcription Polymerase Chain Reaction. J Biomol Tech 2004,
15:155-166.
2. Imbeaud S, Graudens E, Boulanger V, Barlet X, Zaborski P, Eveno E, Mueller O, Schroeder A, Auffray C: Towards standardization of RNA quality assessment using user-independent classifiers of microcapillary electrophoresis traces. Nucleic Acids Res 2005,
33:e56.
3. Bustin SA: Quantification of mRNA using real-time reverse transcription PCR (RT-PCR): trends and problems. J Mol Endocrinol 2002, 29:23-39.
4. Lekanne Deprez RH, Fijnvandraat AC, Ruijter JM, Moorman AFM:
Sensitivity and accuracy of quantitative real-time polymer-ase chain reaction using SYBR green I depends on cDNA syn-thesis conditions. Anal Biochem 2002, 307:63-69.
5. Huggett J, Dheda K, Bustin S, Zumla A: Real-time RT-PCR nor-malisation; strategies and considerations. Genes Immun 2005,
6:279-284.
6. Vandesompele J, De Preter K, Pattyn F, Poppe B, Van Roy N, De Paepe A, Speleman F: Accurate normalization of real-time quantitative RT-PCR data by geometric averaging of multi-ple internal control genes. Genome Biology 2002, 3: 0034.1-0034.11.
7. Dheda K, Huggett JF, Bustin SA, Johnson MA, Rook G, Zumla A: Val-idation of housekeeping genes for normalizing RNA expres-sion in real-time PCR. Biotechniques 2004, 37:112-119.
8. Akilesh S, Shaffer DJ, Roopenian D: Customized Molecular Phe-notyping by Quantitative Gene Expression and Pattern Rec-ognition Analysis. Genome Res 2003, 13:1719-1727.
9. Pfaffl MW, Tichopad A, Prgomet C, Neuvians TP: Determination of stable housekeeping genes, differentially regulated target genes and sample integrity: BestKeeper--Excel-based tool using pair-wise correlations. Biotechnology Letters 2004,
26:509-515.
10. Haller F, Kulle B, Schwager S, Gunawan B, von Heydebreck A, Sult-mann H, Fuzesi L: Equivalence test in quantitative reverse tran-scription polymerase chain reaction: confirmation of reference genes suitable for normalization. Anal Biochem 2004,
335:1-9.
11. Andersen CL, Jensen JL, Orntoft TF: Normalization of Real-Time Quantitative Reverse Transcription-PCR Data: A Model-Based Variance Estimation Approach to Identify Genes Suited for Normalization, Applied to Bladder and Colon Cancer Data Sets. Cancer Res 2004, 64:5245-5250.
12. Radonic A, Thulke S, Bae HG, Muller MA, Siegert W, Nitsche A: Ref-erence gene selection for quantitative real-time PCR analy-sis in virus infected cells: SARS corona virus, Yellow fever virus, Human Herpesvirus-6, Camelpox virus and Cytomeg-alovirus infections. Virology Journal 2005, 2:7.
13. Spinsanti G, Panti C, Lazzeri E, Marsili L, Casini S, Frati F, Fossi C:
Selection of reference genes for quantitative RT-PCR stud-ies in striped dolphin (Stenella coeruleoalba) skin biopsstud-ies.
BMC Molecular Biology 2006, 7:32.
14. de Brouwer AP, van Bokhoven H, Kremer H: Comparison of 12 reference genes for normalization of gene expression levels in Epstein-Barr virus-transformed lymphoblastoid cell lines and fibroblasts. Molecular Diagnosis and Therapeutics 2006,
10(3):197-204.
15. Saviozzi S, Cordero F, Lo M, Novello S, Giorgio VS, Calogero R:
Selection of suitable reference genes for accurate normali-zation of gene expression profile studies in non-small cell lung cancer. BMC Cancer 2006, 6:200.
16. Szabo A, Perou CM, Karaca M, Perreard L, Quackenbush JF, Bernard PS: Statistical modeling for selecting housekeeper genes.
Genome Biology 2004, 5:R59.
17. Ayers D, Clements DN, Salway F, Day PJR: Expression stability of commonly used Control Genes in Canine Articular Connec-tive Tissues. Submitted for publication 2006.
18. Gorzelniak K, Janke J, Engeli S, Sharma AM: Validation of endog-enous controls for gene expression studies in human adi-pocytes and preadiadi-pocytes. Horm Metab Res 2001, 33:625-627. 19. Matyas JR, Huang D, Adams ME: A comparison of various
"house-keeping" probes for northern analysis of normal and oste-oarthritic articular cartilage RNA. Connect Tissue Res 1999,
40:163-172.
20. Bogaert L, Van Poucke M, De Baere C, Peelman L, Gasthuys F, Mar-tens A: Selection of a set of reliable reference genes for quan-titative real-time PCR in normal equine skin and in equine sarcoids. BMC Biotechnology 2006, 6:24.
21. Brinkhof B, Spee B, Rothuizen J, Penning LC: Development and evaluation of canine reference genes for accurate quantifica-tion of gene expression. Anal Biochem 2006, 356:36-43. 22. Cavdar Koc E, Blackburn K, Burkhart W, Spremulli LL:
Identifica-tion of a Mammalian Mitochondrial Homolog of Ribosomal Protein S7. Biochem Biophys Res Commun 1999, 266:141-146. 23. Listgarten J, Graham K, Damaraju S, Cass C, Mackey J, Zanke B:
Clin-ically validated benchmarking of normalisation techniques for two-colour oligonucleotide spotted microarray slides.
Applied Bioinformatics 2003, 2:219-228.
24. Ayers D, Clements D, Salway F, Day P: Expression stability of commonly used reference genes in canine articular connec-tive tissues. BMC Veterinary Research 2007, 3:7.
25. Clements DN, Carter SD, Innes JF, Ollier WE, Day PJ: Analysis of normal and osteoarthritic canine cartilage mRNA expres-sion by quantitative-PCR. Arthritis Res Ther 2006, 8:R158. 26. Yu H, Luscombe NM, Qian J, Gerstein M: Genomic analysis of
gene expression relationships in transcriptional regulatory networks. Trends Genet 2003, 19:422-427.
27. Maccoux LJ, Salway F, Day PJR, Clements DN: Expression profiling of select cytokines in canine osteoarthritis tissues. Vet Immu-nol Immunopathol 2007, 118(1-2):59-67.
28. Jones P, Jones C, Fretwell N, Martin A, Soloviev M: Design and pro-duction of a whole genome dog oligonucleotide microarray.
Advances in Canine and Feline Genomics 2004.
29. Information NCB: National Centre for Biotechnology Informa-tion. 2007 [http://www.ncbi.nlm.nih.gov].
30. Clements DN, Vaughan-Thomas A, Peansukmanee S, Carter SD, Innes JF, Ollier WER, Clegg PD: Assessment of the use of RNA quality metrics for the screening of normal and pathological canine articular cartilage samples. Am J Vet Res 2006,
67:1438-1444.
31. Invitrogen: Invitrogen. 2006 [http://www.invitrogen.com]. 32. Ensembl: Ensembl. 2007 [http://www.ensembl.org].
33. Ltd RD: Roche Diagnostics Ltd. 2007 [http://www.roche-applied-science.com].
![INFO/C: [Consumer Policy and Health Protection] Vol VI, No 1, February 1996](data:image/gif;base64,R0lGODlhAQABAIAAAP///wAAACH5BAEAAAAALAAAAAABAAEAAAICRAEAOw==)