Article
Effects of Redundancy in Bracing Systems on the
Fragility Curve Development of Steel Jacket Offshore
Platform
Md Samdani Azad
1,a, Wonsiri Punurai
1,b,*, Chana Sinsabvarodom
2,c,
and Pornpong Asavadorndeja
3,d1 Department of Civil and Environmental Engineering, Faculty of Engineering, Mahidol University, Thailand
2 Department of Marine Technology, Norwegian University of Science and Technology, Norway 3 Synterra Co., Ltd., Thailand
E-mail: a[email protected], b[email protected] (Corresponding author), c[email protected], d[email protected]
Abstract. Steel jacket offshore platforms are typically employed for use in shallow to moderate water depths. During platform operations, there have been some historical accidents completely damaging the diagonal members of the bracing systems due to explosions, fire accidents and dropped objects. Different locations of damaged bracings demonstrate different levels of risk for safety and integrity of the structures. This research illustrates the effects of redundancy in the bracing systems for steel jacket offshore platforms. Assessments have been carried out using the nonlinear pushover analysis method and formations of nonlinear hinges of different members were noted. Redundancy in different positions has been considered to investigate the consequences. Reserve strength ratio (RSR) and damage strength ratio (DSR) of the global structure were also evaluated to understand the importance of different local members. From the collapse data of local failures, fragility curves for the global structures were estimated. The results demonstrated that the position of damage can be a great concern which affects the overall performance of the structures.
Keywords: Jacket platform, redundancy analysis, plastic hinges, fragility curve.
ENGINEERING JOURNAL Volume 23 Issue 1 Received 12 June 2018
1.
Introduction
Offshore structures are employed for several different reasons especially in energy industries, such as for support structures of offshore wind turbines and petroleum exploration. Although there are noteworthy developments of renewable energy, demand for oil and gas all over the world is still high. Apart from onshore extraction, extrication of oil and gas in offshore areas is also becoming common to cope with the present demands. It has become a challenge for structural engineers to design safe and robust marine structures for the uncertain behaviors of such structures. Redundancy or complete damage of structural members are salient issues and an offshore structure could be disposed due to collapse. Redundancy can be defined as the creating of an alternative load path due to some local damages in the structure [1]. The term redundancy is used when complete damage of any local member or some local members occurs. It is important to check whether the acting loads are being transferred to foundations if any local member is fully damaged or partially damaged. These types of damage often occur due to unforeseen events or accidental actions. The accidental actions include ship impacts, explosions or dropping of objects.
structural performance substantially with respect to the intensity measure of loads. A fragility curve [13] is generated by lognormal distribution of failure data points from pushover analysis. Fragility curves can also be developed using the outcome of incremental dynamic analyses and multiple strip analyses [14, 15]. From the analysis, the probabilities of different damage states are calculated. After that the maximum likelihood method [16] or method of moments [17] is employed to estimate the fragility curves. The linear regression method [18] can also be used to estimate the fragility curve parameters i.e. mean and standard deviation. Zeinoddini et al. [19] conducted endurance wave analyses for developing the fragility curve of a fixed offshore platform. A probabilistic load model has been incorporated for the assessment.
The aim of this paper is to study the assessments of offshore jacket platforms for different redundant conditions in order to estimate fragility curves from pushover analyses results. This method provides efficient computational time in comparison with dynamic time history analyses. An approximation in estimating fragility curves has been reported in this study. The jacket platform has been adopted from Punurai et al. [20]. Pushover analyses are conducted for different redundant conditions to observe the force-displacement behavior following the procedure of El-din and Kim [5]. The local members are monitored at different damage states for corresponding base shear values and ultimate capacity of each models are evaluated. Reserve Strength Ratios (RSR) and Damage Strength Ratios (DSR) are estimated from design force and ultimate capacity in order to understand the importance of different damaged members. Force thresholds for different damage states are noted. The base shear values at the different damage state are found in local members. These values for each damage states are considered to evaluate the fragility curves for demonstration of structural performances.
2.
Methodology
2.1. Structural Model Descriptions
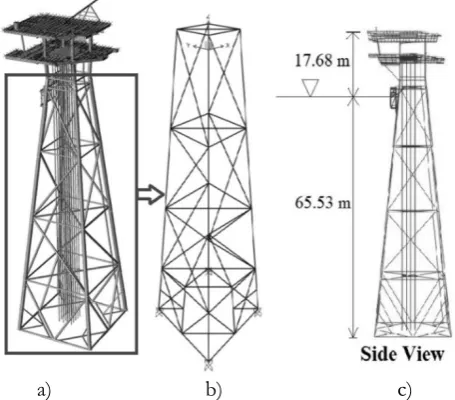
The jacket platform used in this study has been designed for shallow water depth of approximately 65.53 meters [20]. The configuration of the steel jacket platform consists of a 4-legged structure with containing pile inside. The jacket platform has been modeled using 2 by 2 square grids. The overall dimensions are 8 m by 8 m at top elevation and 21.76 m by 21.76 m at the mud line. The total height is 83.21 meters. Two types of bracing are used: horizontal bracings and vertical bracings. The horizontal bracings are installed at each level parallel to the horizontal plane. The vertical bracings are provided as single bracings till the bottom level. At the bottom level, these are placed as K-bracings to impart more stiffness and to reduce buckling. The jacket support/foundation is modeled as fixed support conditions. The full scale model of the jacket is illustrated in Fig. 1(a). The jacket platform has been modeled in commercial software “SAP2000” as shown
in Fig. 1(b) and the water depth and jacket height are included in Fig. 1(c).
a) b) c)
[image:3.595.182.410.534.734.2]2.2. Pushover Analysis
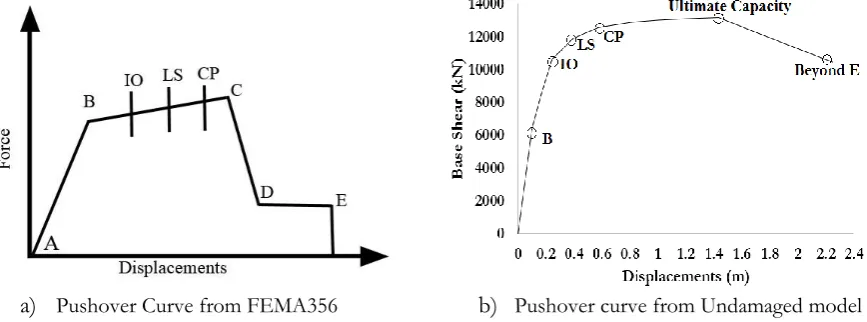
Pushover analyses have been conducted to determine the force-displacement relationships and the performance levels of the structural models. Pushover analysis is classified as two types, known as force control and displacement control. Force-controlled analyses are suggested as per API-2A WSD [9] for wave forces. Displacement control analyses are performed in this study to see the collapse of local members as well as global structural performance. Pushover analyses are performed using uniform acceleration of loads up to a certain level of displacements. An outline of a typical pushover curve [11, 21] is shown in the following Fig. 2 (a).
a)
Pushover Curve from FEMA356b)
Pushover curve from Undamaged modelFig. 2. Typical force displacements curve as per FEMA356.
Figure 2(b) illustrates the pushover curve obtained from the analysis for the undamaged model. By applying Eq.(1) and (2), one can find the reserve strength ratio (RSR) using the ultimate capacity of the undamaged (intact) and damaged structure. As per API [9], there is a direct relationship between the ultimate capacity of structure and RSR. RSR can also be considered as safety factor as it is the ratio of ultimate capacity of force and design force. The RSR value can be calculated as follows:
Ultimate capacity of structures (Intact)
( ntact)
Design Environmental Loads
RSR I
=
(1)Ultimate capacity of structures (Damaged)
( amaged)
Design Environmental Loads
RSR D
=
(2)After calculating RSR, the damage strength ratio (DSR) is calculated as it is a measure of redundancy.
(Damaged) (Intact)
Safety Factor (Damaged)
Safety Factor (Undamaged)
RSR
DSR
RSR
=
=
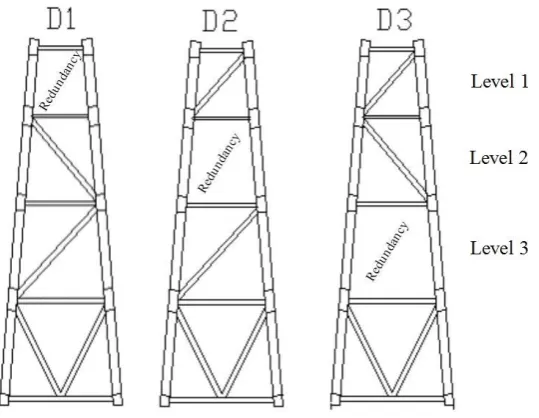
(3) [image:4.595.76.510.206.367.2]Fig. 3. Damage locations of local members in various positions of the Jacket.
There are 3 different redundancy conditions, consisting of D1, D2 and D3. The specifications of D1, D2 and D3 follow the different levels of the jacket platform. Different levels are classified from the top of the jacket towards the downwards to the seabed. The top level is considered as Level 1. The following level towards the seabed is contemplated as Level 2 and the next level along the depth of sea is Level 3. When a vertical bracing is completely damaged at Level 1, the specification of the model has been considered as D1. In the case of a damaged vertical bracing at Level 2 and Level 3, the models are specified as D2 and D3. The models with redundancy (complete damage of a single vertical bracing) under the different loading direction for pushover analysis are specified as:
• D1+x: D1 model and the pushover loading is along positive x-direction. • D1-x: D1 model and the pushover loading is along negative x-direction. • D2+x: D2 model and the pushover loading is along positive x-direction. • D2-x: D2 model and the pushover loading is along negative x-direction. • D3+x: D3 model and the pushover loading is along positive x-direction. • D3-x: D3 model and the pushover loading is along negative x-direction.
2.3. Fragility Curve development
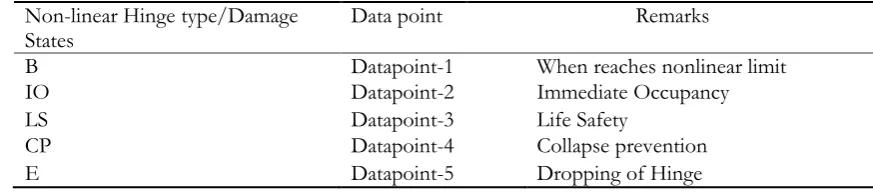
The analytical fragility function has been developed to represent the base shear data, which is obtained from the nonlinear static analyses. Fragility functions are influenced by the number of data points from pushover analyses. The relationships between the base shear forces and top displacements of the jacket structures imply the levels of damage state. The specifications of damage states/nonlinear hinges are illustrated briefly in Table 1. The higher states of damages result in the reduction of local stiffness, which provides flatter slopes in pushover curves, due to the occurrence of nonlinear hinges at the local members or local connections. The data points are collected in such a way that there must be at least one member reaching a certain damage state. As shown in Table 1, the first data point is noted when at least one
member crosses the elastic limit and this limit has been depicted as “B”. The following damage states (IO,
[image:5.595.155.425.82.291.2](PDF)
(
(
)
)
22
ln /
1
( ) exp
2 2 x f x x
= − (4)
(CDF)
P X
x
F x
x( )
f x dx
( )
−
=
=
(5)
ln
x
ln
P X
x
−
=
(6)
ln(
x/)
P IM x
= =
(7)
Equation (4) depicts the probability density of event x. Here, event x is the base shear. From this equation, the probability of failure of any event can be evaluated. Equation (5) illustrates the summation of probability of failure for each events. The cumulative probability of failure can be obtained from this equation for different events. Here,
is the lognormal mean value and is the standard deviation of ln(x). The equation of cumulative distribution can be written as Eq. (6) and (7) using a standard normal cumulative distribution function, (.). Here P IM( =x)is the probability that base shear (event) withIM=x causes a different damage stage in the local members. IM is the intensity measure which can be the base shear, acting force, height of waves and spectral acceleration. In the study, base shear has been considered as IM.
Table. 1. Data-point collection from nonlinear hinges as shown in Fig. 2.
Non-linear Hinge type/Damage
States Data point Remarks
B Datapoint-1 When reaches nonlinear limit
IO Datapoint-2 Immediate Occupancy
LS Datapoint-3 Life Safety
CP Datapoint-4 Collapse prevention
E Datapoint-5 Dropping of Hinge
3.
Result and Discussion
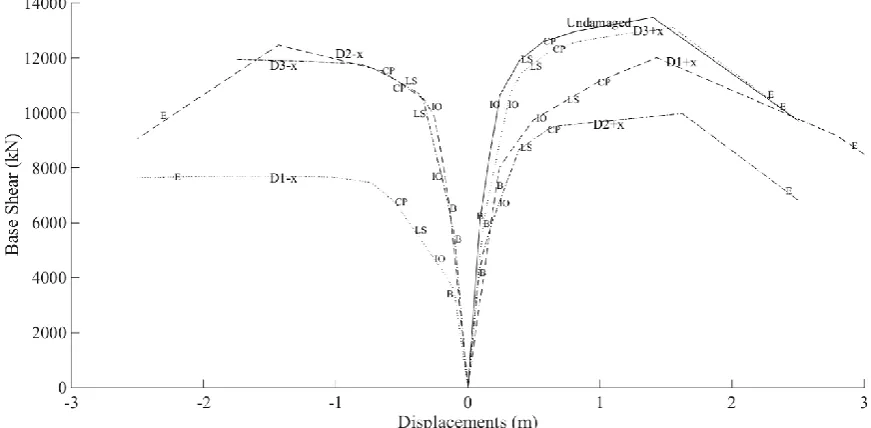
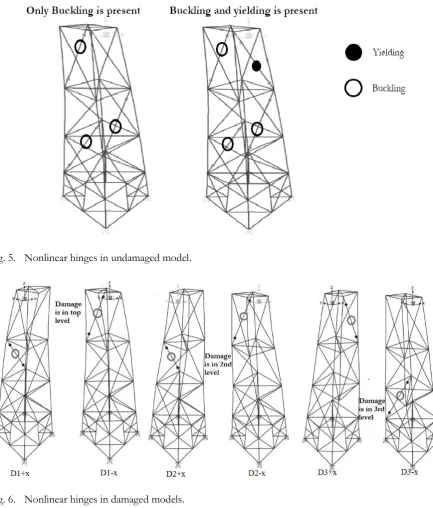
The nonlinear behavior of steel jacket offshore structures can be investigated by using pushover analyses. Pushover curves for different models are delineated in Fig. 4 and the formations of nonlinear hinges for undamaged conditions are illustrated in Fig. 5. Moreover, first nonlinear hinge (Damage state) formations for all damaged models are illustrated in Fig. 6. It should be noted that the formation of nonlinear hinges/damage states in certain local members depend on the amplitude of forces at that level and the availability of local members which will face damage due to buckling at the same level of redundancy. The first damage will be observed in the vertical bracings which are already reported in Nguyen and Sinsabvarodom [4] and the same phenomena can be noticed in this research as shown in Fig. 6. The initiations of plastic hinges at different force levels are dependent on mode of failure of local members. The mode of failure is comprised of either compression (Buckling) or tension (Yielding). These facts are dependent on the horizontal direction (+x and -x) of loading. The initiation of damage due to yielding requires higher force amplitudes than that of buckling and it is explained briefly through the following Fig. 5. The amplitude of forces is higher at the higher levels i.e. it increases along the height in a triangular pattern. According to this, the amplitude of pushover loads are as follows: Level 1 > Level 2 > Level 3. According to Fig. 4, the linear behavior within state (B) implies the undamaged condition with the base
shear around 6000 kN. The value of base shear in state “B” is higher for D1+x model because the first
[image:6.595.74.511.417.513.2]is subjected to yielding due to the direction of loading. In such cases, higher amplitude of forces will initiate damage. Before reaching that force level, a vertical bracing at Level 2 faces the first damage state due to compression (Fig. 6). For other damaged models, the elastic force limits (B) are lower than for the undamaged condition. The elastic force limit (B), immediate occupancy (IO) and the following force levels (LS, CP, E) are lowest in model (D1-x) compared with all other models. The base shear for initial damage in the first plastic hinge in state (B) of model (D1-x) is approximately 50 percent in comparison with the undamaged model. Due to the reverse direction of loading, the remaining vertical bracing at Level 1 is subjected to compression which initiates the damage state due to buckling. Moreover, the intensity of force amplitudes are highest as discussed before. For this reason, the force amplitudes decrease radically for the D1-x model. The corresponding forces for other damage states (IO, LS and CP) are significantly lower (approximately 50%) considering the undamaged model. D1-x is found as the most severe condition among all models. The behavior of D2+x is similar to the D1-x model. The corresponding base shear values for different damage states of D2+x is slightly higher than D1-x, but still significantly lower than for the undamaged model. From Fig. 6, it can be observed that the first hinge (damage state) occurs at Level 2 and redundancy is also present in Level 2. That is why required force amplitudes are considerably lower in D2+x too. It shows better performance considering D1-x as the damage occurs at Level 2 where force amplitudes are lower than Level 1. The load capacity of D2-x is superior to the previous damaged specimen (D2+x). From the same figure, it can be observed that the first damage occurs at Level 1 but that redundancy exists at Level 2. It means that the level shifts, because the remaining vertical bracing at Level 2 is subjected to yielding due to the direction of loading (-x). These two reasons are responsible for better performance of D2-x. The pushover curves of (D3+x) and (D3-x) models can be considered with better performance compared to D1 and D2 specimens, though less base shear capacity is found contrasting the undamaged condition in model 1. The corresponding base shear values for different damage states can be noted in Table 2. The reasons for different force thresholds of different damage states and different pushover curves are due to different directions of loading. This different direction of loading creates compression or yielding of local members. It depends on whether the member faces failure due to buckling or yielding and also on story levels which have already been discussed.
[image:7.595.78.514.458.672.2]Fig. 5. Nonlinear hinges in undamaged model.
Fig. 6. Nonlinear hinges in damaged models.
Table. 2. Formation of the nonlinear hinges for different models.
Condition Base B IO LS CP E
shear (kN)
Disp.
(m) shear Base (kN)
Disp.
(m) shear Base (kN)
Disp.
(m) shear Base (kN)
Disp.
(m) shear Base (kN)
Disp. (m)
Undamaged 6249.85 0.096 10691.46 0.248 11958.96 0.41 12598.32 0.6 10503.12 2.23
D1 +x 7356.09 0.216 9801.583 0.516 10471.05 0.75 11121.87 0.984 8816.82 2.90
D2 +x 4172.62 0.087 6697.832 0.235 8702.14 0.4 9389.83 0.6 7160.93 2.41
D3 +x 5955.26 0.12 10299.59 0.303 11689.08 0.47 12385.43 0.69 10220.32 2.36
D1 –x 3541.82 0.1 4671.149 0.252 5728.76 0.4 6758.47 0.55 7667.46 1.07
D2 –x 6529.90 0.136 10215.95 0.296 10954.62 0.47 11532.41 0.65 9618.76 2.33
[image:8.595.79.513.89.598.2] [image:8.595.68.527.370.574.2] [image:8.595.54.543.632.748.2]Table. 3. Calculation of Reserve Strength Ratio (RSR).
Safety Factor
Condition RSR
Undamaged 3.04
D1 +x 2.71
D1 –x 1.81
D2 +x 2.25
D2 –x 2.81
D3 +x 2.96
D3 –x 2.71
Table. 4. Calculation of Damage Strength Ratio (DSR).
Damaged Condition DSR
D1 +x 0.89144737
D1 -x 0.59539474
D2 +x 0.74013158
D2 -x 0.92434211
D3 +x 0.97368421
D3 -x 0.89144737
[image:9.595.189.407.106.233.2]RSR of different models can be observed in Table 3. It can be noted that the lowest value of RSR is for the D1-x case. The second lowest is for D2+x. For the other models, the values of RSR are more than 2.5. Table 4 describes the values of DSR. It can be noted that the value of DSR is lowest for D1-x. It means that the ultimate capacity reduces more than 40 percent due to removal of a single member in the top level. For D2+x, the DSR is 0.74 which is still acceptable, but for other models, the value is more than 0.85, which means that the capacity reduced due to member damage at lower stories is less than 15%. It can be concluded that the bracing members at top levels are significant enough for lateral load capacity of the jacket, and the behaviors of RSR and DSR are matched with the pushover curves and formation of first nonlinear hinges.
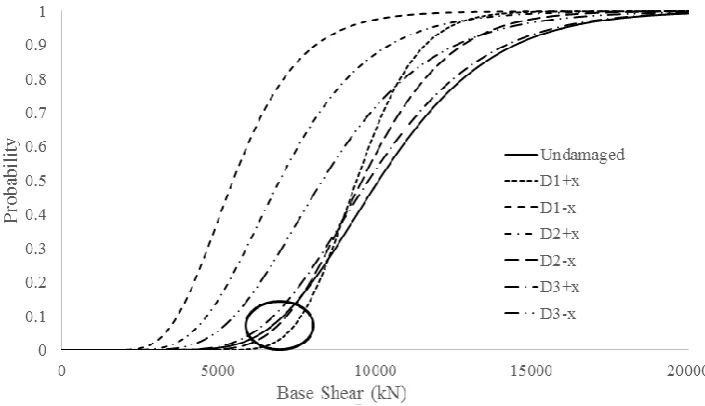
Fig. 7. Fragility curves of different damage models.
[image:9.595.193.403.272.371.2] [image:9.595.118.471.507.710.2]states are considered as B>IO>LS>CP>E. Five different data points (illustrated in Table 2) are used to fit the curve. It can be perceived that the D1-x is the most severe condition. D2+x and D3-x are the following severe models as described before. The behavior of D1+x, D2-x and D3+x are immediate to the undamaged model. In the red marked portion, it can be noticed that the force capacity of initial damage is higher for damaged models (D1+x, D2-x and D3+x). Moreover, after certain load levels, these become much lower than the intact model. The higher initiation force is due to the shifting of hinge formation of other story levels which already have been shown in Fig. 6. The range of damage initiation and ultimate capacity can also be noted in this figure. The ranges of different states of damage are comparatively much lower in the case of D1-x, D2+x and D1+x, but the range is higher for the rest which have closer values of intact models. Some more illustrations can be observed if we consider the RSR and DSR values. It can be noted that D1-x model has the worst performance from the fragility curve and RSR and DSR values. The RSR and DSR values of the model D1-x are 1.81 and 0.59. In the case of other models, the same approach is followed by the analysis results. The overall outcomes from the fragility curves indicate that bracings at higher levels are more significant for capacity of lateral loads. The fragility curves can state what is the probability of failure and at what base shear level. The pattern of RSR is followed by the fragility curve so that the designer can easily estimate the structural performance owing to redundant effects from nonlinear pushover analysis which takes lower computational time comparing with nonlinear dynamic time history analysis.
4.
Conclusions
Significant outcomes are observed from pushover curves. The force-displacement curves illustrated variable behaviors for different damaged conditions. The linear and nonlinear behaviors are substantially visible in the pushover curves. The ultimate capacity of the full structure decreases while the damage gradually increases to the upper levels. Different damage conditions clarify that the position of damage governs the nonlinear behavior and ultimate capacity of structures. Damage position affects the RSR and DSR values. The importance of different members can be identified from the RSR and DSR values. It is found that bracing members at upper levels have greater importance which follows the pushover curves. The fragility curves illustrate the identical consequences as pushover curve and strength parameters (RSR and DSR). The use of fragility curves has a notable relation with the pushover curves and strength parameters. A designer can consider the RSR and DSR in advance so that the structure can be robust, even though a single bracing member is damaged. RSR and DSR values can be used as reliable sources to understand the behavior in the case of redundant condition. Inspection must be planned in advance for other types of phenomena such as corrosion.
Acknowledgements
This project has received funding from the European Union’s Horizon 2020 research and innovation under
the Marie Skłodowska-Curie grant agreement No. 730888. The authors would like thank Dr. Pramin
Norachan for contributing knowledge on pushover analysis. The authors are also grateful to Dr. Naveed Anwar for arranging a software license for the research.
References
[1] M. Refachinhoa, C. Rigueirob, J. P. Martinsc, and R. Matosd, “Robustness, redundancy and
progressive collapse of fixed offshore structures,” ce/papers, vol. 1, no. 4, pp. 539-553, Dec. 2017. [2] C. Paliou, M. Shinozuka, and Y.-N. Chen, “Reliability and redundancy of offshore structures,” Journal
of Engineering Mechanics, vol. 116, no. 2, pp. 359-378, Feb. 1990.
[3] M. R. Awall, M. M. Hasan, and M. A. S. Hossain, “Redundancy analysis of an old steel railway bridge:
A case study of Hardinge bridge,” in Proc. IABSE-JSCE Joint Conference on Advances in Bridge Engineering-III, Dhaka, 2015, pp. 92-98.
[4] D. Nguyen and C. Sinsabvarodom, “Nonlinear behavior of a typical oil and gas fixed-jacket offshore
platform with different bracing systems subjected to seismic loading,” in Proc. the 20th National
[5] M. N. El-Din and J. Kim, “Seismic performance evaluation and retrofit of fixed jacket offshore platform structures,” J. Perform. Constr. Facil, vol. 29, no. 4, p. 04014099, Aug. 2015.
[6] M. N. El-Din and J. Kim, “Seismic performance of pile-founded fixed jacket platforms with chevron
braces,” Structure and Infrastructure Engineering, vol. 11, no. 6, pp. 776-795, May 2014.
[7] A. A. Golafshani, M. R. Tabeshpour, and Y. Komachia, “FEMA approaches in seismic assessment of
jacket platforms (Case study: Ressalat jacket of Persian gulf),” Journal of Constructional Steel Research, vol. 65, no. 10-11, pp. 1979-1986, Oct.-Nov. 2009.
[8] Petroleum and Natural Gas Industries–Offshore Structures–Part 1: General Requirements, ISO 19900,
International Standardisation Organisation, 2002.
[9] Design of Fixed Steel Jackets, DIS Draft, ISO/DIS 19902, International StandardisationOrganisation,
2004.
[10] American Petroleum Institute Recommended Practice for Planning, Design and Constructing Fixed Offshore
Platforms, API RP 2A, 21st ed. Washington, DC: American Petroleum Institute, 2000.
[11] American Petroleum Institute, Recommended Practice for Planning, Design and Constructing Fixed Offshore
Platforms, API RP 2A, 21st ed. Washington, DC: American Petroleum Institute, 2007, Errata and
Supplement 3.
[12] Federal Emergency Management Agency, “Prestandard and commentary for the seismic rehabilitation
of buildings,” Washington, DC, Report FEMA-356, 2000.
[13] J. Baker, “Efficient analytical fragility function fitting using dynamic structural analysis,” Earthquake
Spectra, vol. 31, no. 1, pp. 579-599, 2015.
[14] D. Vamvatsikos and C. A. Cornell, “Incremental dynamic analysis, “Earthquake Engineering & Structural
Dynamics, vol. 31, no. 3, pp. 491-514, Dec. 2002.
[15] P. Ni, S. Wang, L. Jiang, and R. Huang, “Seismic Risk Assessment of Structures Using Multiple Stripe
Analysis,” Applied Mechanics and Materials, vol. 226-228, pp. 897-900, 2012.
[16] H. White, “Maximum likelihood estimation of misspecified models,” Econometrica: Journal of the
Econometric Society, vol. 50, no. 1, pp. 1-25, Jan. 1982.
[17] W. K. Newey and K. D. West, “Hypothesis testing with efficient method of moments estimation,”
International Economic Review, vol. 28, no. 3, pp. 777-787, Oct. 1987.
[18] C. D. Montgomery, E. A. Peck, and C. G. Vining, Introduction to Linear Regression Analysis, 5th ed. John Wiley & Sons, 2012.
[19] M. Zeinoddini, H. M. Nikoo, and Y. Yaghubi, “Fragility curves of existing offshore platforms against
storm loads using Endurance Wave Analysis (EWA),” in Mechanics of Structures and Materials:
Advancements and Challenges, H. Hao and C. Zhang, Eds. London. 2017, pp. 903-909.
[20] W. Punurai, M. S. Azad, N. Pholdee, and N. Sinsabvarodom, “Adaptive meta-heuristic to predict dent
depth damage in the fixed offshore structures,” in Proc. European Safety and Reliability Conference, Norway, 2018, pp. 1143-1150.
[21] CSI, “Hinge property data for {Property Name} form - Deformation controlled,” in Sap2000 Training
Manual. Computers and Structures, Inc., 2018. [Online]. Available: http://docs.csiamerica.com/help/