This is a repository copy of Urban Transport Market Theoretical Analysis..
White Rose Research Online URL for this paper: http://eprints.whiterose.ac.uk/2165/
Monograph:
Preston, J.M., Toner, J.P. and Nash, C.A. (1993) Urban Transport Market Theoretical Analysis. Working Paper. Institute of Transport Studies, University of Leeds , Leeds, UK.
Working Paper 412
Reuse
See Attached
Takedown
If you consider content in White Rose Research Online to be in breach of UK law, please notify us by
White Rose Research Online
http://eprints.whiterose.ac.uk/
Institute of Transport Studies
University of Leeds
This is an ITS Working Paper produced and published by the University of Leeds. ITS Working Papers are intended to provide information and encourage discussion on a topic in advance of formal publication. They represent only the views of the authors, and do not necessarily reflect the views or approval of the sponsors.
White Rose Repository URL for this paper: http://eprints.whiterose.ac.uk/2165/
Published paper
Preston, J.M., Toner, J.P., Nash, C.A. (1993) Urban Transport Market
Theoretical Analysis. Institute of Transport Studies, University of Leeds. Working Paper 412
UNIVERSITY OF LEEDS
Institute for Transport Studies
ITS Working Paper 412
ISSN 0142-8942October 1993
URBAN TRANSPORT MARKET THEORETICAL
ANALYSIS
JM Preston
JP Toner
CA Nash
This work was fianaced by the Department of Transport, the Association of Metropolitan Authorities and the Passenger Transport Executive, and carried out as University of Leeds Research Support Unit Grant 446588.
ITS Working Papers are intended to provide information and encourage discussion on a topic in advance of formal publication. They represent only the views of the authors, and do not
CONTENTS
Page
EXECUTIVE SUMMARY
1.INTRODUCTION 1
2.BASE MODEL RUNS 4
3.SENSITIVITY ANALYSIS 6
4.CONCLUSIONS 8
URBAN TRANSPORT MARKET: THEORETICAL ANALYSIS
Executive Summary
1.The Institute for Transport Studies (ITS) was commissioned by the Department of Transport (DoT), the Association of Metropolitan Authorities (AMA) and the Passenger Transport Executive Group (PTEG) to undertake this project in November 1992.
2.The objectives of this study were:
(a)to establish a simple economic model of urban transport operations, based on present policies;
(b)to estimate, using the model, the theoretically optimal form of intervention in urban rail under the present policy constraints, and differences between this optimum and current procedures;
(c)to investigate how improved procedures might be implemented in practice in the light of the kind of data which are currently available or become available in the course of a Section 56 appraisal and to make suggestions for additional data collection.
3.The first objective was achieved by developing a stylised model of urban transport operations within a given corridor. This model was based loosely on work carried out by ITS in assessing new rail services between Mansfield and Nottingham. The model has been given the acronym MUPPIT (Model of Urban Pricing Policy in Transport) and contains a number of features which represent an advance over previous models of this type.
4.MUPPIT produces three main evaluation measures:
•a Financial Net Present Value (NPV), which takes into account rail operator costs and revenues. This is also referred to as financial appraisal;
•a Social NPV, which takes into account bus and rail operators' costs and revenues, and changes in bus, rail and car user times and costs, including accidents. This is also referred to as full social cost-benefit analysis;
•A Restricted Cost-Benefit Analysis (RCBA) NPV, which takes into account rail operator costs and revenues, and changes in car user times and costs, including the external element of accident costs. RCBA is required in a Section 56 appraisal. The Department of Transport's 1989 circular on Section 56 Grant for Public Transport indicated that the financial losses of an investment project should be minimised (ie maximise financial NPV) and that these losses should be exceeded by non-user benefits. In addition, additional grant, beyond the minimum required, may be provided if it can be shown that this is offset by an increase in non-user benefits (ie maximise RCBA NPV).
•bus operators reducing services or increasing fares in order to maintain profitability.
6.We interpreted the second objective as follows. In a situation where the policy maker cannot control prices in either the car market (where, without intervention, price will be below marginal social cost) or the bus market (where, without intervention, price will be above marginal social cost), then there are no simple rules concerning the optimal rail price. Second-best theory tells us that in such situations the optimal rail price may be either above or below marginal social cost. It is an empirical matter as to which should hold. One argument for the current `Section 56' appraisal procedures for new rail schemes is that the restricted cost-benefit analysis acts as a proxy for the optimal second-best prices for rail because they take into account the cross-elasticity between car and rail, and the extent of the divergence between marginal social cost and average social cost on the congested road system. It is this argument which we wished to test.
7.This was done by a series of runs of the MUPPIT model. It was found that:
•maximising Social NPV led to lower rail fares, higher rail frequencies and higher rail demand (typically 50% higher) than maximising RCBA NPV. Gross costs were typically 15% higher, gross benefits were 20% higher and net social benefit was typically over 60% higher when maximising Social NPV than when maximising RCBA NPV.
•rail user time and cost changes, which are included in a Social NPV measure but not in a RCBA or
Financial NPV measure, typically account for 28-50% of gross scheme benefits.
•maximising RCBA NPV typically led to lower rail fares, higher rail frequencies and higher rail demand than maximising Financial NPV, but the differences were not great.
•for the theoretical scheme being considered, in all model runs tested the RCBA NPV was negative, while in 90% of the model runs undertaken the Social NPV was positive.
8.These results were obtained consistently across a range of different scenarios, including:
•allowing for the indivisibility of rail supply by restricting rail frequency to integer numbers of trains per hour;
•taking into account lost tax revenue to Government;
•changing the income elasticities, price elasticities and speed-flow relationships used in the model.
9.We therefore conclude that the current procedures concerning the appraisal of new rail schemes can be distorting. In the theoretical case being examined, the current procedures would result in the scheme not being pursued, whereas the theoretically optimal form of intervention suggested by the Social NPV results would be to support the rail scheme through a capital grant. More generally, the results suggest that current procedures do not lead to the maximisation of the social benefits of any particular scheme.
the peak). This result is dependent on our assumption that the rail operator can only price discriminate in terms of distance travelled and time of travel, although we believe these are the two dimensions of discrimination most commonly used in practice for urban rail services.
11.Our third objective was achieved by analysing the model results. We conclude that the proper application of current procedures needs to take into account the interaction between rail, car and bus. Many practical applications of current procedures have neglected these interactions, thus potentially overstating the benefits of congestion relief, and have ignored the disbenefits to bus users. In other words, in practice the Financial, Social and RCBA NPVs may all be biased upwards thus strengthening the case for new rail schemes. This means that the actual divergence between current practice and the theoretical optimum may be smaller than our work has suggested. Moreover, taking into account re-congestion effects when apprasing rail schemes but not taking into account re-congestion when appraising road schemes (which, by and large, is current practice) would distort comparisons by local authorities and central government of road and rail schemes.
12.We have identified a number of areas where additional data collection could improve current practice:
•detailed data on base travel patterns;
•data on cross-elasticities of demand between modes; •data on user and operator cost characteristics by mode;
•data on the relationship between congestion, traffic patterns and new rail schemes; •data on actual responses by bus operators to new rail schemes.
A number of areas for further research are also suggested.
1. INTRODUCTION
1.1This note constitutes the final report on the above study, undertaken by the Institute for Transport Studies (ITS) on behalf of the Department of Transport (DoT), the Association of Metropolitan Authorities (AMA) and the Passenger Transport Executive Group (PTEG). 1.2The objectives of this study were as follows:
(a)to establish a simple economic model of urban transport operations, based on present policies,
(b)to estimate, using the model, the theoretically optimal form of intervention in urban rail under the present policy constraints and differences between this optimum and current procedures,
(c)to investigate how improved procedures might be implemented in practice in the light of the kind of data which are currently available or become available in the course of a Section 56 appraisal and to make suggestions for additional data collection.
1.3The main analytical tool used to achieve these objectives was a micro economic partial equilibrium model of stylised urban transport operations within a given corridor. This model has been based loosely on work we have done at ITS on the Nottingham-Mansfield corridor, is computer based and has been given the acronym MUPPIT (Model of Urban Pricing Policy in Transport). The approach adopted has some similarities with work undertaken by others (Beesley, Gist and Glaister, 1983; Glaister, 1987).
1.4Approaches based on adapting strategic integrated transport models such as START (MVA, 1992) were rejected for the following reasons:
•although these models are simplifications of the traditional land-use and transport study (LUTS) model the level of geographic detail is not appropriate for this study
•the feedback between demand and supply in these models is not usually explicit.
The use of area-wide simulation models such as GUTS (Game of Urban Transport Simulation; Ortuzar and Willumsen, 1978) and its successor PLUTO (Planning Land-Use and Transport Options; Bonsall, 1992) were rejected for similar reasons.
1.5The bulk of this report consists of the results of the base MUPPIT model runs (section 2), sensitivity analyses (section 3) and the conclusions (section 4).
1.6Three technical notes have been produced: on the underlying theory of second best pricing (Preston and Nash, 1993), on empirical evidence of urban transport elasticities (Toner, 1993) and on the details of the MUPPIT computer model of urban transport operations (Cooper and Preston, 1993).
1.7MUPPIT is corridor based and consists of three generation zones and one attraction zone. In the initial situation there are two modes (bus and car). A new mode (rail) is then introduced and its market share estimated using binary logit models.
1.8The binary logit models were not thought to be appropriate for sensitivity analysis. Instead negative exponential demand models were developed based on empirical evidence on price elasticities, values of time and abstraction rates. Linear additive public transport cost models have been developed, with car cost based on a parabolic speed-flow curve.
1.9It is believed that MUPPIT is an advance on previous models for the following reasons: •it focuses on a single corridor rather than a whole conurbation
•it can distinguish between peak and off-peak times of day
•it incorporates up-to-date empirical evidence on service elasticities
•all elasticities are transparent and capable of being changed by the model user
•speed-flow relationships can be adjusted to represent a variety of congested and uncongested conditions
•secondary effects of re-congestion on the road network are taken into account
•bus operations are constrained to earn normal profits (defined as a 10% mark-up on costs) •the shadow price of public funds can be incorporated
•accident costs have been included as per the DoT note on "The Treatment of Accidents in Section 56 Appraisals" (February 1992)
•demand changes over time have been taken into account through the assumption of a 30 year project life and real income growth of 2% per annum and the use of income elasticities.
1.10MUPPIT produces three main evaluation measures
•a Financial Net Present Value (NPV) that takes into account the changes in rail operator cost and revenue. This is also referred to as financial appraisal.
•a Social Net Present Value that takes into account changes in bus and rail operators' costs and revenues and changes in bus, rail and car user times and costs (including accidents and, if required, adjusted for taxation). This is also referred to as social cost-benefit analysis. Without adjusting for taxation, it is assumed that any loss of tax revenue to Government is compensated by equivalent savings in resource costs. With the tax adjustment, it is assumed that the loss of tax revenue to Government is a disbenefit. This is equivalent to assuming that taxation is a non resource cost and is the procedure used in road scheme appraisal.
•a Restricted Cost-Benefit Analysis (RCBA) Net Present Value that takes into account rail operator costs and revenue and changes in car user times and costs (including external elements of accident costs).
1.11MUPPIT has a numerical optimisation routine that adjusts rail fares and frequencies so as to maximise any of the three evaluation measures for any individual year or for all 30 years.
1.12MUPPIT has been written in FORTRAN, and can thus run on any hardware on which is mounted a suitable FORTRAN compiler. PC-based and SUN-based versions are currently available. For the PC-based version, 486 machines offer a considerably enhanced performance over 386 machines.
4 were as follows:
Base demand elasticities
Own elasticities Peak Off-peak
Bus Car Rail Bus Car Rail
Price elasticity -0.3 -0.1 -0.7 -0.5 -0.3 -0.9
In-vehicle time elasticity -0.132 -0.070 -0.267 -0.171 -0.129 -0.326
Headway elasticity -0.084 0 -0.195 -0.110 0 -0.220
Peak/off-peak elasticity 0.150 0.050 0.350
Income elasticity -0.3 1.2 0.6
1.14The theory behind MUPPIT is that of second-best pricing (see Preston and Nash, 1993). Optimal second-best pricing, where the price of both bus and rail can be adjusted to offset distortions in the car market, requires that the price of rail be set below its marginal cost given that car is priced below marginal cost and that car and rail are substitutes. Where the bus price cannot be controlled and is found to be above bus marginal cost, the restricted second-best price for rail can be either above or below marginal cost depending on the differences between price and marginal cost in the bus and car markets, the cross-elasticities between the modes and the extent of economies of scale in bus and rail operations.
2.
BASE MODEL RUNS
2.1For the base demand and cost models, the following MUPPIT runs were undertaken:
•maximise welfare
•maximise producer surplus •maximise RCBA net benefits.
In each case MUPPIT was run with a tax adjustment (assumes tax revenue lost by Government is a net disbenefit) and without a tax adjustment (ignores tax revenue lost by Government) and with and without integer service levels (to reflect indivisibility of supply). This involved 12 model runs in the base situation.
2.2Key outputs include rail fare for the three zones (outer, middle, inner) and two time periods (peak and off-peak) and Net Present Values, based on an 8% discount rate and a 30 year project life, for each of the three evaluation scenarios. The results are given by Tables One to Eight.
2.3Tables One, Two and Three refer to the situation where non integer rail service is permitted and there are no tax adjustments.
2.4Table One, part (a), shows that in all situations peak fares are substantially greater than off-peak fares and fares increase with distance from the central area. Welfare maximisation involves substantially lower fares and higher service levels than either profit maximisation (loss minimisation) or RCBA NPV maximisation. Rail fares tend to fall (with exceptions in the outer zones) and service levels increase between years one and thirty, reflecting the increased competitiveness of rail given road congestion. Rail fares and service levels are broadly the same between the profit maximising and RCBA maximising scenarios in year one but in year 30 the RCBA maximising scenario gives lower fares particularly in the peak. Again this is related to increased road congestion in year thirty. MUPPIT, as it currently stands, does not produce marginal cost calculations as part of the model output. However, marginal costs can be estimated from the outputs that are produced. For example, by comparing the producer surplus maximising and welfare maximising outputs in Table One, it was estimated that rail's marginal operating cost was £0.40 per passenger. It can be seen that all rail fares in Table One, part (a) are substantially above this level.
2.5Table One, part (b), illustrates the effect of the different policies on demand levels. In year one, under welfare maximisation, rail has a 10% share of trips to the centre, compared with the bus share of 52% and the car share of 38%. By year 30, rail's share has increased to 15%, car's share has increased to 47% and bus's share has decreased to 38%. Similar trends are found under the other two policy options. Rail demand in year one under welfare maximisation is 54% greater than rail demand in year one under producer surplus maximisation and 52% greater than under RCBA maximisation. By year 30, the corresponding figures are 64% and 56%.
6
the shadow price of public funds is set at 2.0, these results become -£3.3 million, -£24.8 million and -£20.8 million respectively. The middle row of this table also shows that, with a high shadow price of 2.0, there is little to choose between the various maximisation criteria in terms of the calculated social welfare effects, although the three NPV measures presented for each maximisation criteria remain strongly divergent. The evaluation results are clearly sensitive to assumptions concerning the shadow price of public funds. However, it should be noted that, unless stated otherwise, in what follows the results do not incorporate a shadow price of public funds.
2.7By contrast, profit maximisation reduces the Social NPV to £5.0 million but increases the RCBA NPV to -£5.7 million and the Financial NPV to -£9.2 million (i.e. a saving of £3.2 million in public funds). Similarly, RCBA maximisation reduces the Social NPV to £5.5 million and increases the RCBA NPV to (roundly) £5.7 million and the Financial NPV (roundly) to -£9.2 million. In evaluation terms, maximising Financial NPV and RCBA NPV is broadly the same. Compared with earlier results (Preston, 1992), we no longer are able to achieve a positive RCBA NPV as, due to re-congestion, non-user benefits are only valued at a maximum of £4 million over 30 years.
2.8Table Three, part (a), gives a breakdown of daily gross costs and benefits for the welfare maximisation option in years one and thirty. In year one, rail capital costs (annualised assuming a 30 year project life and an 8% interest rate) make up 53% of gross costs, compared to the 35% contributed by rail operating costs, the 8% contributed by cost changes to bus operators (due to declining absolute profits) and bus users (due to increased journey times as a result of service withdrawals) and the 4% contributed by rail accidents costs. In year thirty, rail capital costs, although constant in absolute terms, reduce in relative importance to 47% of gross costs, whilst rail operating costs increase to 37% and costs to the bus system increase to 10%. In terms of gross benefits in year one 40% are attributed to rail revenue, 50% to rail user benefits and only 10% to road user benefits. Only around 44% of rail users' willingness to pay is captured through the fare box and user benefits are five times larger than non-user benefits. However, by year thirty, non-user benefits increase to form 18% of gross benefits and user benefits are less than three times larger than non-user benefits.
2.9Table Three, part (b), breaks down daily costs and benefits for the objective of maximising rail producer surplus. The main features are that capital costs become relatively more important (contributing to 60% of gross costs in year one), the amount of rail users' willingness to pay captured by the fare-box has increased (to 56% in year one and to 65% in year thirty) and the ratio of user to non-user benefits has decreased (to 4:1 in year one and 1.3:1 in year thirty).
2.10Table Three, part (c), breaks down daily costs and benefits for the objective of maximising RCBA NPV. The results are broadly similar to those of maximising rail producer surplus, except that rail revenue is less important as a source of gross benefits and rail user benefit is more important, especially in year thirty.
present values. MUPPIT is not currently set up to provide such output but it is hoped that the program can be modified to do so in the future.
2.12Nevertheless, comparisons between Tables Three (a) and (c) give some indication of the causes of the differences in Social NPV under the various maximisation criteria noted in paragraphs 2.6 and 2.7 above. It can be seen that total benefits are some 22% higher in year one (20% in year thirty) under Social Welfare maximisation than under RCBA NPV maximisation and that the main difference is in rail user benefits (50% higher). Total costs, on the other hand, are only 18% higher in year one (16% in year thirty), with the main change being in rail operating costs (up 30%). Given that gross benefits and costs are quite similar in magnitude, these relatively slight differences in the percentage variations in gross costs and benefits translate into large differences in net benefits. Net benefits are 78% higher in year one (28% higher in year thirty) under Social Welfare maximisation than under RCBA NPV maximisation.
2.13Tables Four and Five refer to the situation where only an integer level of rail service is permitted and there is no tax adjustment. The main effect is that Financial NPV reduces with a corresponding effect on Social NPV and RCBA NPV. In some instances in Table Four (for example Outer, Peak - Year One), the fare when maximising RCBA NPV is higher than the fare which maximises rail producer surplus, despite the same frequencies. This result may be attributed to imprecision in the iteration process, and may be thought of as a form of rounding error (see also paragraph 3.2).
2.14Tables Six and Seven refer to the situation where non integer rail service is permitted and an adjustment is made to take into account transfers from highly taxed car to zero taxed rail. In Table Six fares tend to increase and service levels tend to decrease compared to Table One for the welfare maximisation and RCBA NPV maximisation scenarios (the producer surplus maximisation scenario is unaffected). As expected the social benefits of rail are reduced, with the maximum Social NPV being £5.5 million, the Financial NPV being -£11.7 million and the RCBA NPV being -£11.2 million. Assuming that the shadow price of public funds is 1.2, these figures become £2.2 million, -£14.0 million and - £13.5 million respectively. The reduction in the social benefits of rail means that the patronage under welfare maximisation and RCBA NPV maximisation is less than in the case where no tax adjustments are made.
2.15Tables Eight and Nine refer to the situation where only an integer level of rail service is permitted and tax adjustments have been made. Compared to Table Two, rail services are the same but rail fares tend to be higher for the maximise Social NPV and maximise RCBA NPV scenarios. The social benefits of rail are again reduced compared with the appropriate Table (Table Five), with the Social NPV reducing to £4.5m, the Financial NPV to -£12.8 million and the RCBA NPV reducing to -£12.0 million. Assuming that the shadow price of public funds is 1.2, these results become £1.9 million, -£15.4 million and -£14.6 million.
3. SENSITIVITY
ANALYSIS
8 Nineteen.
3.2Tables Ten and Eleven, which depict the case where income elasticities for all modes are set to zero, show that the assumption of traffic growth over time contributes substantially to the various NPV measures. Under no growth, the optimal fares and frequencies remain unchanged over time (subject to rounding errors). The result is that Producer Surplus maximisation and RCBA maximisation cannot show positive Social NPVs, given the particular values input into the model in this case study. This is because the lack of road traffic growth means there is no increase in congestion. It is also worth noting that the loss in social welfare from following Producer Surplus maximisation is reduced from £4.0 million (Table Two) to £2.9 million (Table Eleven) if there is zero traffic growth.
3.3Tables Twelve and Thirteen present the results under a conservative assumption of low road traffic growth, achieved by setting the road traffic income elasticity equal to 0.2 . The welfare maximisation and RCBA NPV maximisation results for year 30 have slightly higher fares and lower service levels than the base (Tables One and Two) and the NPVs are lower, with a Social NPV of £5.8 million under welfare maximisation (£9.0 million with higher growth), and a RCBA NPV of -£7.9 million (low growth) compared with -£5.7 million. Lower road traffic growth reduces the size of the decline in the bus market, due to slower growth in congestion making bus services more attractive. The increase in rail traffic over the life of the project is smaller, the smaller increase in road congestion meaning that fewer drivers switch to rail.
3.4Tables Fourteen and Fifteen show the effects of increasing the assumed own-price elasticities for public transport. The values tested were -0.8 for rail in the peak and -1.1 in the off-peak and -0.4 for bus in the peak and -0.7 in the off-peak. The most significant differences are the reduced fares under Producer Surplus maximisation, the increased off-peak service frequencies, and the reduced off-peak fares under welfare maximisation and RCBA NPV maximisation. This may lead to important changes in differentials. For example, in Table One the outer zone peak fare is 30% lower under welfare maximisation than under producer surplus maximisation. In Table Fourteen the difference is reduced to 26%. Whatever the optimand, each NPV measure (financial, social and RCBA) is reduced. For example, the Social NPV under welfare maximisation is £7.7 million compared with £9.0 million, and the Financial NPV under RCBA NPV maximisation is -£9.7 million compared with -£9.2 million.
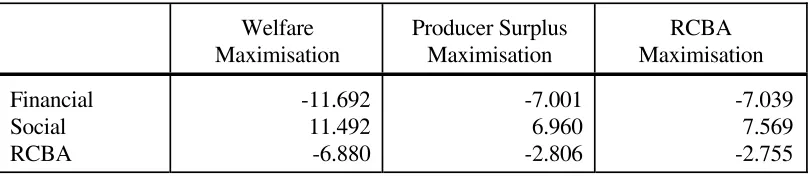
whichever measure is used. A 20% reduction in speeds causes the best RCBA NPV figure to increase from -£5.7 million to -£2.8 million, of which £2.1 million is due to the improved financial performance. So in more congested conditions, a scheme is more justifiable whatever the assessment criterion used.
4.CONCLUSIONS
4.1Results for all evaluation measures suggest in most cases that rail fares and frequency should be higher in the peak than the off-peak. Zonal fares should increase with distance but not in a strict proportional manner.
4.2Three different objectives have been assessed: •minimise losses (i.e. maximise Financial NPV)
•maximise net external benefits, defined in our model as benefits to road users (i.e. maximise RCBA NPV)
•maximise net social benefits (i.e. maximise Social NPV), either unconstrained or constrained so that rail revenue covers operating costs. (In this example, it turned out that maximising Net Social Benefits always resulted in rail revenue covering operating costs.)
4.3The model results show that the main trade-off is between subsidy and unpriced user benefits. For example, taking Table Two, part (a), and comparing the results of welfare maximisation with those of producer surplus maximisation, our work suggests that spending an additional £3.22 million on subsidy yields an additional £0.50 million in non-user benefits and £6.74 million in user benefits. User benefits are substantial and can not be fully captured through pricing-up. This result is dependent on our assumption that the rail operator can only price discriminate in terms of distance travelled and time of travel. However, we believe this assumption is realistic for urban transport but may be less so for inter-urban transport where more sophisticated price discrimination may be practised.
4.4Throughout the model runs, it was not possible to obtain a positive RCBA NPV measure, notwithstanding that a number of actual studies of new rail schemes have done so (Preston, 1992; Tyson, unpublished). A possible reason for this is that, while conventional studies have calculated only the first round decongestion benefits to remaining road traffic on the introduction of rail, MUPPIT then allows a transfer back from rail to road as a result of increased traffic speeds, and keeps on iterating until the road system has reached a stable equilibrium position. The true benefits of RCBA maximisation, given by the Social NPV, are always considerably less than the optimal form of intervention as given by the Social NPV under welfare maximisation. Indeed, because RCBA maximisation does not coincide with welfare maximisation, a choice of projects based on the RCBA criterion may lead to the wrong decision being made, since the RCBA NPV result under welfare maximisation is necessarily inferior to the best RCBA NPV. While the precise results obtained depend on the input parameters, the pattern is clear. The base case obtains net social benefits of £5.468 million if RCBA benefits are maximised compared with a theoretical maximum of £9.040 million. This sort of difference of £3 million or so (or one third of the net benefits) occurs across all the scenarios evaluated.
10
costs, so obviating the need for grant, unless above average values of time for some or all transferring car users allow higher public transport revenue while maintaining non-user benefits. It should be noted that the model used assumes relatively low values of time (around one to two pence per minute at 1988 prices) and hence low in-vehicle time elasticities. In addition, it should be noted that in the case study modelled only a modest volume of traffic is abstracted from road (around 2,800 person trips per day or 2,300 vehicle trips per day in year one of the base run) and that the road system is relatively uncongested.
4.6We are aware that recent studies in South Hampshire and Leeds have resulted in evaluations in which the RCBA NPV has been positive but the Financial NPV has been negative, eventhough use was made of a modelling technique (SATCHMO) that allows for the second round effects of re-congestion (Willumsen et al., 1993). The South Hampshire and Leeds studies assume higher values of motorists' time (6.8 pence per minute and 5.4 pence per minute respectively) and may have forecast higher volumes of traffic abstracted from road or assumed higher base levels of congestion (or both) than in our study.
4.7It is also clear that it is necessary for the input parameters, that is the elasticities, the valuations of time and the speed-flow relationships, to be determined accurately in each application of the model. Importing incorrect parameters from elsewhere may cause unacceptably large divergences between forecast and actual financial and social performances of schemes. However, in the case studied the sensitivity tests showed that, over plausible ranges, the same result occurred, namely that the new rail scheme could be justified on the basis of a full social benefit appraisal but could not be justified on the basis of a restricted cost-benefit (Section 56) appraisal.
4.8Results suggest that the rail fares and frequencies resulting from the objective of maximising net social benefits are different from the other objectives. The results from financial appraisal and restricted social cost-benefit analysis appear broadly similar. The results of the model runs largely conform to a priori expectations. Welfare maximisation generally leads to noticeably higher frequencies and lower fares than producer surplus maximisation or RCBA NPV maximisation. RCBA NPV maximisation more often than not produces higher frequencies and lower fares than producer surplus maximisation, but the difference is often not pronounced.
4.9Sensitivity analysis has been undertaken with respect to income, price and service elasticities, and with respect to speed-flow conditions. This has shown that the benefits of potential schemes depend crucially on forecasts of overall traffic growth, in particular on increasing traffic creating congestion which a scheme can then alleviate.
4.11Detailed recommendations on the way that Section 56 appraisal may be implemented in the light of the way data are currently available or become available in the course of an appraisal have been made by HFA (1991). Our work has highlighted the following areas where existing practice requires particular improvement:
•the determination of base year matrices, times and costs for bus and car;
•the need for a modelling process which deals explicitly with suppressed and generated trips. Our approach was based on negative exponential functions, although other functional forms could be used;
•demand and cost models are required to determine the appropriate fares for rail under a given set of objectives. These fares should vary by time of day and distance;
•the need to take into account the effect of recongestion of the road network. Our work was based on truncated parabolic area speed-flow curves. A particular problem emerged in conditions of saturation, where it was necessary to cap demand on the road network. Nevertheless, at the new equilibrium, typically only two-thirds of the traffic initially abstracted from road remains with rail, a figure consistent with the 50-75% range suggested by HFA. It should, though, be noted that taking into account re-congestion when appraising rail schemes but not taking re-congestion into account when appraising road schemes (by and large the current practice) would distort comparisons by local authorities and central government of road and rail scheme returns;
•the need to take into account the effects on the bus network. In order to maintain normal profits, bus operators are assumed to reduce service frequencies. This leads to losses in consumer surplus for existing bus users. This effect has been neglected by many studies;
•the effects on accidents are non-trivial and should be included as a separate item rather than lumped together with time savings and operating cost reductions;
•important changes in demand and supply will occur over the life of a project, and these should be explicitly considered.
4.12The main points to emerge from our study are, firstly, that it is not sensible to examine a rail scheme in isolation, since there are important interactions between modes. In particular, the interaction with the bus market has been neglected in past studies. Secondly, we have highlighted that one of the main areas for improvement is the use of demand and cost models to determine the optimal level and structure of fares for any given objective and the use of these models to assess how these fares and service levels might change over the appraisal period.
4.13In terms of additional data collection, we suggest the following:
•Our theoretical work has shown that the key determinants of optimal rail price in the restricted second-best case considered are:
-the cross-elasticities of rail, bus and car demand. Additional empirical evidence is required, possibly based on diversion factors (that is, the proportion of new demand on mode A abstracted from mode B);
12
•work should be undertaken on assessing the impact of new urban rail services on area speed-flow relationships for the competing road system;
•work should be undertaken on assessing the response of competing bus operators to new urban rail services.
We understand that monitoring work has been commissioned by the DoT and others on the Manchester Metrolink and Sheffield Supertram schemes, and we recommend that the issues mentioned here be addressed in these studies.
4.14In terms of further work, we suggest the following:
•continued development and testing of MUPPIT. For example, as part of his dissertation, an MA student is using the program to assess the effect which road pricing might have on new rail schemes;
•the development of network based approaches. We have assumed a single link between each origin and destination pair and have therefore avoided the problems of definition of base year and future networks and assignments. However, this has also meant that we have only been able to measure congestion on the basis of area speed-flow relationships. A network-based approach would allow more detailed congestion monitoring based on junction delay. Use of the nascent elastic assignment and multi-modal assignment packages (such as SATCHMO) might be considered;
•an extension to include the effects of environmental and developmental benefits;
•comparison of the results from this study with the results of similar studies based on strategic integrated transport models and area-wide simulation models;
•the implications of our work with respect to the common investment appraisal framework project is that the framework should be capable of comparing the performance of different price/service level options for any given rail scheme. Further, such comparisions should be able to bring out the probable trade-off between user benefits and financial appraisal and the impacts on bus service levels and patronage of the introduction of competing rail-based transport. We understand that the proposed framework put forward by MVA (1993) seems to meet these requirements.
4.15Overall, we conclude that current procedures for determining intervention in the urban rail market and the optimal form of intervention exhibit important differences. Hence, if Section 56 appraisals are undertaken, the restricted cost-benefit analysis should be accompanied by full social cost-benefit analysis so that any distortions which do arise are clear. The Department of Transport has acknowledged, in a House of Commons Written Answer in July 1992 that full cost-benefit analysis may have a wider role to play in urban transport schemes. The recent Transport Policies and Programme Circular (2/93) specifically asked local authorities to supplement Section 56 grant appraisal with the results of a full social cost-benefit analysis.
ACKNOWLEDGEMENTS
14 Table One (a)
Rail Fares and Service Levels (Non Integer Service Levels and No Tax Adjustment)
Welfare Maximisation Producer Surplus Maximisation RCBA Maximisation
Year 1 Year 30 Year 1 Year 30 Year 1 Year 30
Outer - Peak Fare - Off-Peak Fare Middle - Peak Fare - Off-Peak Fare Inner - Peak Fare - Off-Peak Fare Service - Peak - Off-Peak £1.40 £0.85 £0.96 £0.72 £0.51 £0.39 2.35 1.63 £1.43 £0.71 £0.88 £0.63 £0.49 £0.32 2.81 2.04 £1.99 £1.44 £1.48 £1.06 £0.79 £0.54 1.71 1.10 £2.01 £1.44 £1.48 £1.06 £0.79 £0.54 1.87 1.35 £1.99 £1.39 £1.47 £1.09 £0.76 £0.56 1.82 1.11 £1.85 £1.39 £1.29 £1.01 £0.73 £0.54 1.87 1.36
Table One (b)
Daily Demand Levels (Non Integer Service Levels and No Tax Adjustment)
Welfare Maximisation
Producer Surplus Maximisation
RCBA Maximisation
Year 1 Year 30 Year 1 Year 30 Year 1 Year 30
Table Two (a)
Net Present Values (Non Integer Service Levels and No Tax Adjustment) (£m)
Welfare
Maximisation
Producer Surplus
Maximisation
RCBA Maximisation
Financial Social RCBA
-12.383 9.040 -8.400
-9.163 5.017 -5.686
-9.181 5.468 -5.657
Table Two (b)
Net Present Values (Non Integer Service Levels and No Tax Adjustment. Shadow Pice of Public Funds 1.2) (£m)
Welfare
Maximisation
Producer Surplus
Maximisation
RCBA Maximisation
Financial Social RCBA
-14.860 6.563 -10.877
-10.997 3.184 -7.519
-11.017 3.631 -7.493
Table Two (c)
Net Present Values (Non Integer Service Levels and No Tax Adjustment. Shadow Price of Public Funds 2.0) (£m)
Welfare
Maximisation
Producer Surplus
Maximisation
RCBA Maximisation
Financial Social RCBA
-24.766 -3.343 -20.783
-18.326 -4.146 -14.849
-18.362 -3.713
16
Table Three (a) Breakdown of Daily Costs and Benefits. Welfare Maximisation. (Non Integer Service Levels and No Tax Adjustments) (£)
Year One
Costs % Benefits %
Rail Capital 4427.1 53 Rail Revenue 3712.7 40
Rail Operating 2962.0 35 Rail User 4649.3 50
Bus Operator 449.4 5 Car Users 344.0 4
Bus User 277.5 3 Car Accidents 559.5 6
Rail Accidents 301.9 4 Bus Accidents 42.3 -
TOTAL 8417.9 100 9307.8 100
Year Thirty
Costs % Benefits %
Rail Capital 4427.1 47 Rail Revenue 5091.8 33
Rail Operating 3443.8 37 Rail User 7430.6 49
Bus Operator 670.4 7 Car Users 1925.2 13
Bus User 299.5 3 Car Accidents 733.8 5
Rail Accidents 489.7 5 Bus Accidents 26.8 -
TOTAL 9330.5 100 15208.2 100
Table Three (b) Breakdown of Daily Costs and Benefits. Producer Surplus Maximisation. (Non Integer Service Levels and No Tax Adjustments) (£)
Year One
Costs % Benefits %
Rail Capital 4213.6 60 Rail Revenue 3730.5 50
Rail Operating 2267.9 32 Rail User 3007.8 40
Bus Operator 57.9 - Car Users 315.6 4
Bus User 331.7 5 Car Accidents 413.1 6
Rail Accidents 196.1 3 Bus Accidents 42.3 -
Table Three (b) Continued
Year Thirty
Costs % Benefits %
Rail Capital 4427.1 56 Rail Revenue 5506.3 52
Rail Operating 2542.8 32 Rail User 2963.6 28
Bus Operator 587.5 7 Car Users 1695.4 16
Bus User 107.5 1 Car Accidents 491.6 5
Rail Accidents 297.8 4 Bus Accidents 16.6 -
TOTAL 7962.7 100 10673.5 100
Table Three (c) Breakdown of Daily Costs and Benefits. RCBA NPV Maximisation. (Non Integer Service Levels and No Tax Adjustments) (£)
Year One
Costs % Benefits %
Rail Capital 4213.6 59 Rail Revenue 3751.2 49
Rail Operating 2291.7 32 Rail User 3078.6 41
Bus Operator 73.5 1 Car Users 317.3 4
Bus User 329.3 5 Car Accidents 419.4 6
Rail Accidents 199.6 3 Bus Accidents 42.3 -
TOTAL 7107.7 100 7608.8 100
Year Thirty
Costs % Benefits %
Rail Capital 4427.1 55 Rail Revenue 5524.3 44
Rail Operating 2568.5 32 Rail User 4858.2 38
Bus Operator 593.9 7 Car Users 1731.3 14
Bus User 125.9 2 Car Accidents 506.2 4
Rail Accidents 314.4 4 Bus Accidents 17.4 -
18 Table Four (a)
Rail Fares and Service Levels (Integer Service Levels and No Tax Adjustment)
Welfare Maximisation Producer Surplus Maximisation RCBA Maximisation
Year 1 Year 30 Year 1 Year 30 Year 1 Year 30
Outer - Peak Fare - Off-Peak Fare Middle - Peak Fare - Off-Peak Fare Inner - Peak Fare - Off-Peak Fare Service - Peak - Off-Peak £1.48 £0.81 £1.03 £0.65 £0.53 £0.34 2.00 2.00 £1.38 £0.72 £0.86 £0.65 £0.61 £0.25 3.00 2.00 £1.98 £1.46 £1.46 £1.09 £0.78 £0.56 2.00 1.00 £1.98 £1.46 £1.46 £1.09 £0.80 £0.54 2.00 1.00 £2.00 £1.40 £1.40 £1.08 £0.75 £0.57 2.00 1.00 £1.82 £1.40 £1.28 £1.06 £0.74 £0.55 2.00 1.00
Table Four (b)
Daily Demand Levels (Integer Service Levels and No Tax Adjustment)
Welfare Maximisation
Producer Surplus Maximisation
RCBA Maximisation
Year 1 Year 30 Year 1 Year 30 Year 1 Year 30
Bus Car Rail 23894 17485 5179 17380 24548 8640 24626 18249 3136 18287 26083 4746 24610 18232 3189 18138 25967 4978 Table Five
Net Present Values (Integer Service Levels and No Tax Adjustment) (£m)
Welfare
Maximisation
Producer Surplus
[image:24.595.70.530.341.448.2]Table Six (a)
Rail Fares and Service Levels (Non Integer Service Levels and Tax Adjustments)
Welfare Maximisation Producer Surplus Maximisation RCBA Maximisation
Year 1 Year 30 Year 1 Year 30 Year 1 Year 30
Outer - Peak Fare - Off-Peak Fare Middle - Peak Fare - Off-Peak Fare Inner - Peak Fare - Off-Peak Fare Service - Peak - Off-Peak £1.42 £0.95 £1.03 £0.74 £0.51 £0.41 2.29 1.60 £1.44 £0.81 £0.93 £0.69 £0.50 £0.34 2.81 2.05 £1.99 £1.44 £1.48 £1.06 £0.79 £0.54 1.71 1.11 £2.01 £1.44 £1.48 £1.06 £0.79 £0.54 1.87 1.35 £2.05 £1.54 £1.50 £1.12 £0.79 £0.56 1.69 1.07 £1.95 £1.48 £1.43 £1.12 £0.77 £0.57 1.88 1.31
Table Six (b)
Daily Demand Levels (Non Integer Service Levels and Tax Adjustments)
Welfare Maximisation
Producer Surplus Maximisation
RCBA Maximisation
Year 1 Year 30 Year 1 Year 30 Year 1 Year 30
Bus Car Rail 24070 17649 4786 19611 24789 7751 24642 18245 3218 20475 25960 4885 24699 18301 3041 20502 25998 4760 Table Seven
Net Present Values (Non Integer Service Levels and Tax Adjustments) (£m)
Welfare
Maximisation
Producer Surplus
20 Table Eight (a)
Rail Fares and Service Levels (Integer Service Levels and Tax Adjustments)
Welfare Maximisation Producer Surplus Maximisation RCBA Maximisation
Year 1 Year 30 Year 1 Year 30 Year 1 Year 30
Outer - Peak Fare - Off-Peak Fare Middle - Peak Fare - Off-Peak Fare Inner - Peak Fare - Off-Peak Fare Service - Peak - Off-Peak £1.52 £0.92 £1.07 £0.73 £0.54 £0.37 2.00 2.00 £1.41 £0.81 £0.92 £0.71 £0.59 £0.28 3.00 2.00 £1.98 £1.46 £1.46 £1.09 £0.78 £0.56 2.00 1.00 £1.98 £1.46 £1.46 £1.09 £0.78 £0.54 2.00 1.00 £2.08 £1.49 £1.44 £1.15 £0.77 £0.58 2.00 1.00 £1.91 £1.51 £1.39 £1.14 £0.77 £0.57 2.00 1.00
Table Eight (b)
Daily Demand Levels (Integer Service Levels and Tax Adjustments)
Welfare Maximisation
Producer Surplus Maximisation
RCBA Maximisation
Year 1 Year 30 Year 1 Year 30 Year 1 Year 30
Bus Car Rail 24001 17600 4991 17491 24645 8323 24626 18249 3136 18287 26083 4746 24655 18279 3054 18254 26047 4685 Table Nine
Net Present Values (Integer Service Levels and Tax Adjustments)
Welfare
Maximisation
Producer Surplus
Table Ten (a)
Rail Fares and Service Levels (Non Integer Service Levels and No Tax Adjustment) with no traffic growth
Welfare Maximisation Producer Surplus Maximisation RCBA Maximisation
Year 1 Year 30 Year 1 Year 30 Year 1 Year 30
Outer - Peak Fare - Off-Peak Fare Middle - Peak Fare - Off-Peak Fare Inner - Peak Fare - Off-Peak Fare Service - Peak - Off-Peak £1.40 £0.85 £0.96 £0.72 £0.51 £0.39 2.35 1.63 £1.41 £0.85 £0.96 £0.72 £0.51 £0.39 2.35 1.63 £1.99 £1.44 £1.48 £1.06 £0.79 £0.54 1.71 1.11 £1.99 £1.44 £1.48 £1.06 £0.77 £0.56 1.74 1.10 £1.99 £1.39 £1.47 £1.04 £0.76 £0.56 1.82 1.11 £1.93 £1.43 £1.39 £1.04 £0.76 £0.56 1.84 1.09
Table Ten (b)
Daily Demand Levels (Non Integer Service Levels and No Tax Adjustment) with no traffic growth
Welfare Maximisation
Producer Surplus Maximisation
RCBA Maximisation
Year 1 Year 30 Year 1 Year 30 Year 1 Year 30
Bus Car Rail 23978 17551 4952 23961 17556 4955 24642 18245 3218 24789 18235 3184 24620 18220 3275 24763 18214 3238 Table Eleven
Net Present Values (Non Integer Service Levels and No Tax Adjustment) (£m) with no traffic growth
Welfare
Maximisation
Producer Surplus
[image:27.595.74.525.127.303.2]22 Table Twelve (a)
Rail Fares and Service Levels (Non Integer Service Levels and No Tax Adjustment) with low car traffic growth
Welfare Maximisation Producer Surplus Maximisation RCBA Maximisation
Year 1 Year 30 Year 1 Year 30 Year 1 Year 30
Outer - Peak Fare - Off-Peak Fare Middle - Peak Fare - Off-Peak Fare Inner - Peak Fare - Off-Peak Fare Service - Peak - Off-Peak £1.40 £0.85 £0.96 £0.72 £0.51 £0.39 2.35 1.63 £1.46 £0.75 £1.00 £0.64 £0.53 £0.34 2.70 2.00 £1.99 £1.44 £1.48 £1.06 £0.79 £0.54 1.71 1.11 £2.00 £1.43 £1.48 £1.06 £0.79 £0.54 1.88 1.32 £1.99 £1.39 £1.47 £1.04 £0.76 £0.56 1.82 1.11 £1.93 £1.42 £1.41 £1.07 £0.78 £0.55 1.87 1.31
Table Twelve (b)
Daily Demand Levels (Non Integer Service Levels and No Tax Adjustment) with low car traffic growth
Welfare Maximisation
Producer Surplus Maximisation
RCBA Maximisation
Year 1 Year 30 Year 1 Year 30 Year 1 Year 30
Bus Car Rail 23978 17551 4952 20056 18973 7367 24642 18245 3218 20959 19889 4591 24620 18220 3275 20997 19880 4608 Table Thirteen
Net Present Values (Non Integer Service Levels and No Tax Adjustment) (£m) with low car traffic growth
Welfare
Maximisation
Producer Surplus
Table Fourteen (a)
Rail Fares and Service Levels (Non Integer Service Levels and No Tax Adjustment) with higher price elasticities
Welfare Maximisation Producer Surplus Maximisation RCBA Maximisation
Year 1 Year 30 Year 1 Year 30 Year 1 Year 30
Outer - Peak Fare - Off-Peak Fare Middle - Peak Fare - Off-Peak Fare Inner - Peak Fare - Off-Peak Fare Service - Peak - Off-Peak £1.37 £0.73 £0.81 £0.64 £0.40 £0.35 2.36 1.82 £1.49 £0.58 £0.92 £0.51 £0.58 £0.23 2.81 2.49 £1.84 £1.19 £1.35 £0.88 £0.71 £0.45 1.72 1.24 £1.85 £1.18 £1.35 £0.90 £0.75 £0.44 1.87 1.57 £1.78 £1.19 £1.33 £0.86 £0.69 £0.46 1.81 1.23 £1.72 £1.15 £1.17 £0.85 £0.70 £0.45 1.87 1.55
Table Fourteen (b)
Daily Demand Levels (Non Integer Service Levels and No Tax Adjustment) with higher price elasticities
Welfare Maximisation
Producer Surplus Maximisation
RCBA Maximisation
Year 1 Year 30 Year 1 Year 30 Year 1 Year 30
Bus Car Rail 23187 17260 5699 17844 23509 10258 24004 18152 3755 19124 25395 5993 23982 18131 3785 19038 25327 6190 Table Fifteen
Net Present Values (Non Integer Service Levels and No Tax Adjustment) (£m) with higher price elasticities
Welfare
Maximisation
Producer Surplus
24 Table Sixteen (a)
Rail Fares and Service Levels (Non Integer Service Levels and No Tax Adjustment) with speeds reduced by 10%
Welfare Maximisation Producer Surplus Maximisation RCBA Maximisation
Year 1 Year 30 Year 1 Year 30 Year 1 Year 30
Outer - Peak Fare - Off-Peak Fare Middle - Peak Fare - Off-Peak Fare Inner - Peak Fare - Off-Peak Fare Service - Peak - Off-Peak £1.29 £0.78 £0.80 £0.69 £0.48 £0.35 2.46 1.76 £1.52 £0.64 £0.94 £0.58 £0.60 £0.26 2.81 2.24 £2.03 £1.41 £1.49 £1.07 £0.82 £0.52 1.72 1.18 £2.03 £1.41 £1.49 £1.07 £0.82 £0.52 1.87 1.45 £1.91 £1.41 £1.41 £1.05 £0.81 £0.52 1.86 1.17 £1.84 £1.36 £1.30 £1.03 £0.75 £0.53 1.87 1.45
Table Sixteen (b)
Daily Demand Levels (Non Integer Service Levels and No Tax Adjustment) with speeds reduced by 10%
Welfare Maximisation
Producer Surplus Maximisation
RCBA Maximisation
Year 1 Year 30 Year 1 Year 30 Year 1 Year 30
[image:30.595.70.478.543.629.2]Bus Car Rail 22897 17271 5798 18208 24211 9325 23677 18097 3638 19284 25689 5507 23645 18065 3727 19225 25624 5750 Table Seventeen
Net Present Values (Non Integer Service Levels and No Tax Adjustment) (£m) with speeds reduced by 10%
Welfare
Maximisation
Producer Surplus
Table Eighteen (a)
Rail Fares and Service Levels (Non Integer Service Levels and No Tax Adjustment) with speeds reduced by 20%
Welfare Maximisation Producer Surplus Maximisation RCBA Maximisation
Year 1 Year 30 Year 1 Year 30 Year 1 Year 30
[image:31.595.73.477.541.629.2]Outer - Peak Fare - Off-Peak Fare Middle - Peak Fare - Off-Peak Fare Inner - Peak Fare - Off-Peak Fare Service - Peak - Off-Peak £1.56 £0.72 £0.94 £0.65 £0.40 £0.34 2.43 1.85 £1.56 £0.59 £0.94 £0.56 £0.65 £0.24 2.81 2.35 £2.05 £1.40 £1.51 £1.05 £0.82 £0.53 1.77 1.26 £2.05 £1.40 £1.51 £1.05 £0.84 £0.52 1.87 1.53 £1.98 £1.35 £1.44 £1.05 £0.82 £0.53 1.86 1.24 £1.84 £1.34 £1.31 £1.03 £0.79 £0.53 1.87 1.55
Table Eighteen (b)
Daily Demand Levels (Non Integer Service Levels and No Tax Adjustment) with speeds reduced by 20%
Welfare Maximisation
Producer Surplus Maximisation
RCBA Maximisation
Year 1 Year 30 Year 1 Year 30 Year 1 Year 30
Bus Car Rail 22177 16984 6463 17214 23783 10577 22979 17840 4030 18313 25424 6115 22954 17817 4088 18248 25368 6347 Table Nineteen
Net Present Values (Non Integer Service Levels and No Tax Adjustment) (£m) with speeds reduced by 20%
Welfare
Maximisation
Producer Surplus
26
REFERENCES
Bates, J and Lowe, S (1989) "Criteria for Public Sector Support in Urban Public Transport", PTRC
Beesley, M, Gist, P and Glaister, S (1983) "Cost Benefit Analysis and London's Transport Policies",
Progress in Planning, pp169-269
Bonsall, P (1992) "PLUTO Computer Assisted Training for Transport Planners", UTSG
Conference, Newcastle
Cooper, A and Preston, J (1993) "MUPPIT Model Development", Technical Note 2, Urban
Transport Market Theoretical Analysis Project
Department of Transport (1989) "Section 56 Grant for Public Transport", Circular 3/89
Glaister, S (1987) "Allocation of Urban Public Transport Subsidy", in Glaister, S (ed) Transport
Subsidy, Policy Journals, Newbury
Halcrow Fox and Associates (HFA) (1991) Research into the Application of Section 56 Grant
Criteria: Phase Two. Summary and Appraisal Guide Report for the Passenger Transport Executive Group with the Department of Transport
Halcrow Fox and Associates et al. (1993) "Road Pricing in London: Review and Specification of
Model Elasticities". Final Report. Prepared for the Department of Transport.
Meyer, J, Kain, J and Wohl, M (1965) The Urban Transportation Problem, Harvard University
Press, Cambridge, Mass.
MVA (1992) "Strategic Transport Policy Model Development and Testing Exercise", Interim
Report
MVA et al. (1993) "Common Appraisal Framework for Urban Transport Projects", Interim Report
Mackie, P and Preston, J (1988) "Competition in the Urban Bus Market: A Case Study", PTRC
Summer Annual Meeting, Bath.
Preston, J (1989) "Nottingham - Mansfield - Worksop New Rail Service Project", Final Report
Prepared for Nottinghamshire County Council.
Ortuzar, J and Willumsen, L (1978) "Learning to Manage Transport Systems", Traffic Engineering
and Control, 19,5,236
Preston, J (1992) "Financing New Local Rail Services", World Conference on Transport Research,
Lyon, France
Preston, J and Nash, C (1993) "An Application of Second Best Pricing Theory", Technical Note 1,
Toner, J (1993) "Review of Urban Demand Elasticities", Technical Note 2, Urban Transport Market Theoretical Analysis Project
Willumsen, L, Bolland, J, Hall, M and Arezki, Y (1993) "Multi-modal Modelling in Congested
Networks: SATURN and SATCHMO". Traffic Engineering and Control, 34, 6, 294-301.