Measuring University-Business Links in the
United States
A report for HEFCE
“Not everything that counts can be counted, and not everything that can be counted counts”
Author Affiliations
Tomas Coates Ulrichsen, Centre for Science, Technology and Innovation Policy, University of Cambridge
Professor Alan Hughes, Centre for Business Research, and Margaret Thatcher Professor (Emeritus) of Enterprise Studies at the Judge Business School, University of Cambridge
Contents
Author Affiliations ... 1
Contents ... 2
1 Executive Summary ... 3
2 Introduction ... 6
Part I: Universities in the US Innovation System and Points of UK-US Comparisons for Knowledge Exchange ... 8
3 Universities in the US Innovation System ... 9
3.1 The US Policy Framework Directly Targeting University-Industry Interactions ... 10
3.2 University R&D in an Innovations Systems Context: US and UK Compared ... 12
3.3 Longer Run Trends ... 20
3.4 The Funding, Conduct and Outcome of University R&D in the United States: Disaggregation by University ... 23
4 University-industry KE in the UK and US: Points of Comparison ... 29
4.1 Academic Publication of Research Outputs ... 29
4.2 Perceived Strength of University-Industry Collaborations ... 34
4.3 Bespoke UK-US Surveys of University-Industry KE ... 35
Part II: Developments in Metrics to Capture University Knowledge Exchange and the Contribution of Universities to the Innovation System ... 38
5 A Framework for Assessing the Value of University KE ... 39
6 KE Metrics Development in the US ... 46
6.1 Growing Pressures for Metrics Development in the US ... 46
6.2 Measuring National Level Research Activity within the HE Sector ... 47
6.3 The Regional Economic Role of Universities: Metrics Development at APLU ... 49
6.4 STAR Metrics: An Automated System for Capturing Research Activity and Impact ... 54
6.5 Building on Technology Transfer Metrics at AUTM ... 57
6.6 University-Industry Demonstration Partnership Case Studies ... 62
6.7 Evaluation and Impact Measurement at the NSF ... 64
6.8 Sub-National Economic Impact Measurement ... 65
7 Developing New Data Collection Techniques ... 73
7.1 Web-Scraping ... 74
7.2 Blending Data and Linking Datasets ... 75
8 Conclusions ... 76
References ... 79
Appendix A: APLU Metrics Long List ... 84
1
Executive Summary
The context of the report is increased interest in the UK in improving the measurement of the linkages between universities and business (referred to here as ‘knowledge exchange’(KE)), including ability to benchmark performance with other countries. This report summarises primary and
secondary sources on the US experience of measuring KE, including current analyses of US and UK KE performance (Part I), and US developments in improving measurements (Part II). Understanding of the breadth of KE as in the UK is less well developed in the USA and hence Part I focusses primarily on a narrower set of research and development (R&D) and technology transfer metrics.
In Part I, the report sets the role of universities in the context of the overall US innovation system, as the basis to understanding what influences higher education (HE) KE performance. A range of policy measures and funds at US federal and state levels supports innovation, and the Bayh Dole Act which conferred ownership of intellectual property (IP) on universities has been one of the most influential of such instruments. An important aspect of any innovation system is the performance and funding of R&D. In the USA, businesses are the largest sector for both doing and funding R&D (noting that R&D covers a spectrum from the most basic to near to market). The US in general does more R&D as a percentage of gross domestic product (GDP) than the UK. The composition of R&D in the US also differs from the UK with more high tech R&D.
The report identifies and reflects on concerns in the US about long-term trends in their innovation and R&D performance. There is a downward trend in federal, state and business funding of R&D, with only HE-funded R&D increasing (though HE R&D is a much smaller element than others). US companies also seem to be retreating from conducting more basic research in their own
laboratories. There is concern about the performance and capability of US university technology transfer. Both research expenditure and IP handling is concentrated in the most research-intensive universities in the USA, as in the UK (though the UK system is even more concentrated than the US). IP performance, such as licensing income or spin-off numbers, is very variable even in top
performing US universities, probably influenced by the nature of research subjects as well as technology transfer capability. Evidence suggests that US industry is less engaged with US universities in relation to research and research commercialisation activity than is the case in UK university-industry links. US university-business links may be more related to education and informal links. The US and the UK are very comparable on research quality measures such as citations and have similar areas of technological strengths, such as life sciences. International comparisons related to innovation systems, particularly university contributions, suggest that US performance has been weakening while the UK’s has strengthened, though such comparisons are very broad brush.
The focus of this investigation is the desire in many countries to improve and measure the impact of universities and research. However, Part II acknowledges that terminologies vary in different
important, it is by no means easy and in the UK and the US, emphasis is placed on narratives and qualitative case studies, to contextualise any quantitative measurements.
While the US has historically collected data on publications, R&D and technology transfer, it is only now considering how to improve and broaden measurements. Drivers for this are the increased policy focus on economic growth and the simultaneously increased pressure to demonstrate the value of public investments. Interest in measurements is also driven by increased expert interest in the relevant scholarly field.
The report examines the main existing sources of data and new developments relevant to KE:
The National Science Foundation (NSF) HE R&D survey running since 1972.
The NSF Business R&D and Innovation survey, which was re-designed in 2008 based on a
survey run since 1957. The survey was re-designed to capture significant changes in growth and innovation, for example, the importance of service and open innovation. The new survey captures partnerships with universities and other innovation partners, as well as exploring a range of teaching and research-related KE mechanisms.
The work of the Association of Public and Land Grant Universities (APLU) which has focussed
particularly on regional and local economic development indicators. Indicator work has focussed particularly on industry links, workforce development (noting that talent is probably the most important economic contribution of universities) and
incubation/acceleration of firms. APLU continues to seek to focus down on key indicators, taking account of the need to:
o reduce burdens;
o be sensitive to HE mission diversity;
o not duplicate data from other sources;
o reflect supply and demand side evidence;
o contextualise data; and
o collect and present data in a standard way nationally, including from federal
sources.
The Science and Technology for America's Reinvestment: Measuring the Effect of Research
The University-Industry Demonstration Partnership (UIDP), which is an organisation of universities and companies, produces good practice and case study documents including measurement information.
Federal agency evaluations such as those produced by NSF of Industry/University
Co-operative Centers.
Impact studies often conducted by individual universities and often focussed on influencing
state governments (examples are of Georgia Tech and North Carolina State Universities).
National Center for Science and Engineering Statistics (NCSES) – science and technology
indicators.
2
Introduction
Demonstrating the value of public investments into the university base has never been more important as governments seek to make difficult trade-offs between different policy areas and ensure that resource allocation within policy areas is as efficient as possible. In addition to policy-makers seeking to develop and evaluate their policies, individual institutions in receipt of public funds are also under intense pressure to demonstrate to their key stakeholders that they are using the funds both efficiently and effectively. Appropriately designed monitoring and evaluation systems with suitable indicators can be powerful tools for demonstrating the value of investments, help monitor performance and identify good practice. However, there are also a number of pitfalls that can lead to perverse outcomes. These will be discussed in this report.
Despite this urgent need to capture and understand performance and demonstrate value for money, the current set of metrics on the performance and impacts of university-based investments remains relatively limited. This is particularly acute for those associated with stimulating increased
knowledge flows between academics and users in the economy and society. The current set of indicators in the UK (the higher education-business and community interaction (HE-BCI) survey) focus heavily on a limited set of knowledge exchange (KE) mechanisms and focus on those that involve some transactional value. These indicators have been bolstered by other evidence sources and methods such as case studies combining quantitative indicators and more qualitative narratives, and the use of surveys. This report was sponsored by the Higher Education Funding Council for England (HEFCE) as a means to improve understanding of approaches to measurement in another leading edge innovation nation, the United States, with a long term view to improved benchmarking between the two countries.
This report therefore turns to international developments in this area and in particular the efforts being made in the United States to develop new metrics. A 2010 report by the US National Research Council noted existing metrics at that time in the US were narrowly focussed on technology transfer but that various national metrics programmes which provide evidence on knowledge and technology transfer – including by the National Science Foundation(NSF)/National Institutes of Health (NIH), the Association of Public and Land-grant Universities (APLU), and the Association of University
Technology Managers (AUTM) – were ‘in flux’. This report therefore sought to establish progress and key developments in measuring KE-type activities in the US.
that universities form with business and the wider innovation system. The structure of the
innovation system – the different types of organisations within it, the policies and norms and other institutions that condition the ‘rules of the game’ – will have an important effect on the nature and strength of linkages that form between the knowledge base and the productive (industry/user) base. This part of the report also reviews existing comparative US-UK evidence on KE activities. The description and analysis are primarily focussed on narrower definitions of KE and the understanding of innovation, compared to norms in UK, focussed primarily on R&D and technology transfer.
Part II (Chapters 4-7) explores in detail the efforts being made within the US to develop new metrics for capturing this type of activity. Since the US presently takes a narrower view of KE and innovation systems, considerable detail is given about underlying theories and models aimed at defining the scope and nature of metrics in this area. It starts by presenting a framework for the development of metrics (Chapter 4) before exploring the metrics being developed by key national-level
organisations, including case studies of individual universities, within the US system (Chapter 5). Central to many of the discussions was the need to develop robust data sources but with the necessity to combine the quantitative metrics with more ‘human’ stories to help bring the narrative alive. Chapter 6 then provides a brief discussion on the efforts being made in the US to develop new data collection methods which seek to advance the types of metrics that could be developed and the way data are collected. Chapter 7 presents some conclusions on the potential to improve KE
measurements, and its limitations.
3
Universities in the US Innovation System
Before considering the various developments in metrics relating to KE and the role of universities in the US, it is important to understand a bit more about how universities fit within the US innovation system. They are frequently regarded as being central elements of the system:
“Research universities are the engines of the US innovation system. Of these, the nearly 200 public research universities conduct more than 60% of federally funded research. These institutions educate 85% of undergraduates and 70% of graduate students in US science and technology fields. … The role of research universities in starting new high-tech companies and commercialising technology has increased dramatically. Universities also host a range of public private research centres and consortia that bring together federal agencies, corporations, and national laboratories. The NSF sponsors a network of 55 University-Industry Cooperation Research Centers and a number of Engineering Research Centers at universities around the nation.” (Wessner and Wolff, 2012, pp.44-45).
Research universities are part of a research and education system which also includes a number of types of research-focussed organisations. These include 37 federally funded research and
development (R&D) centres, of which 16 are national laboratories sponsored by government departments. A variety of other research centres are sponsored/funded by the military and by various departments of government, including Homeland Security, the Department of Health and Human Services, the Internal Revenue Service and the NSF.
The national laboratories typically have a strong emphasis on key strategic national needs in relation to energy, space and defence and have strong industrial partnership histories. The Jet Propulsion Laboratory of NASA and the Department of Energy’s largest national laboratories at Los Alamos, Lawrence Livermore, Sandia and Oak Ridge between them account for $20 billion of US funding for federally funded R&D centres which amounts to 55% of the total funding (Wessner and Wolff, p.45). The role of the federal government also encompasses a wide range of mission-specific or
technology-specific programmes involving public private partnerships. The most well-known of these related to the funding of US technology start-ups include the Defence Advanced Research Project Agency (DARPA) and the Small Business Innovation Research Program (SBIR).
The role of universities in the research and education system, and the role of these within the wider US innovation system are represented diagrammatically in Figure 3.1. The figure reveals the
decentralised nature of the innovation system as a whole, with multiple routes of interconnections and intermediating agencies linking the administrative and political system with the industrial innovation sub-system and the research and education sub-system. It has been argued that the multiple pathways through which innovation policy funding may flow and strategic initiatives may be pursued, alongside a budgeting system which results in frequent review and potential revision, leads to a system which is able to respond relatively quickly to external perceived threats (see e.g.
Figure 3.1 The US Innovation System - Structure and Governance Patterns
Source: Adapted from Shapira and Youtie (2009)
On the other hand it has been argued that this may lead to a lack of continuity and a lack of overall strategic direction, since the innovation system in a large and complex economy like the United States may be less amenable to changes in strategic direction than in the case of smaller or
historically more centralised or co-ordinated innovation systems (Wessner and Wolff, 2012; Rammer et al., 2007).
inventions funded by the federal government so as to license inventions. Subsequent to this universities set up technology transfer offices to implement these precepts, seek greater commercialisation of their research and access new sources of income for their institutions. The Cooperative Research Act eliminates damages from anti-trust violations so that firms, universities and federal laboratories can engage in joint competitive R&D, and the 1992 Small Business Technology Transfer Act established the Small Business Technology Transfer (STTR) programme to fund cooperative research involving small businesses, universities and federal laboratories. Nine federal agencies maintain a geographic network of federally funded R&D centres (FFRDC) and laboratories such as those of the US Department of Energy.
The NSF has several national programmes directly targeting the university-industry interface, including the Engineering Research Centers (ERC), and the Industry-University Cooperative Research Centers (IURC). The latter began in the 1970s and were fully authorised in the 1980s. They aim to foster research involving industry, universities and government as well as support the development of research infrastructure, research and educational opportunities for students. The ERC programme begun in 1985 encourages university-industry consortia focussed on high risk research areas. The NSF has, as part of its educational programme, funded six university–based Science Learning Centers to conduct research and provide education. Education-based policies are further supported by non-profit organisations such as the Kauffman Foundation with its Campuses Initiative to selected universities for entrepreneurship.
There are also a number of technology bridging organisations which organise forums, workshops and conferences in which a variety of players in the innovation system, including universities, the private sector and policy makers, come together to discuss issues, review performance and engage in knowledge transfer and policy direction. The State Science and Technology Institute (SSTI) is an important institution fulfilling this KE role.
Although federal policies are rarely targeted at specific regions/states, there is a wide variety of policies at the state level and these policies may play a significant role in the local and regional innovation systems. Arguably it is at the state level that universities play a more important role than at the national level (Shapira and Youtie, 2009). This is reflected in the efforts currently underway to develop metrics that capture and demonstrate the contributions of universities to the economy. In many states, universities (particularly the more research intensive universities) have introduced incubators for start-up companies and academic spin-outs, seed capital funds and technology transfer offices. A good example of state-led policy is the Ohio Technology-Based Economic Development (OTBED) programme launched in 2002 which evolved out of earlier technology programmes such as the Thomas Edison programme in 1984, aimed at encouraging
commercialisation, and the Ohio 3rd Frontier Program. A key feature of the programme has been to support university research in areas that are aligned with Ohio’s industrial and technological
strengths. The OTBED programme includes a wide variety of initiatives in which universities may become engaged, including research and commercialisation collaboration (Research Scholars Program, Wright Centers of Innovation Program and Grants for Capital Equipment) and
industry and a general strengthening of the linkages and knowledge flows in the regional innovation system.
3.2
University R&D in an Innovations Systems Context: US and UK Compared
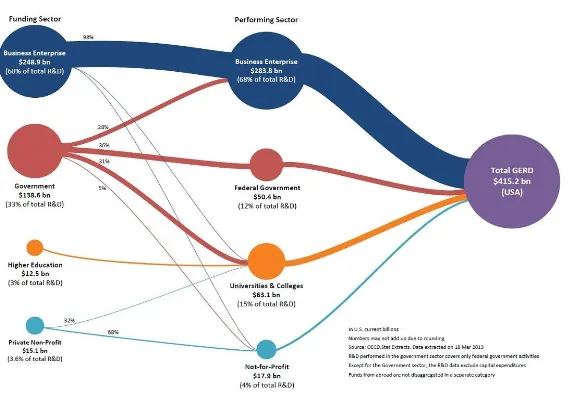
It is helpful to consider the role of universities and university research in the US innovation system in terms of who funds R&D activity and who carries out R&D activity. A Sankey diagram illustrating the main features of the US Innovation system in terms of R&D is shown in Figure 3.2. In this figure the thickness of the lines and the size of the circles are proportionate to the sums of money involved. The greatest amount of R&D in the US system is both funded and carried out by the business enterprise sector. Thus the analysis shows that business enterprise carried out $283.3 billion of R&D in 2011 which was 68% of total US R&D. The sector also funded $248.9 billion worth of R&D, the bulk of which it carried out itself.
The thinner lines emerging from the funding circle of the business enterprise sector show that it also funded on a minor scale R&D which was carried out in the university and college system and in the not-for-profit sector.
R&D carried out in universities and colleges accounted for 15% of the total R&D performed in the US in 2011. It was predominantly funded by federal government support with a smaller amount funded by internal sources.
The federal government plays a major role in terms of both the funding and conduct of R&D. It accounted for 33% of all funding and 12% of all R&D carried out. Of total federal funding 28% went to support business enterprise R&D, 36% to fund the federal government’s own R&D expenditure, 31% to fund university and college R&D with 5% supporting the not-for-profit sector.
It is important to note that R&D as a whole includes research which stretches from the most basic scientific research to direct applications and product development. The R&D carried out by the university sector is more focussed at the basic end while the business enterprise sector’s R&D is much more focussed on the product development and applied end of the spectrum. The
In characterising the US innovation system, it is useful to consider its characteristics in relation to the UK. This is done in the following 10 figures. The linkages between universities and business are significantly affected by the composition, nature and focus of all forms of R&D (noting that
innovation systems are much wider than R&D, but that R&D data are most readily available to make international comparisons of the sorts below).
Figure 3.3 shows R&D expenditure as a percentage of GDP in 2011. The US spends substantially more relative to GDP than the UK. This is true in terms of overall gross expenditure on R&D (GERD) expenditure on R&D, as well as on business expenditure on R&D (BERD) and on government
[image:15.595.79.525.272.493.2]expenditure on R&D (GovERD). It is noticeable, however, that higher education expenditure on R&D (HERD) is much closer as a percentage of GDP in the two countries and that the UK has a higher share than the United States.
Figure 3.3 R&D Expenditure as a Percentage of GDP, 2011
Source: OECD. StatExtracts – MSTI (data extracted on 22 March 2013)
Figure 3.4 HERD by Type of R&D (Latest Available Year)
Source: Hughes and Mina (2012)
It is important to note that R&D is one of a number of intangible assets that contribute to innovation and that expenditure on tangibles (such as fixed investment in buildings, plant and equipment) are also important. Figure 3.5 looks therefore at expenditure on tangible assets (machinery and
Figure 3.5 Investments in Tangible and Intangible Assets as a Share of GDP, 2006
Source: Measuring Innovation: A New Perspective – OECD, May 2010
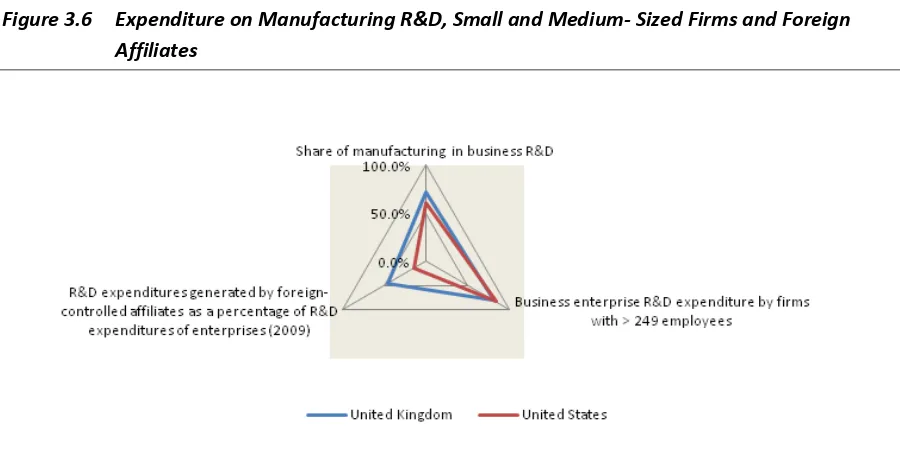
[image:17.595.71.521.436.674.2]Figure 3.6 shows that the US share of business R&D accounted for by manufacturing is around 60% which is significantly lower than the UK. The percentage of R&D expenditure which is generated by foreign controlled affiliates is also much lower in the United States. The United Kingdom is an international outlier in terms of this particular variable, and overseas controlled affiliates are overwhelmingly more important in UK R&D than is the case of the US, which is a relatively more domestically focussed economy in terms of the conduct of business R&D.
The figure also shows that both economies have their business expenditure on R&D overwhelmingly controlled by firms employing over 250 employees and in fact in both economies a handful of firms account for the majority of R&D. Interestingly Figure 3.7 shows that in the UK it is medium-sized firms which are proportionately more important than in the United States. In the US a relatively high proportion of business enterprise R&D expenditure in the innovation system is accounted for by the smallest firms (those employing fewer than 50 people).
Figure 3.7 Business Expenditure on R&D: Small and Medium-Sized Firms
Source: OECD iLibrary: Science, Technology and R&D Statistics (data extracted on 22 March 2013)
Figure 3.8 Federal Funding of R&D, Support for R&D, and Business Funded in R&D in the HE and Government Sectors
Direct government funding of business R&D and tax incentives for R&D (UK 2009, US 2008). Percentages scaled up 100-fold. Government-financed BERD to firms (UK 2008, US 2007).
Sources: OECD. StatExtracts – MSTI (data extracted on 22 March 2013); OECD Science, Technology and Industry Scoreboard 2011
The first point to note is the greater importance of the role of the US government in funding business expenditure on R&D. In 2011 US federal funding of business expenditure on R&D was running at around 14% compared to between 8-9% in the UK. The USA also has a significantly higher proportion of its support for R&D in the form of direct government funding. This is a reflection of the wide range of agencies and programmes which sponsor and fund business R&D and which we outlined earlier. Indirect support through R&D tax incentives is relatively low compared to the UK and substantially less than direct funding. This is the exact opposite of the case in the UK.
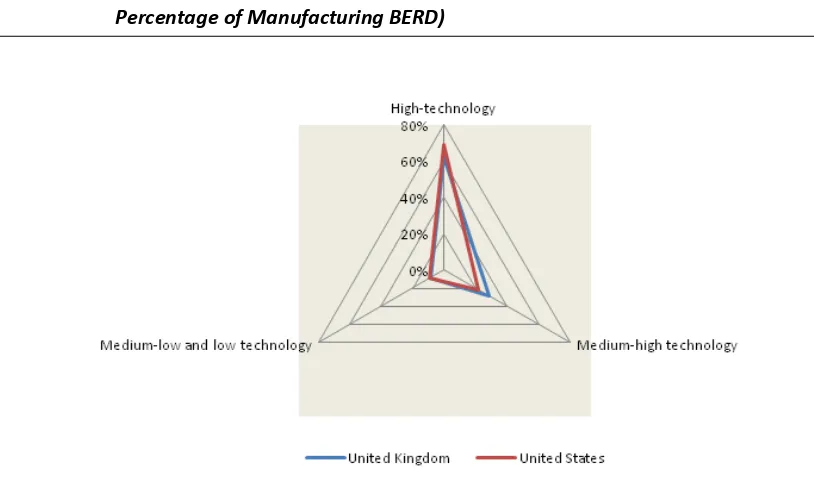
Figure 3.9 Business R&D in the Manufacturing Sector by Technological Intensity, 2008 (as a Percentage of Manufacturing BERD)
Source: OECD Science, Technology and Industry Scoreboard 2011
Figure 3.10 R&D Intensity of Manufacturing Sectors, 2006
Medium-high technology manufacturers High technology manufacturers R&D intensity of manufacturing sectors
(using value added)
United Kingdom United States
Source: OECD. StatExtracts - STAN (data extracted on 22 March 2013)
Finally, Figure 3.10 looks at the extent to which business R&D is high or low relative to value added in each of the three technologically intensive categories (as university technology transfer is more likely to play a role in the more technologically intense sectors). This figure shows that the United States has a relatively high R&D intensive effort in each of the sectors. Thus in manufacturing as a whole the ratio of R&D to value added is 10% in the US compared to around 7% in the UK. In high technology manufacturers the R&D intensity is nearer 35% in the US; in this case and in the medium-high technology manufacturing sectors the US substantially outstrips the United Kingdom.
3.3
Longer Run Trends
Figure 3.11 Funding Sources for US Academic R&D: 1990-2009
Source: NSF 2012: Expenditures and Funding of Academic R&D, Chapter 5
Figure 3.12 Performers of US Basic Research: 1990-2009
Notes: 2009 data are preliminary. Federal government is intramural only.
Source: NSF 2012: Performance of R&D and R&D by Character of Work, Chapter 4
Part of the problem is seen to arise from a crisis of funding. Thus, although federal support for university R&D is high, in real terms state support has dropped substantially at the same time as the tuition costs to students and their families have increased. Decline in state funding has for example been associated with a significant cut in the University of California’s budget of 20% in 2009 and of similar proportions in 2011. Similar declines are reported in Arizona and Georgia.
“In all, 32 US states cut their support of higher education in 2010 by 0.3% and 13.5%, with double digit declines in Missouri, Delaware, Iowa, Minnesota, Arizona and Oregon.” (Wessner and Wolff, 2012, p.104).
At the same time industrial support for R&D in the university sector has also been weakening with significant declines beginning in the early part of this century.
“Leading university and industry leaders have pointed out that US companies increasingly choose to work with foreign rather than US universities, encouraged by the more favourable IP rights that foreign universities offer and the strong incentives for joint industry-university research that foreign governments provide.” (Wessner and Wolff, 2012, p.105).
The number of spin-outs appears to have remained buoyant through to the first half-decade of this century. However, patent applications and new technology licenses have been flat-lining. Moreover, there has been increasing concern about the variable and often lacklustre performance of
technology transfer programmes. Research suggests that over half of the 139 programmes analysed in a recent study failed to cover their costs with around 16% reporting that they were financially self-sustaining. This has led to a substantial debate about the purposes of technology transfer in terms of the relative significance to be attached to the public good as opposed to the generation of IP and associated revenues. (See for example National Research Council, 2012b; the discussion in Wessner and Wolff, 2012, pp110-111; and National Academy of Sciences/National Academy of
Engineering/Institute of Medicine, 2010a and 2010b and the references therein.)
Concern about rebalancing the US economy in the aftermath of the financial crisis has heightened interest in the role that US universities may play in resurrecting manufacturing. At the same time pressure on funding at federal and state level after the financial crash has led to an increasing emphasis on the ways in which the returns from federal support for university R&D may be
measured and the process of KE enhanced (Olson and Merrill, 2011). The UK has had similar trends though over a longer period and from a generally lower base (Hughes and Mina, 2012).
3.4
The Funding, Conduct and Outcome of University R&D in the United States:
Disaggregation by University
So far we have focussed on R&D funding and expenditure at a relatively high level of aggregation. It is important to look at a more disaggregated level at the distribution of the funding of and
Figure 3.14 shows that the top 10% of spenders account for a disproportionate share of expenditure and of funding. These universities account for 38.6% of all university R&D and the University of California System alone accounts for 9.7%. There is broad similarity in terms of the total R&D spend and percentage of the overall expenditure which is funded by the federal government. Thus the top 10% of universities, as well as accounting for 38.6% of total R&D, also accounted for 37.9% of federally funded R&D. Their share of industrially funded R&D was, however, higher at 45.3%. Their share of miscellaneous categories was much less, but this source of funding is also a very small part of the total funding for university R&D. Thus even though the United States has a highly
Figure 3.14 Higher Education R&D Expenditure by the Top 10% of US Universities and their Share of Funding Sources
University
Total R&D Spend ($Millions)
% Total R&D % of Federally Funded R&D
Federally Funded R&D
Rank
% of Industrially Funded R&D
Industrially Funded R&D
Rank
% of Other Funded R&D
Other Funded R&D Rank
University of California System 5172 9.7% 7.6% 1 8.9% 1 1.5% 1
University of Texas System 2346 4.4% 3.7% 2 5.7% 3 0.6% 2
Johns Hopkins University 1463 2.7% 3.2% 4 3.1% 8 1.5% 15
Massachusetts Institute of Technology (MIT) 1401 2.6% 3.3% 3 2.5% 11 0.8% 35
University of Michigan 1139 2.1% 2.1% 6 1.5% 16 2.4% 5
Johns Hopkins University Applied Physics Laboratory 1071 2.0% 3.0% 5 2.7% 72 0.0% 136
University of Wisconsin-Madison/WARF 1029 1.9% 1.5% 17 3.1% 63 0.3% 3
Confidentials 937 1.8% 1.9% 8 1.6% 94 1.7% 11
The Research Foundation of SUNY 891 1.7% 1.6% 15 2.2% 13 1.8% 10
University System of Maryland 888 1.7% 1.8% 11 3.8% 6 0.8% 39
University of Washington/Washington Research Foundation 887 1.7% 1.9% 9 0.6% 36 1.3% 19
University of Illinois at Urbana-Champaign 878 1.6% 1.5% 19 0.5% 46 2.3% 6
University of Colorado 847 1.6% 1.8% 10 0.5% 4 0.0% 136
Duke University 827 1.6% 1.3% 22 7.1% 2 0.6% 50
Stanford University 806 1.5% 1.7% 12 1.5% 15 0.9% 32
Total Top 10% Universities Ranked by R&D 20582 38.6% 37.9% 45.3% 16.5%
Total All Universities 53268 100.0% 100.0% 151 100.0% 151 100.0% 151
It is to be noted, however, that this degree of concentration is much less than in the United Kingdom where the top 10% of universities in terms of research expenditure account for more than twice as much as their counterparts in the United States (see for example Hughes and Martin, 2012).
Figure 3.15 uses the same ranking, but shows the extent to which ranking in terms of total R&D expenditure corresponds to ranking in terms of patent applications, patents issued and start-up activity. The data are less complete for the cumulative number of start-ups than for other elements in the table, but the overall impression is quite clear. Just as the concentration of research
expenditure shows that the top 10% of universities accounted for 38.6%, so we find that the percentage of applications filed by these universities the number of patents issued and the number of start-ups initiated all fall within the range of 33%-36.3%. The rankings in terms of these other variables suggest, however, that a number of the top ranked universities in terms of research expenditure do not rank in the top 10% in terms of the other indicators in this figure. Thus, for example, Johns Hopkins University Applied Physics Lab is ranked sixth in terms of research
expenditure, but 58th in terms of patent applications filed, 76th in terms of patent applications issued and 73rd in terms of start-ups initiated. These relative rankings may be accounted for both by
variations in the balance between basic, applied and developmental research encompassed in their research budgets, as well as by relative concern with and efficiency of their commercialisation activities.
Figure 3.15 Licensing Activity of the Top 10% of US Universities in terms of R&D Expenditure University Total Research Expenditure (in US million)
% of Total Research Expenditure Rank Number of Cumulative Active Licences % of Cumulative Active Licences Rank Gross Licence Income (in US million) % of Gross Licence Income Rank Number of Licences Generating More than $1 Million in Income % of Licences Generating More than $1 million in Income Rank
University of California System 5,172 9.7% 1 2,096 6.3% 1 104 7.0% 3 15 9.6% 1
University of Texas System 2,346 4.4% 2 1,160 3.5% 5 38 2.6% 13 7 4.5% 3
Johns Hopkins University 1,463 2.7% 3 568 1.7% 13 12 0.8% 25 1 0.6% 37
Massachusetts Institute of Technology (MIT) 1,401 2.6% 4 919 2.8% 6 69 4.6% 5 14 9.0% 2
University of Michigan 1,139 2.1% 5 396 1.2% 26 40 2.7% 12 6 3.8% 5
Johns Hopkins University Applied Physics Laboratory 1,071 2.0% 6 123 0.4% 68 1 0.1% 77 - 0.0% 58
University of Wisconsin-Madison/WARF 1,029 1.9% 7 529 1.6% 19 54 3.6% 8 3 1.9% 12
Confidentials 937 1.8% 8 766 2.3% 8 17 1.1% 19 4 2.6% 9
The Research Foundation of SUNY 891 1.7% 9 554 1.7% 14 13 0.9% 24 2 1.3% 20
University System of Maryland 888 1.7% 10 372 1.1% 30 2 0.1% 64 - 0.0% 58
University of Washington/Washington Research
Foundation 887 1.7% 11 1,309 3.9% 4 69 4.6% 6 6 3.8% 5
University of Illinois at Urbana-Champaign 878 1.6% 12 290 0.9% 35 13 0.9% 23 2 1.3% 20
University of Colorado 847 1.6% 13 158 0.5% 55 2 0.2% 58 - 0.0% 58
Duke University 827 1.6% 14 738 2.2% 9 26 1.7% 17 3 1.9% 12
Stanford University 806 1.5% 15 1,944 5.8% 2 65 4.4% 7 2 1.3% 20
Subtotal (top 10% universities) 20,582 38.6% 11,922 35.8% 528 35.3% 65 41.7%
Total (all universities) 53,268 100.0% 33,309 100.0% 1,494 100.0% 156 100.0%
Figure 3.16 Patenting and Start-up Activity of the Top 10% of US Universities in terms of R&D Expenditure University Total Research Expenditure (in US million)
% of Total Research Expenditure Rank Number of Patent Applications Filed
% of Patent Applications Filed Rank Number of US Patents Issued
% of US Patents Issued Rank Number of Start-Ups Initiated % of Start-Ups Initiated Rank Cumulative Number of Operational Start-Ups as of Last Day of this Year
% of Cumulative Operational Start-Ups as of Last Day of
this Year
Rank
University of California System 5,172 9.7% 1 1,183 7.0% 1 297 7.4% 1 75 12.2% 1 NA NA NA
University of Texas System 2,346 4.4% 2 704 4.2% 2 150 3.7% 4 33 5.4% 2 84 3% 4
Johns Hopkins University 1,463 2.7% 3 529 3.1% 4 53 1.3% 21 11 1.8% 8 83 2% 5
Massachusetts Institute of
Technology (MIT) 1,401 2.6% 4 569 3.4% 3 172 4.3% 3 17 2.8% 4 NA NA NA
University of Michigan 1,139 2.1% 5 307 1.8% 13 82 2.0% 9 10 1.6% 10 93 3% 3
Johns Hopkins University Applied
Physics Laboratory 1,071 2.0% 6 86 0.5% 58 14 0.3% 76 2 0.3% 73 14 0% 80
University of
Wisconsin-Madison/WARF 1,029 1.9% 7 216 1.3% 23 133 3.3% 6 5 0.8% 37 65 2% 11
Confidentials 937 1.8% 8 292 1.7% 14 50 1.2% 24 7 1.1% 22 25 1% 45
The Research Foundation of
Figure 3.16 once again begins with the rankings in terms of research expenditure, but now looks at the licenses and licensing income and also the numbers of licenses generating more than $1m. Once again, the top 10% of research spenders account for between 35% and 41% of the various
dimensions of licensing activity, which is roughly on a par with their share of research expenditure. Perhaps the most striking feature of the figure is the fact that for the university system as a whole there are only 156 licenses generating more than $1m of which 65 were accounted for by the top 10% of R&D spending universities and that the latter accounted for just under 41% of all such licenses income. Once again it appears that there are substantial variations within the top 10% of R&D spenders of the commercialisation of their research as reflected in licensing activity. The UK university system demonstrates similar trends of variation in research commercialisation activity between universities, reflected in annual HE Business and Community Interaction (HE-BCI) surveys and qualifying income for HEFCE KE/HE Innovation Funding (HEIF) published in KE/HEIF allocation reports (HEFCE, 2011).
4
University-industry KE in the UK and US: Points of Comparison
There are a number of sources which provide potentially comparable, national statistics on a limited number of metrics associated with the exchange of knowledge from the knowledge base and the productive base.
4.1
Academic Publication of Research Outputs
Probably the most traditional method of knowledge dissemination from the academic base is through the publication of scholarly research outputs in peer-reviewed journals, conference proceedings, books and other academic-focussed media (noting that publications remain the predominant channel for sourcing university contributions to innovation, as reflected in UK Community Innovation Surveys). Key findings from a recent study by Elsevier (2011) include:
The UK is more productive in terms of articles and citations per unit R&D spend or unit researcher than comparator nations including the US. UK researchers generate more articles per researcher, more citations per researcher, and more usage per article authored as measured by global downloads of UK articles, than the other top research nations (US, China, UK, Japan, and Germany) (see Figure 4.1).
While the UK’s world share of publications is growing more slowly than the world average,
the citations of UK articles increased faster than the world average. The UK’s share of the world’s top 1% of most highly cited articles was second only to the US in 2010 (Figure 4.2).
The UK’s field-weighted citation impact (measure of quality of publication), adjusting for structural differences between countries, was second only to the US, and was narrowing the gap: the citation impact of UK researcher publications has increased over time, while that of the US is decreasing (Figure 4.3).
A map of UK research strengths for 2010 shows over 400 areas in which the UK is very strong
for both nations, they show significant strengths in multi-disciplinary areas compared with other nations.
The study found a high degree of international collaboration, measured by co-authorship
across borders. One of the most frequent collaboration partners for UK researchers over the period 2006-2010 was the USA, emphasising the close ties between the two nations.
While UK researchers have a low and declining share of patents compared to other
research-intensive countries, there is a high usage by R&D research-intensive corporations of articles authored by academics.
Figure 4.1 Citations (University Sector) Per Unit Spend on HERD for UK and Comparators Over Different Four Year Blocks
Figure 4.2 Citations Per Article (Panel a), and Share of World Highly Cited Articles (Panel B) for UK and Comparators, Over Different Four Year Blocks
(a) All articles (b) Highly cited articles (top 1%)
Source: Elsevier (2011)
Figure 4.3 Changes in Field-Weighted Citation Impact and Article Share for UK and Comparator Countries (2006-2010)
[image:32.595.72.524.382.666.2]Figure 4.4 International Collaboration Map for the UK Over the Period 2006-2010, Excluding Europe
Source: Elsevier (2011)
4.1.1 Knowledge diffusion through co-publications
An important method for knowledge diffusion in the system remains the publication of academic papers derived from the research activities of higher education institutions (HEIs). The direct exchange of knowledge is strengthened when publications are co-authored by academics and their partners in industry. Hughes and Kitson (2012) showed that 46% of academics had produced joint publications with an external partner during the period 2005-08.
Figure 4.5 Relative Citation Impact of Biomedical Papers Across Seven Countries
Source: Marston, L. (2011) All Together Now: Improving Cross-Sector Collaboration in the UK Biomedical Industry
4.1.2 Industrially sponsored research grants and contracts
Table 4.1: Definitions of Industrially Funded Research used in the UK and the US at the Institutional Level
Agency/survey Variable name Definition
UK
HESA FSR1
Research grants and contracts: UK industry, commerce & public corporations
Should include all research grants and contracts income from industrial and commercial companies and public corporations (defined as publicly owned trading bodies, usually statutory corporations, with a substantial degree of financial independence) operating in the UK.
HE-BCI2
Collaborative research
Income should be returned for research projects which have public sponsorship (grant-in-aid from a government or public body) to support research performed in collaboration with at least one other non-academic organisation (collaborator). ... 'Collaborative research' must involve: grant-in-aid from at least one public body, and a material contribution (which may be cash or 'in-kind' if specified in the collaborative agreement and auditable) from at least one external non-academic collaborator.
Contract research
Income returned ... must be identifiable as the institution meeting the specific research needs of external partners. ... Awards and grants made for proposals from the institution should not be returned. In particular, basic research council grants should not be returned as contract research.
US NSF HERD3 R&D expenditure from business
How much of your total expenditures for research and development (R&D) came from the following sources in FY 2012?
- Business: Domestic or foreign for-profit organizations. Source: HESA, NSF
Arguably the most comparable data source on the value of R&D funded by industry in the HE sector is provided by the OECD through their statistics on GERD, and presented in Section 2 of this report (in particular Figure 3.8). This shows that a much greater proportion of research undertaken in the HE and government sectors in the UK is funded by business compared with that in the US.
However, a downside of this data is that it is only obtainable at the aggregate level prohibiting more granular comparisons between, for example, matched samples of different types of HEIs.
4.2
Perceived Strength of University-Industry Collaborations
Another source of comparable, national evidence is the World Economic Forum (WEF) Global Competitiveness Report. WEF collect a wide range of data that inform the competitiveness of nations and present country profiles. They break the index down into 12 ‘pillars’ of competitiveness, the 12th of which is ‘innovation’. This pillar presents information on
PCT patents, applications/million population
With the exception of patents per million population, the evidence that underpins the rankings for each of these components is drawn from the WEF annual ‘Executive Opinion Survey’. This survey seeks the views of business executives covering 144 countries around the world to bolster the quantitative evidence with qualitative assessments of factors that are hard to quantify but are deemed important for national competitiveness. The latest survey received 14,059 responses, translating to approximately 100 per country. In 2011, the number of responses for the UK was 102 while the US generated 397. As such the samples at the national level are relatively small which may affect the robustness of the findings.
Table 4.2: Ranking the US and the UK on the Sub-Components of the Innovation Pillar
WEF 12th Pillar: Innovation*
Global Rank: UK Global Rank: US 2008 -09 2009 -10 2010 --11 2011 -12 2012 -13 2008 -09 2009 -10 2010 --11 2011 -12 2012 -13 Capacity for innovation 14 16 15 13 12 6 6 6 7 7 Quality of scientific research institutions 7 4 3 3 3 1 2 4 7 6 Company spending on R&D 12 14 14 12 12 3 5 6 6 7 University-industry collaboration in R&D** 9 7 4 2 2 1 1 1 3 3 Gov't procurement of advanced tech
products 32 43 53 49 45 4 4 5 9 15
Availability of scientists and engineers 32 32 29 14 12 6 5 4 4 5 PCT patents, applications/million pop. 18 20 20 20 18 2 3 3 3 12
Innovation pillar 17 15 14 13 10 1 1 1 5 6
PCT: Patent Co-operation Treaty
*Rankings based on the WEF annual Executive Opinion Survey with the exception of PCT patents where the ranking is based on data from the OECD Patent Database.
** Based on the responses from the World Economic Forum’s annual Executive Opinion Survey to the question: To what extent do business and universities collaborate on research and development (R&D) in your country? [1 = do not collaborate at all; 7 = collaborate extensively]
Source: World Economic Forum (2008, 2009, 2010, 2011, 2012)
Table 4.2 shows that the global rank of the UK for innovation has been improving, from 17th in the world in 2008-09 to 10th in 2012-13. The US, however, has seen its ranking for innovation fall from first to sixth over this period. A key source of improvement for the UK – based on the findings of the survey – has been the collaboration between universities and industry for R&D, which has seen the UK rise from ninth in the world to second, while the US has fallen from first to third; and the availability of scientists and engineers, where the UK has risen from 32nd in the world to 12th. In addition, the UK has risen from seventh in the world for the ‘quality of scientific research institutions’ to third, while the US has fallen from first to sixth between 2008-09 and 2012-13.
The overall picture painted from the WEF executive opinion survey is that the quality of the
Institute and carried out in 2004. It sought the responses of firms in the two countries on their innovation activities and performance, including how they link with universities. This allowed for the first time direct comparisons between the two nations in this important area. The findings are discussed in detail in Cosh, Hughes and Lester (2006) and Hughes (2007). Key results include:
In 2004 there was a more frequent but less intensive and less highly valued set of
interactions between the business sector and the university sector in the UK compared with the US.
The pattern of university-industry interactions suggests that there is a greater emphasis on the role that universities play in providing public space functions in the innovation system and in providing education in the US compared with the UK.
Areas where UK firms viewed university-industry interactions more frequently as highly
important than their US counterparts included the recruitment of staff at post-doctoral level, use of licensing, and joint R&D projects. In contrast, US companies were more likely to view internships, graduate recruitment, and informal contacts as highly important compared to their UK counterparts.
Interactions involving innovation-related expenditure with universities were more prevalent
in the US compared with the UK suggesting a greater depth and intensity of interaction in the former.
The smallest companies in the US are much more likely to cite universities as a highly
important source of knowledge, both compared to large firms in their own nation, and to UK-based firms. The gap in the rating of universities as highly important sources of knowledge narrows considerably as the size of firm increases.
In addition, a critical finding from a subsequent analysis of this survey data by Hughes (2007) found that UK firms are much more likely than their US counterparts to use a multiplicity of different types of knowledge in their innovation activities, covering sources from the company sector (e.g. internal knowledge, suppliers, customers); intermediary and regulatory sector; and the scientific knowledge base (including universities, private research institutions, commercial R&D labs etc.).
Conclusions
Although present US-UK comparisons of KE are limited, this section has provided some key points of comparison to illustrate the similarities and differences of the two systems:
The US Government gives far more support to business R&D than happens in UK.
US business spends less on R&D in HE than UK business does in UK HE.
The US is now concerned about the weakening of its innovation system, including decreases
in business spend on R&D and less business focus on basic research than previously. Also the US is concerned about the poor performance of its university technology transfer system. Some of these trends are similar to those of the UK, though the UK has always had a lower business R&D base and declines of business R&D happened earlier. The UK has always adopted a broader KE approach over a narrow technology transfer approach to university-business linkages compared to the US.
US HERD and technology transfer outputs are very concentrated on the top 10 universities in
the US HE system. UK HE is even more concentrated (twice the US system). Outputs even of the top university performers (by patents, licences and levels of BERD) are very diverse.
The US and the UK are very similar on traditional metrics of publications and bibliometrics, with the US slightly ahead. There are strong research linkages between the two nations.
On international league tables of innovation, the UK is tending recently to rise, and the US to fall, particularly on university related dimensions.
US university-business interactions tend to be fewer and deeper than the UK. US forms are
more focussed on ‘public space’ functions of universities and technology transfer and teaching based linkages. UK businesses use a wider range of innovation sources, and their linkages are wider but shallower than those in US. The UK focus is more on research
Part II: Developments in Metrics to Capture University
Knowledge Exchange and the Contribution of Universities
to the Innovation System
5
A Framework for Assessing the Value of University KE
A main focus of the examination of literature and discussions in the United States on KE was to assess opportunities to move beyond the existing points of comparisons given in Part I and to try to identify the nature and direction metrics development – primarily at the national level – to explore the potential for more meaningful and extensive KE comparisons in the future. Given current differences in organising frameworks for exploring KE and the large structural differences in innovation systems, considerable work was needed to explain to US audiences what was meant by KE from the UK perspective. This section therefore focusses on defining what is meant by KE (given that terminology varies in different countries), which then informed interviews and other evidence compilation.
The assessment of the value of KE between universities and external partners needs to be framed within a conceptual framework that allows us to locate the activity within a wider system that is involved in translating university-based knowledge into economic and social value. Adopting an innovation system perspective, Hughes and Martin (2012) argue that the impacts arising from public investment in research will depend substantially on the capabilities and complementary investments by other actors in the innovation system to access and exploit the knowledge generated within the public research base. They argue that, as one of the main functions of universities in the system is to be inventive – to achieve new understanding of natural phenomena and technologies – that of the firm in knowledge economies is to turn knowledge into economically viable innovations. Therefore “the central policy concern is not the relative impact of one expenditure form to another. Instead, it is a classic systems problem, namely how best to manage the boundaries between these two relatively specialised organisational forms so as not to damage the role played by the other” (ibid, p.13). KE funding is therefore targeted at addressing this key systemic failure to strengthen the pathways through which knowledge can be accessed, exchanged and exploited to create economic value. The multiplicity of pathways that exist is now well researched (see, for example, PACEC/CBR, 2009; Hughes and Kitson, 2012; Ulrichsen et al., 2010.
Figure 5.1: Framework Positioning KE Activities Within the Wider Set of Knowledge Diffusion Mechanisms Knowledge Exchange University Economy & society Academic publications, Graduating students Example knowledge diffusion mechanisms: Underlying activities of
HEIs Potential users Educating people Pure-basic research User-inspired research Applied research Private sector • Spin-outs • SMEs
• Large Cos. (domestic)
• MNCs
Public sector
• Central Govt
• Local Govt
• Overseas Third sector Wider society Range of impacts Economic (incl. Innovation, productivity, competitiveness etc.) Health and wellbeing Society and culture Public policy and
services
Environmental Industrial conferences
University-industry centres
Workforce education / courses Collaborative / contract R&D
Consultancy Technology transfer –
licensing/spin outs
People exchange Networks and forums
Informal advice Prototyping and testing
Source: Adapted from Ulrichsen et al.,2010
As Hughes and Martin (2012) point out, assessing impact “involves both the presence and
effectiveness of the mechanisms or pathways by which knowledge is exchanged and connections made, but also the extent to which the nature of the pathways or connections between the public and private sector domains influences the direction and nature of the research in the former” (p.13). Coupled with the fact that the ability of the public investment in universities to generate impact requires sufficient capabilities and complementary investments by other actors in the system, Hughes and Martin (2012) conclude that assessing impact becomes very challenging.
5.1.1 Empirical issues
in-Figure 5.2 also highlights the need to explore whether the outcomes and impacts realised would have happened in the absence of the intervention: what is termed the ‘counterfactual’. Assessing this can be done in a variety of ways, but often requires a number of strong assumptions to be made (Hughes and Martin, 2012). In addition to the counterfactual, one also needs to consider the extent to which public intervention leads to activity which substitutes or displaces private sector activity. Hughes and Martin (2012) outline literature that shows that public investments in research are often complementary to private investments, rather than substituting for them. In addition, Hughes et al. (2011) suggest that those KE activities that involve undertaking original research (for example, on a contract or collaborative basis) or those involved in directly translating original research into a format that can be exploited by an external organisation (including training based on original
[image:42.595.76.527.269.612.2]research), are much less likely to be displacing than those involved in presenting existing research or educational material.
Figure 5.2: Stylised Policy Evaluation Logic Model
RESOURCES /
INPUTS ACTIVITIES OUTPUTS GROSS IMPACTS
Certain resources are needed to operate your programme
If you have access to them, then you can use them to accomplish your planned activities
If you accomplish your planned activities, then you will hopefully deliver the amount of product or service that you intended
If these benefits to participants are achieved, then certain changes in organisations, communities, or systems might be expected to occur
WHAT WOULD HAVE HAPPENED ANYWAY – DISPLACEMENT OF OUTPUTS – NET ADDITIONAL IMPACT = GROSS ADDITIONAL IMPACTS = SUBSTITUTION OF INPUTS –
WHAT WOULD HAVE HAPPENED ANYWAY – GROSS BEHAVIOURAL ADDITIONALITY = BEHAVIOURAL CHANGE INTERMEDIATE OUTCOMES
If you accomplish your planned activities to the extent you intended, then your participants will benefit in certain ways
Source: Adapted from Hughes et al. (2011), HM Treasury (2011)
Capturing and measuring outcomes and impacts, let alone monetising them to establish cost-benefit estimates as is often demanded by policymakers to assess the value for money of their investments, is incredibly challenging and often not feasible. The feasibility of assessing value for money
true if the effects build up gradually over an extended period of time.” (Hughes and Martin, 2012, p. 17).
[image:43.595.76.522.233.483.2]However, regardless of the feasibility of measuring and quantifying impacts and assessing the counterfactual, understanding the processes by which the changes occur, from the investments made to the activities funded and outcomes and impacts arising from these, is a critical part of the logic model. Hughes and Martin (2012) therefore note the important emphasis on understanding the process as a guide to policy evaluation. They note that it is these connections and pathways between the different stages of the logic model that form the core of an innovation systems based approach to policy analysis and evaluation.
Figure 5.3: Relationship between time, attribution and impact
Source: Hughes and Martin (2012)
Reflecting these challenges, Hughes (2012) adapts and extends the Treasury logic model to frame the analysis of the impacts arising from investments into the public research base (Figure 5.3). Critically, while the logic model has a linear feel to it, as Hughes and Martin (2012) have argued, the model must recognise the processes through which the impacts are realised and hence the
The critical importance of complementary assets which may be well beyond the control of the public sector and may condition the scale of the impacts arising from the investment. This makes it important to position the university base and its activities within the wider innovation system.
The long time-scales involved in the process and the extreme uncertainty that is often
accompanied by this type of investment.
The ‘skewness’ of the returns to innovation and hence the impacts of funding to support the
translation process. This implies that many research efforts may yield low or no impact with a small number of activities dominating the impact. This underlines the importance of portfolio based analyses of research activities and must accept ‘honourable dead-ends’ in research.
Some types of impacts can be difficult to measure and proxies may be hard to obtain,
leading to underestimation of the wider benefits and the overall impacts.
They argue that the emphasis on the importance of understanding the processes by which impacts occur for the reasons outlined above lends itself to a ‘narrative’ approach to impact assessment (Hughes and Martin, 2012, p.21) which combines both quantification where possible with qualitative assessments of behavioural impacts, and measures of different kinds of outputs at each stage in the logic model. This is echoed by a report in the US (Olson and Merrill, 2011) which argues that there are dangers in relying too heavily on performance measures alone, given the types of limitations outlined by Hughes and Martin (2012) above and the potential for mixed signals to arise. A key message from this US report is that policymakers have a tendency to oversimplify what is a complex system that translates research outputs into innovations and economic/social wealth, drawing simplistic connections between inputs, outputs and outcomes. One contributor to the report suggests that rather than creating performance metrics that fit into the simplistic narrative, an effort should be made to improve the narrative. It suggests that case studies could play an important role in revealing the complex processes at play in the exploitation of research. These can help to produce “synthetic systems-oriented insights that can have a powerful and enriching impact on policy making and ‘hopefully, change the narrative” (Olson and Merrill, 2011, p.14).
Hughes and Martin (2012) also argue that the long time-scales and uncertainties involved between investment and impact suggest that evaluations assess changes in the intermediate level activities and outcomes, rather than focussing solely on final impacts (ibid, p.22). These include not least the behavioural changes that affect the choices of those involved at the different stages of the process.
5.1.2 Developing metrics
The above framework helps to focus the development of appropriate metrics that capture the different parts of the logic chain relating to KE activities between the HE base and users in the wider innovation system. Martin (2007) presents a series of criteria for effective metrics:
Specific
Measurable
The National Research Council (2012a) also identifies a number of attributes that indicators should possess to be of use to policymakers:
Low sensitivity to manipulation
Scientifically derived/evidence based
Comparable across regions
Powerful for communication
Affordable
Accessible
Scalable
Sustainable
Policy and analytically relevant
Policy neutral
5.1.3 Deploying the framework
The above framework guided our interviews when exploring the different metrics being developed to capture KE. This was important because the term KE, as a unifying concept bringing together the broad range of activities that create direct linkages with users through which knowledge can flow, is less well accepted and understood in the US. The discourse often surrounds categories of KE such as technology transfer (spin-outs and licensing), commercialisation (including industrially sponsored research) and local economic development related support and outreach (providing support to local and state-wide companies which can include incubators, technology accelerators, science parks, training etc.).
Figure 5.4 shows the KE mechanisms for which data is collected systematically and regularly in the UK through the HE-BCI survey and other reporting mechanisms through HESA. Another key source of evidence includes the analyses of university-industry co-publications and citations to help
Figure 5.4: Main Sources of Evidence on Knowledge Diffusion Mechanisms Covering UK Universities
Collaborative research Contract research
Consultancy
Facilities and equipment services Spin-outs/start-ups
Courses
Regeneration and development Licensing/IP revenues
HE-BCI Breakdown of income/contract
s by user type
HEBCI
Destinations of graduates
DHLE
Industrially funded research grants and contracts
HESA
Publications / citations Co-publications with industry
Web of Science/Scopus
Cases/narratives of impact
REF
Research income
HESA / RAE
Students numbers
Academic FTEs by type of activity
6
KE Metrics Development in the US
As the introduction to this report noted, US metrics efforts in the area of knowledge and technology transfer/exchange are in flux, with different national-level organisations seeking to improve the breadth and depth of indicators available.
Part I described some of the existing metrics that can be used in comparisons with the UK. Historically, key data related to R&D activity within the HE sector, including that funded through direct linkages with industry, have been captured by national surveys of HEIs. Similarly, data on knowledge diffusion through the traditional mechanisms of publication – including, importantly, co-publication with industrial partners – are well established. In addition, the US has also for a long time measured the hard technology transfer activities of spin-outs, licensing and IP revenues through the well respected AUTM surveys.
In the past few years there have been developments in KE-related metrics that attempt to go beyond these narrow KE mechanisms. These include a key programme of work ongoing at APLU and STAR Metrics, a multi-agency venture led by the NIH, the NSF and the White House Office of Science and Technology Policy (OSTP). AUTM has also recently reviewed the development of KE-related metrics and its role in the process.
6.1
Growing Pressures for Metrics Development in the US
Before presenting the key developments being made by different national initiatives, it is useful to outline why this debate is brewing in the US innovation system (reflecting some of the trends described in Part I).
Recent studies by the US National Academies have highlighted the growing interest in better
understanding how investments in science and engineering research contribute to economic growth (National Research Council, 2010; Olson and Merrill, 2011). They argue that the “enactment of the America COMPETES Act in 2006 (and its reauthorization in 2010), the increase in research
the Board on Science, Technology, and Economic Policy (STEP) to improve measures of science, technology and innovation) found that we need to better understand the interplay between demand and supply side indicators (National Research Council, 2012a).
Recent US reports have considered the uses for science, technology and innovation indicators for policy: monitoring, benchmarking, evaluating, and foresighting (Gault (2010) cited in National Research Council (2012a). More specifically, Olson and Merrill (2011) identified a range of uses for R&D performance measures:
Evidence that an agency, laboratory or individual is making good use of allocated funds.
Well-defined objectives and documentation of results facilitate communication with
funders, performers, users, and others. Results become verifiable and quantifiable i