Point
Deborah Cromer,aSiok-Keen Tey,b,cRajiv Khanna,bMiles P. Davenporta
Complex Systems in Biology Group, Centre for Vascular Research, University of New South Wales, Kensington, New South Wales, Australiaa; Australian Centre for Vaccine Development and Department of Immunology, Queensland Institute of Medical Research, Brisbane, Queensland, Australiab; Department of Haematology and Bone Marrow Transplantation, Royal Brisbane and Women’s Hospital, Herston, Queensland, Australiac
Calculation of pathogen growth rates is important in understanding the natural history of infection and effects of therapy. How-ever, it is often difficult to estimate pathogen growth because patients are treated immediately upon the detection of infection, leaving only one nonzero untreated reading. Previous approaches have relied on the flawed assumption that pathogen loads just prior to detection are at the assay detection threshold. We have developed a novel method for estimating the pathogen growth rate from a single reading and investigated the initial growth of cytomegalovirus (CMV) in allogeneic hematopoietic stem cell transplant (HSCT) patients. We applied this approach to CMV viral loads measured at least weekly in 122 patients in the 3 months posttransplant. Viral growth rates were estimated by using a modeling approach that accounts for the viral load and the time since the last negative reading. Viral growth rates decreased rapidly within the first week, from 0.72/day (doubling time, 0.96 day) at the point of reactivation to 0.22/day (doubling time, 3.1 days) at 1 week. Results from this method correlated closely with a two-point regression analysis of a subset of 58 patients with detectable subthreshold viral loads immediately prior to overt reactivation. Patients with lymphocyte counts of>0.5ⴛ109/liter had significantly slower viral growth than patients with low lymphocyte counts (0.612/day versus 0.325/day,P<0.0001). Thus, our novel method of estimating pathogen growth rates re-veals a rapid slowing of CMV growth during reactivation in HSCT patients and a significant impact of the lymphocyte count on CMV growth.
C
ytomegalovirus (CMV) is an endemic betaherpesvirus with a seroprevalence of around 40 to 90% globally (1). The virus persists lifelong following primary infection and can reactivate in immunocompromised individuals. Allogeneic hematopoietic stem cell transplantation is associated with severe impairment of T cell immunity, and CMV reactivation is common. CMV disease, once established and clinically apparent, is associated with signif-icant morbidity and mortality. Hence, management centers on regular virological surveillance by either antigenemia or DNAemia and the early use of preemptive antiviral treatment (2). An under-standing of viral dynamics, particularly early in the course of re-activation, can help to define the frequency of virological moni-toring and threshold for antiviral treatment in different clinical risk groups. However, estimation of the viral growth rate is ham-pered by the fact that often only one viral load measurement above the limit of detection is taken before the institution of preemptive treatment. Calculations made from sequential readings, even if these are available and not influenced by antiviral treatment, may not accurately reflect the very early viral growth rate because the rate of growth decreases as the viral load approaches its peak (3). The ability to estimate the early growth rate by using a single measurement from each patient has broad clinical applications, as there are many situations where standard regression techniques cannot be used because of a lack of consecutive measurements. Examples include estimations of viral growth in acute HIV infec-tion (4), the parasite growth rate in therapeutic trials for malaria (5,6), and the tumor growth rate in routine cancer screening (7). Previous attempts to estimate CMV growth rates by using only a single measurement above the limit of detection relied on the assumption that the CMV load at the last negative reading was equal to the assay detection threshold (8). We will refer to this previously used method as the detection limit method. Thisas-sumption is unlikely to be true and is likely to result in both an underestimation of the true growth rate and an overestimation of the relative variation between patients, as shown inFig. 1.
The issue of insufficient measurements above the limit of de-tection is common in many systems. In this study, we developed a method to calculate the pathogen growth rate from a single mea-surement by using the concept that viral loads are likely to cross the detection threshold at roughly equal probability throughout the period between tests rather than at the time of the last negative test. Hence, the observed distribution of viral loads can be thought of as a product of two separate distributions: (i) the distribution of growth rates and (ii) a uniform distribution representing the time required to cross the detection threshold. This enabled the deri-vation of an analytical expression for the mean and standard de-viation of the viral growth rate in a cohort. We applied this method to a cohort of hematopoietic stem cell transplant recipi-ents and showed that the viral growth rate is, in fact, significantly higher and less variable than that estimated by previous methods. We also showed that the growth rate is influenced by immune reconstitution and decreases as the viral load increases. We have therefore described an improved method of calculating viral
Received10 October 2012Accepted27 December 2012
Published ahead of print9 January 2013
Address correspondence to Miles P. Davenport, m.davenport@unsw.edu.au.
D.C. and S.-K.T. contributed equally to this report.
Supplemental material for this article may be found athttp://dx.doi.org/10.1128 /JVI.02821-12.
Copyright © 2013, American Society for Microbiology. All Rights Reserved.
doi:10.1128/JVI.02821-12
on November 7, 2019 by guest
http://jvi.asm.org/
growth rates from single measurements above the detection limit. This method is simple to implement, does not require more than one data point for each patient, and can be applied to cohorts of as few as 25 samples and therefore has broad clinical applications.
MATERIALS AND METHODS
Patient population and viral load data.This study was approved by the
Institutional Review Board of the Royal Brisbane and Women’s Hospital. Patients who had undergone allogeneic hematopoietic stem cell trans-plantation between January 2006 and July 2011 and who were recorded as having had early CMV reactivation were included. Virological surveil-lance by peripheral blood CMV DNA quantitation was performed in ac-cordance with the unit protocol once or twice a week for at least the first 100 days posttransplantation. The COBAS Amplicator CMV Monitor Test (Roche Diagnostics, Basel, Switzerland) was used between January 2006 and March 2010. Results were linear to 100,000 copies/ml with a detection threshold of 600 copies/ml, although the detection of viral loads below 600 copies/ml was not uncommon. From April 2010 onward, CMV DNA quantitation was performed with the Qiagen Artus CMV kit (Qia-gen, Doncaster, Victoria, Australia) on the ABI7500 platform (Applied
Biosystems, Mulgrave, Victoria, Australia), which has a detection
thresh-old of 57 copies/ml and linearity to 5.5⫻106copies/ml. Positive readings
below 600 copies/ml were recorded in the laboratory log but not reported to the treating clinicians: both negative results and positive results below
600 copies/ml were similarly reported as “⬍600 copies/ml.” Patients with
viral loads ofⱖ600 copies/ml were treated preemptively with intravenous
ganciclovir in accordance with the unit protocol.
Assumptions about the data.We assume that the available data come
from a screening test that is conducted on a semiregular basis. A negative result is obtained from the screening test when the virus is below the limit of detection, and a positive result is obtained when the virus is above this limit. We assume that the data come from a number of different patients, and for each patient with a positive result, we know the time since the last (negative) test.
For patienti, the testing gap,Ti, is defined as the time period between
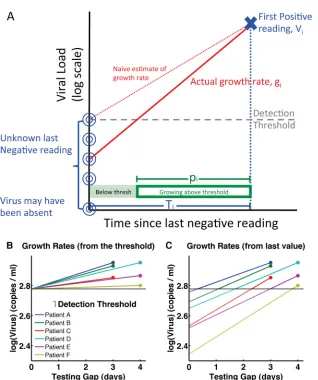
the last negative test and the first positive test. Since the testing intervals are short, semiregular, and not based on clinical outcomes, the probability of viral reactivation should not be correlated with the times of testing and so we assume that there is an equal probability of the reactivating virus rising above the limit of detection at any point during the testing gap. FIG 1Graphic description of experimental data. (A) The true viral load at the last negative reading is unknown. The assumption that it is equal to the detection
threshold results in an estimated growth rate (slope of red dotted line) that is lower than the true growth rate (slope of red solid line).Tiis the testing gap, and
piis the proportion of time for which the viral load was above the detection threshold. (B and C) Representation of growth rate calculations based on six
theoretical samples. In panel B, the viral load at the last negative reading is assumed to be equal to the detection threshold when, in fact, it was likely to be at or below the detection threshold, as depicted in panel C. The growth rates estimated in panel B are lower (lines less steep) and more variable than the true growth rates represented in panel C.
on November 7, 2019 by guest
http://jvi.asm.org/
[image:2.585.136.454.57.437.2]Hence, the proportion of time during the testing gap that the virus is
above the limit of detection for patienti,pi, is approximately evenly
dis-tributed and we can write the following:
[image:3.585.300.542.66.181.2]pi⬃U
共
0, 1兲
(1) A graphic description of the assumptions described above is given inFig. 1A.
Assumptions about the growth rate.We assume that the growth rate
for patienti,gi, takes on only positive values and that the overall
distribu-tion of growth rates,G, can be expressed as follows:
gi⬃G
共
, 2兲
(2)whereGis any (positive) probability distribution with meanand
stan-dard deviation.
Observed virus.Using the above assumptions, the viral load of patient
iat the first positive reading,Vi, is given by the following:
Vi⫽LegipiTi (3)
whereLis the limit of detection,giis the viral growth rate, andpiTiis the
time for which the virus has been growing above the limit of detection.
Determination of growth rate parameters.We define a quantityQi
for each patientias the difference between the log of the first positive
reading (Vi) and the log of the detection threshold (L) divided by the
testing gap (Ti) as follows:
Qi⫽
关
ln共
Vi兲
⫺ln共
L兲兴
⁄Ti⫽gipi (4)The distribution ofQiis therefore independent of the testing gap and
is a product of (i) the distribution of growth rates,G(,2), and (ii) the
uniform distribution representing the proportion of time the viral load was above the testing threshold. Hence, the following:
Q⬃G
共
, 2兲
⫻U共
0, 1兲
(5)Qican be calculated for each patient by usingVi,Ti, andL. Using corollary
A.1 in part 1 of the supplemental material, the mean and standard
devia-tion of the viral growth rate distribudevia-tion (G) in a cohort of patients is
determined as follows:
mean
共
G兲
⫽2mean共
Q兲
(6)stdev
共
G兲
⫽兹
3stdev共
Q兲
2⫺mean共
Q兲
2 (7)It is possible that equation 7 will involve taking the square root of a
negative number, in which case, we set stdev(G) to 0.
To confirm that any error associated with the application of equations 6 and 7 to experimental data is acceptable, we applied them to a simulated data set (both with and without error added) and showed that the single-point estimates from equations 6 and 7 provide a level of accuracy similar to that obtained by using standard estimates of the group mean and stan-dard deviation from at least 25 samples containing some variation (see part 2 of the supplemental material). Moreover, the estimates are robust upon the addition of measurement error. One point to note is that ana-lytical constraints outlined in part 2 of the supplemental material suggest that equation 7 should only be used to calculate standard deviations in cohorts of at least 100 patients. For a worked example of how to apply equations 6 and 7 to experimental data, see part 3 of the supplemental material.
RESULTS
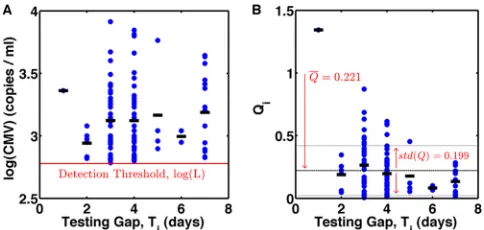
Use of the single-measurement method to estimate CMV growth rates from experimental data.There were 130 first epi-sodes of early CMV reactivation (⬎600 copies/ml). Eight episodes had unusually long testing gaps (9 to 21 days) and were excluded. The remaining 122 episodes included in the analysis had testing gaps ofⱕ7 days. The viral load at first detection,Vi, and the
cal-culated value ofQiare shown inFig. 2AandB. The mean ofQiwas
0.221 with a standard deviation of 0.199. Hence, the calculated mean growth rate of the cohort was 0.443/day (equation 6) with a
standard deviation of 0.263/day (equations 6 and 7). This corre-sponds to a doubling time,DT, of 1.6 days [sinceDT⫽ln(2)/ growth rate].
The CMV growth rate decreases over time.If the virus is growing at a constant rate, then the average CMV load upon de-tection (Vi) should increase steadily with the testing gap, while the
values ofQi(which were normalized for the testing gap) should
remain relatively constant. However, data inFig. 2show that as the testing gap increases, Vi remains fairly constant while Qi
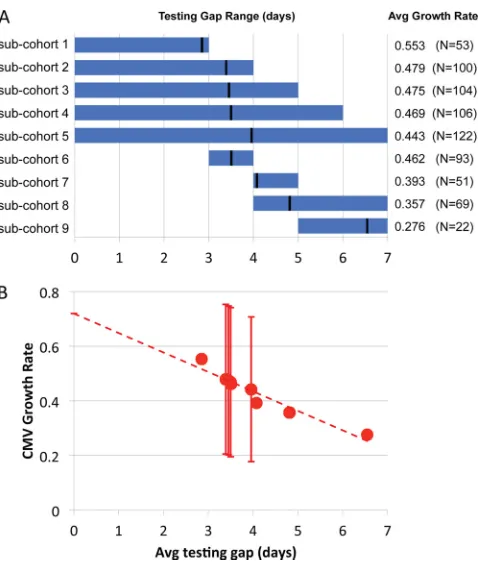
de-creases, suggesting a decrease in the growth rate with time. To investigate this further, the overall cohort of 122 patients was di-vided into subcohorts, each consisting of patients whose testing gap fell within a specified time range (Fig. 3A) and the average viral growth rate of each subcohort was calculated by using equa-tion 6. As the average testing gap increases, the estimated average growth rate decreases (Fig. 3B), suggesting that the growth rate may decrease even before the virus is detected and therefore esti-mates that rely on later readings may significantly underestimate the early CMV growth rate. By fitting a line (R2⫽0.93) through
the calculated CMV growth rates and the corresponding average testing gap in each subcohort shown, we can estimate the CMV growth rate at the time the virus first becomes detectable (testing gap⫽0 days) as 0.720/day (doubling time, 0.96 day).
Comparison of the results of the single-point method with estimates obtained from two points.The limit of detection for preemptive treatment in use throughout most of the study period was 600 copies/ml, However, positive results under 600 copies/ml were sometimes detected but not formally reported to the treating clinicians. We reviewed the laboratory log to obtain the actual machine readout of viral loads and found a subset of 58 patients who had documented viral loads below 600 copies/ml at the time of the last “negative” reading, i.e., at the start of the testing gap. This enabled direct calculation of a two-point growth rate esti-mate by using the formulaV(t1)⫽V(t0)eg(t1⫺t0), wheregis the
growth rate,t0andt1are the two time points, andV(t1) andV(t0)
are the corresponding viral loads (Fig. 4A). Growth rate estimates obtained by the detection limit method, where the viral load was assumed to be at 600 copies/ml at the start of the testing gap, are shown inFig. 4Bfor comparison.
We used the subcohorts shown inFig. 3Ato determine average CMV growth rate estimates made by using our one-point method, the detection limit method, and the two-point method.
Addition-FIG 2Experimentally measured CMV viral loads at the time of first detection and calculated values ofQi. (A) Viral load data for 122 patients. Dots represent
individual patient data, and lines represent the average viral loads for the testing gaps. (B)Qivalues calculated by using equation 4 with a limit of
detec-tion (L) of 600.
on November 7, 2019 by guest
http://jvi.asm.org/
ally, we used bootstrapping of 10,000 iterations sampled with re-placement to determine the 95% confidence intervals of the esti-mates of the means and standard deviations of the CMV growth rates obtained by these three methods. We also calculated the coefficient of variation of the growth rates, CV(G), to give a mea-sure of the standard deviation of the growth rate estimates relative to the mean.
The results inFig. 4CandTable 1show that the detection limit
estimates are lower and more varied (higher coefficient of varia-tion) than both the two-point and single-point estimates. The two-point estimates are, however, very similar to those obtained by the single-point methodology presented in this paper.
Interaction between immune reconstitution and the viral growth rate.Immune reconstitution is closely associated with the risk of CMV-related complications (2,9,10), but its effect on the initial viral growth rate has not been defined. We used the absolute lymphocyte count as a measure of cellular immune reconstitution and divided patients into two groups, those who were severely lymphopenic (lymphocyte counts of⬍0.5⫻109/liter) and those
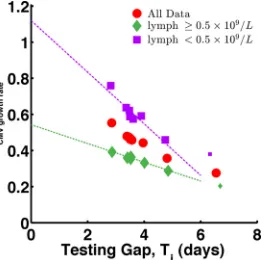
who were less lymphopenic (lymphocyte counts ofⱖ0.5⫻109/ liter). By our single-point method, the estimated average viral growth rate in the former group was nearly twice that in the latter group [mean(G) values of 0.591 (95% confidence interval, 0.460 to 0.722) and 0.332 (95% confidence interval, 0.265 to 0.399)/day, respectively]. Using a permutation approach, we estimated the probability of observing a difference of this magnitude by chance to be 0.0003. We next divided the patients into subcohorts as previously described and confirmed that the growth rates differed between the two groups, regardless of the testing gap (Fig. 5). By fitting a line through both sets of growth rate estimates, we esti-mated the average growth rates at the time CMV first becomes detectable to be 0.543/day and 1.12/day for those with higher and lower lymphocyte counts, respectively. As the average testing gap increases, the CMV growth rates decrease in both groups so that after 1 week there may no longer be a difference between the two groups (Fig. 5). In response to reviewers’ comments, we also checked whether the total white cell count, all granulocytes, neu-trophils, basophils, eosinophils, and monocytes, was associated with the viral growth rate (comparing the patients above the me-dian with those below). No significant differences between groups were observed when patients were divided according to the counts of the other components of the white cell count.
DISCUSSION
In this paper, we present an analytically rigorous method to esti-mate viral or pathogen growth rates by using a single time point where a screening test is conducted on a semiregular basis. It com-bines knowledge of the variation in the pathogen growth rate with variation in the times at which the pathogen crosses the detection
FIG 3Relationship between the average testing gap and the average estimated growth rate of CMV calculated by using measurements from patients with various testing gaps. (A) The testing gap range (blue bar) and average (black line) in each subcohort. Also shown is the average growth rate and number of patients in each cohort. (B) Graph of the growth rate and testing gap of each
cohort. Error bars represent estimated standard deviations wherenisⱖ96.
The dashed line shows a line fitted to the growth rate estimates (y⫽0.720⫺
0.0712x;R2⫽0.93).
FIG 4Growth rate estimates for 58 patients with CMV readings below the limit of detection at the start of the testing gap. (A) Two-point growth rates calculated from viral loads taken at the start and end of the testing gap. (B) Growth rates estimated by the previously used detection limit method, which assumes that the CMV load is equal to the limit of detection at the time of the last negative reading. (C) Average growth rates in subcohorts with different testing gap ranges (as
inFig. 3B) estimated by using our single-point method (red), the two-point method (black squares), and the previously used detection limit method (blue
diamonds). Smaller dots show estimates from subcohorts with⬍10 patients. These points were not used in the extrapolation.
on November 7, 2019 by guest
http://jvi.asm.org/
[image:4.585.44.283.63.344.2] [image:4.585.97.490.548.673.2]threshold, the latter being something that has rarely been consid-ered.
The average virus growth rate calculated with our single-point method (0.443/day) agrees closely with a two-point estimate ob-tained from a subset of patients with available data and corre-sponds to a doubling time of 1.6 days. Analysis of the entire data set by the conventional detection limit method gave a lower growth rate (0.221/day; doubling time, 3.1 days) that would have corresponded to previous reports that used the same methodol-ogy (8). Thus, there is a close correspondence in the raw data and the differences in the estimated growth rate depend on the meth-odology used, most importantly, when the virus is assumed to first appear above the limit of detection. The conventional assumption that the viral load is at the limit of detection at the start of the testing gap underestimates the growth rate by half. While a sys-temic error may not be critical when comparing the growth rates in groups of patients, it has a major impact on our understanding of longitudinal viral kinetics since the calculation of growth rates at later time points utilizes a two-point method.
The above estimates were obtained by using all of the positive virus readings that appeared within 1 week of the last negative reading. However, previous work has suggested that the CMV growth rate decreases as the peak viral load is approached (3) and our data further showed that this decrease occurred within a few days of virus reactivation. Therefore, using readings with a week-long testing gap may underestimate the early CMV growth rate. By
dividing patients into subcohorts with different average testing gaps and extrapolating back the growth rate, we estimated the early viral growth rate at the time the virus first becomes detect-able as 0.72/day, corresponding to a doubling time of 0.96 day. This is the first time that the viral growth rate has been estimated immediately after detection, and the estimate is similar to the up-per estimates of 0.61 to 0.70/day obtained by Emery et. al (11,12) by using alternative, but more complex, techniques that similarly were less likely to underestimate the growth rate because of slow-ing of viral growth.
Using our method, we find that patients with severe lymphope-nia have higher initial CMV growth rates than patients with higher lymphocyte counts; however, this difference disappears within a week of CMV detection. The underlying biology behind this change remains unclear but could involve the development of CMV-specific immunity despite poor global immunity.
Although alternative methods of analyzing censored data where only one time point is available have been developed for both virus and tumor growth rates, many of these involve either a retrospective search for additional information (13) or combina-tion of the censored data with data from patients with multiple measurements. The latter often requires the use of complex ana-lytical or statistical programs, and the growth estimates only par-tially rely on the censored data (14–16). In contrast, the method presented here requires only a single positive measurement per patient, places no further restrictions on the data, and can be im-plemented easily by using standard software.
We present a simple and much-needed tool to quantify early pathogen growth rates when limited data are available. This method is analytically rigorous and does not rely on any compli-cated statistical tools or understanding. The results obtained by our method agree extremely well with those obtained by a two-point regression method and provide support for the use of this technique to make growth rate estimates based on censored data.
ACKNOWLEDGMENTS
This work was supported by the National Health and Medical Research Council of Australia (630542 to M.P.D. and 1002476 to R.K.), the Cancer Council Queensland (1003477 to R.K.), the University of New South Wales (Vice Chancellor’s Postdoctoral Research Fellowship to D.C.), and The Leukemia Foundation of Australia (Clinical Research Fellowship to S.K.T.).
We thank Ruy Ribeiro for helpful comments on the manuscript.
REFERENCES
1.Seale H, MacIntyre CR, Gidding HF, Backhouse JL, Dwyer DE, Gilbert
L.2006. National serosurvey of cytomegalovirus in Australia. Clin.
[image:5.585.40.546.80.151.2]Vac-cine Immunol.13:1181–1184.
TABLE 1Means and standard deviations estimated by the single-point, two-point, and detection limit methods
Parameter
Value (day⫺1) (95% CI)
Single-point methodc Two-point methodd Detection limit methodc
Mean(G)a 0.443 (0.373–0.512) 0.431 (0.370–0.491) 0.221 (0.186–0.257)
Stdev(G)a 0.265 (0.161–0.369) 0.237 (0.153–0.321) 0.199 (0.146–0.253)
CV(G)a 0.599 (0.393–0.805) 0.551 (0.391–0.791) 0.901 (0.723–1.08)
Early growtha,b 0.720 (0.505–0.934) 0.575 (0.067–1.08) 0.360 (0.253–0.467)
aValues are shown with the 95% confidence interval of 10,000 runs bootstrapped with replacement. b
Only subcohorts with more than 15 patients contributed to the estimate of early viral growth rate.
cn⫽122. d
n⫽58.
FIG 5Relationship between the average testing gap and the average growth rate for patients in different lymphocyte groups. The average CMV growth rates are shown for all patients (red circles) (fromFig. 3B), patients with
lym-phocyte counts ofⱖ0.5⫻109/liter (green diamonds), and patients with
lym-phocyte counts of⬍0.5⫻109/liter (purple squares). Regardless of the testing
gap, patients with high lymphocyte counts have a lower CMV growth rate than those with low lymphocyte counts. Smaller symbols show estimates from
sub-cohorts with⬍15 patients. These points were not used in the extrapolation.
on November 7, 2019 by guest
http://jvi.asm.org/
[image:5.585.99.232.516.646.2]2.Boeckh M, Ljungman P.2009. How we treat cytomegalovirus in
hema-topoietic cell transplant recipients. Blood113:5711–5719.
3.Kuo YH, Kuo YL.2000. Viral-load kinetics and CMV disease. Lancet
356:1352–1353.
4.Ribeiro RM, Qin L, Chavez LL, Li D, Self SG, Perelson AS. 2010. Estimation of the initial viral growth rate and basic reproductive number
during acute HIV-1 infection. J. Virol.84:6096 – 6102.
5.Dent AE, Bergmann-Leitner ES, Wilson DW, Tisch DJ, Kimmel R, Vulule J, Sumba PO, Beeson JG, Angov E, Moormann AM, Kazura JW. 2008. Antibody-mediated growth inhibition of Plasmodium falciparum: relationship to age and protection from parasitemia in Kenyan children
and adults. PLoS One3:e3557. doi:10.1371/journal.pone.0003557.
6.Michon P, Cole-Tobian JL, Dabod E, Schoepflin S, Igu J, Susapu M, Tarongka N, Zimmerman PA, Reeder JC, Beeson JG, Schofield L, King CL, Mueller I.2007. The risk of malarial infections and disease in Papua
New Guinean children. Am. J. Trop. Med. Hyg.76:997–1008.
7.Michaelson J, Satija S, Moore R, Weber G, Halpern E, Garland A, Kopans DB.2003. Estimates of breast cancer growth rate and sojourn
time from screening database information. J. Women’s Imaging5:11–19.
8.Emery VC, Sabin CA, Cope AV, Gor D, Hassan-Walker AF, Griffiths
PD.2000. Application of viral-load kinetics to identify patients who
de-velop cytomegalovirus disease after transplantation. Lancet355:2032–
2036.
9.Boeckh M, Leisenring W, Riddell SR, Bowden RA, Huang M-L, Myer-son D, Stevens-Ayers T, Flowers MED, Cunningham T, Corey L.2003. Late cytomegalovirus disease and mortality in recipients of allogeneic
he-matopoietic stem cell transplants: importance of viral load and T-cell
im-munity. Blood101:407– 414.
10. Gratama JW, Boeckh M, Nakamura R, Cornelissen JJ, Brooimans RA, Zaia JA, Forman SJ, Gaal K, Bray KR, Gasior GH, Boyce CS, Sullivan LA, Southwick PC.2010. Immune monitoring with iTAg MHC Tetram-ers for prediction of recurrent or pTetram-ersistent cytomegalovirus infection or disease in allogeneic hematopoietic stem cell transplant recipients: a
pro-spective multicenter study. Blood116:1655–1662.
11. Emery VC, Cope AV, Bowen EF, Gor D, Griffiths PD. 1999. The dynamics of human cytomegalovirus replication in vivo. J. Exp. Med.
190:177–182.
12. Emery VC, Hassan-Walker AF, Burroughs AK, Griffiths PD. 2002. Human cytomegalovirus (HCMV) replication dynamics in HCMV-naive
and -experienced immunocompromised hosts. J. Infect. Dis.185:1723–
1728.
13. Peer PG, van Dijck JA, Hendriks JH, Holland R, Verbeek AL.1993.
Age-dependent growth rate of primary breast cancer. Cancer71:3547–
3551.
14. Gorlova O, Peng B, Yankelevitz D, Henschke C, Kimmel M. 2005. Estimating the growth rates of primary lung tumours from samples with
missing measurements. Stat. Med.24:1117–1134.
15. Lyles R, Lyles CM, Taylor DJ.2000. Random regression models for human immunodeficiency virus ribonucleic acid data subject to left censoring and informative drop-outs. J. R. Stat. Soc. Ser. C Appl. Stat.49:485– 497. 16. Thiébaut R, Jacqmin-Gadda H.2004. Mixed models for longitudinal
left-censored repeated measures. Comput. Methods Programs Biomed.
74:255–260.