Local authority child protection registers in Wales, 2015
This bulletin presents figures about children on child protection registers in Wales. This is a more detailed analysis of data previously released on 3 September 2014 in Referrals, Assessments and Social Care for children, 2014-15 (SDR 143/2015). All information is based on the financial year 2014-15, or the position at 31 March 2015, unless otherwise stated. There are no scheduled revisions planned to this bulletin. Further information and full details for individual local authorities were published on 2 September 2015 on StatsWales.
Key results for the period 1 April 2014 to 31 March 2015:
There were 2,936 children (including unborn children) on child protection registers at 31 March 2015. This is a decrease of 6 per cent compared with 31 March 2014 and represents a rate of 47 children per 10,000 population aged under 18. The decrease on last year ends the trend of the last decade which had seen a steady long-term increase. (Table 1)
There were 1,460 boys, 1,460 girls and 15 unborn children on the registers at 31 March 2015. 41 per cent of children on child protection registers were aged under 5. (Table 3)
The highest number of registrations was shown in categories involving neglect (43 per cent) and the lowest in categories of sexual abuse (8 per cent) (note that registrations may state more than one category of abuse). (Table 4)
There were 4,435 children added to registers during the year ending 31 March 2015, an increase of 6 per cent on the previous year. The number of children removed from the registers during the year increased by 16 per cent to 4,635. (Table 5)
Chart 1: Number of children on child protection registers, at 31 March
0 500 1,000 1,500 2,000 2,500 3,000 3,500
2000 2001 2002 2003 2004 2005 2006 2007 2008 2009 2010 2011 2012 2013 2014 2015
SB 111/2015 24 November 2015
Statistician: Robin Jones Tel: 029 2082 3625 E-mail: stats.pss@wales.gsi.gov.uk
Next update: November 2016 (provisional)
Table of Contents
Number and rate of children on child protection registers ... 3
Children on child protection registers, by category of abuse, age and gender... 6
Registrations of children on child protection registers, by category of abuse ... 9
Additions, removals, re-referrals and length of time of children on child protection registers ... 11
Glossary ... 13
Notes ... 14
Key Quality Information ... 16
Tables and Charts
Chart 1: Number of children on child protection registers, at 31 March ... 1Map 1: Rate of children on child protection registers per 10,000 population aged under 18, at 31 March 2015 ... 3
Table 1: Number of children on child protection registers, at 31 March ... 4
Chart 2: Changes in the rate of children on child protection registers per 10,000 population aged under 18, between 31 March 2013 and 31 March 2015 ... 5
Chart 3: Children on child protection registers, as a percentage of all open cases of children in need (including looked after children), at 31 March 2015 ... 5
Table 2: Number of children on child protection registers and rate per 10,000 population, by category of abuse, at 31 March ... 6
Chart 4: Percentage of children on child protection registers, at 31 March 2015, by category of abuse .... 6
Chart 5: Number of children on child protection registers, by age group and gender, at 31 March 2015 .. 7
Table 3: Number of children on child protection registers, by category of abuse and age, at 31 March 2015 ... 8
Table 4: Percentage of registrations to child protection registers, by category of abuse, at 31 March 2015 ... 9
Chart 6: Percentage of registrations of children on child protection registers, by category of abuse, at 31 March ... 10
Table 5: Number of additions and removals from child protection registers, year ending 31 March ... 11
Chart 7: Percentage of children added to child protection registers, who had previously been on the register, year ending 31 March 2015 ... 12
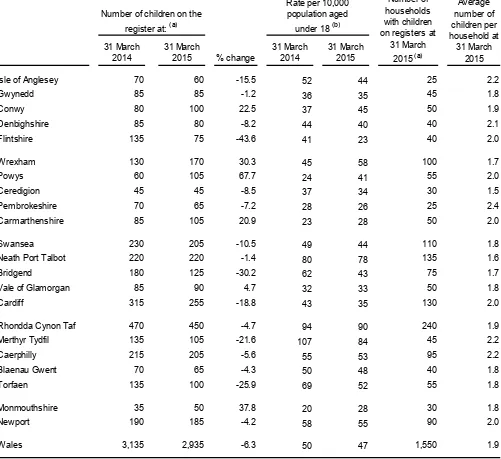
Table 1: Number of children on child protection registers, at 31 March
31 March 2014
31 March
2015 % change
31 March 2014
31 March 2015
Isle of Anglesey 70 60 -15.5 52 44 25 2.2
Gwynedd 85 85 -1.2 36 35 45 1.8
Conwy 80 100 22.5 37 45 50 1.9
Denbighshire 85 80 -8.2 44 40 40 2.1
Flintshire 135 75 -43.6 41 23 40 2.0
Wrexham 130 170 30.3 45 58 100 1.7
Powys 60 105 67.7 24 41 55 2.0
Ceredigion 45 45 -8.5 37 34 30 1.5
Pembrokeshire 70 65 -7.2 28 26 25 2.4
Carmarthenshire 85 105 20.9 23 28 50 2.0
Swansea 230 205 -10.5 49 44 110 1.8
Neath Port Talbot 220 220 -1.4 80 78 135 1.6
Bridgend 180 125 -30.2 62 43 75 1.7
Vale of Glamorgan 85 90 4.7 32 33 50 1.8
Cardiff 315 255 -18.8 43 35 130 2.0
Rhondda Cynon Taf 470 450 -4.7 94 90 240 1.9
Merthyr Tydfil 135 105 -21.6 107 84 45 2.2
Caerphilly 215 205 -5.6 55 53 95 2.2
Blaenau Gwent 70 65 -4.3 50 48 40 1.8
Torfaen 135 100 -25.9 69 52 55 1.8
Monmouthshire 35 50 37.8 20 28 30 1.8
Newport 190 185 -4.2 58 55 90 2.0
Wales 3,135 2,935 -6.3 50 47 1,550 1.9
Number of households with children on registers at
31 March 2015 (a)
Average number of children per household at 31 March
2015
(b) Based on the Office for National Statistics' mid year estimates (MYEs) of the population aged under 18 at 30 June 2013 and 30 June 2014
Number of children on the register at: (a)
Rate per 10,000 population aged
under 18 (b)
(a) Data rounded to the nearest 5 for disclosure reasons. The sum of the component parts may not add up to the totals shown.
There were 2,936 children (including unborn children) on child protection registers at 31 March 2015. This is a decrease of 6 per cent compared with 31 March 2014 and represents a rate of 47 children per 10,000 population aged under 18.
Chart 2: Changes in the rate of children on child protection registers per 10,000
population aged under 18, between 31 March 2014 and 31 March 2015
Merthyr TydfilBridgend Torfaen
Flintshire Cardiff Isle of AngleseySwansea
Rhondda Cynon TafDenbighshire CeredigionCaerphilly
Newport Blaenau GwentPembrokeshire Neath Port TalbotGwynedd
Vale of GlamorganCarmarthenshire MonmouthshireConwy
WrexhamPowys
-30 -25 -20 -15 -10 -5 0 5 10 15 20 25 30
Changes in the rate of children per 10,000 population aged under 18 on child protection registers between 31 March 2014 and 31 March 2015 varied from the greatest increase of 17 in Powys, to the greatest decrease of 23 in Merthyr Tydfil.
Chart 3: Children on child protection registers, as a percentage of all open cases of
children in need (including looked after children), at 31 March 2015
0 2 4 6 8 10 12 14 16 18 20 R h o n d d a C yn on T a f W re xh a m Isl e o f A n g le se y D e n b ig h sh ir e N e a th P o rt T a lb o t N e w p o rt M e rt h yr T yd fil P e m b ro ke sh ire C a e rp hi lly C o n w y V a le o f G la m o rg a n W a le s P o w ys F lin tsh ir e G w yn e d d S w a ns ea C a rd iff M o n m o u th sh ir e B ri d g e n d T o rf a e n C a rm a rt h e n sh ir e C e re d ig io n B la e n a u G w e n t Pe rc en ta ge
In Wales, children on child protection registers made up 12 per cent of all open cases of children in need, varying from 7 per cent of children in need in Blaenau Gwent to 17 per cent in Rhondda Cynon Taff.
Children on child protection registers, by category of abuse, age and gender
Table 2: Number of children on child protection registers and rate per 10,000 population,
by category of abuse, at 31 March
Neglect (only)
Physical abuse
(only)
Sexual abuse
(only)
Emotional abuse
(only)
Neglect, physical abuse and
sexual abuse
Neglect and physical
abuse
Neglect and sexual abuse
Physical abuse
and sexual
abuse Total
Number (a)
2002 790 410 190 405 15 115 30 15 1,970
2003 935 440 180 425 10 155 60 35 2,235
2004 930 385 185 430 15 130 40 40 2,155
2005 975 425 175 470 15 120 65 25 2,270
2006 1,055 345 145 410 10 140 40 20 2,165
2007 1,125 350 160 470 10 170 25 20 2,325
2008 1,095 315 160 580 * 125 30 15 2,320
2009 1,115 385 175 645 5 130 45 10 2,510
2010 1,180 415 205 735 * 130 45 15 2,730
2011 1,265 375 155 890 10 125 50 10 2,880
2012 1,245 375 150 935 * 125 25 20 2,885
2013 1,195 400 160 1,065 * 95 30 * 2,955
2014 1,225 350 160 1,200 15 130 40 15 3,135
2015 1,170 385 170 1,020 15 115 50 15 2,935
Rate (b)
2002 11.9 6.2 2.9 6.1 0.2 1.7 0.4 0.2 29.8
2003 14.2 6.7 2.7 6.5 0.1 2.3 0.9 0.5 33.9
2004 14.2 5.9 2.8 6.5 0.2 2.0 0.6 0.6 33.0
2005 14.9 6.5 2.7 7.2 0.2 1.9 1.0 0.4 34.8
2006 16.3 5.3 2.3 6.3 0.1 2.1 0.6 0.3 33.4
2007 17.5 5.5 2.5 7.3 0.2 2.6 0.4 0.3 36.1
2008 17.1 4.9 2.5 9.0 * 2.0 0.4 0.2 36.2
2009 17.5 6.0 2.7 10.1 0.1 2.0 0.7 0.1 39.2
2010 18.6 6.5 3.3 11.6 * 2.0 0.7 0.2 42.9
2011 19.9 5.9 2.5 14.1 0.1 1.9 0.8 0.2 45.5
2012 19.7 5.9 2.4 14.8 * 2.0 0.4 0.3 45.6
2013 19.0 6.4 2.6 16.9 * 1.5 0.4 * 46.8
2014 19.4 5.6 2.6 19.0 0.2 2.1 0.6 0.2 49.7
2015 18.6 6.1 2.7 16.2 0.2 1.8 0.8 0.3 46.6
(a) Data rounded to the nearest 5 for disclosure reasons. The sum of the component parts may not add up to the totals shown.
Chart 4: Percentage of children on child protection registers, at 31 March 2015, by
category of abuse
Neglect (only) 40%
Emotional abuse (only) 35% Physical abuse (only)
13%
Multiple categories of abuse (a)
6%
Sexual abuse (only) 6%
(a) See notes for description of multiple categories of abuse
Neglect (only) is the largest category of abuse, followed by emotional abuse (only). The increase in the total number of children on child protection registers since 2002 is mainly due to increases in these categories. The fall in the number on register between 2014 and 2015 was mainly due to a fall in the number in the category ‘emotional abuse (only)’.
Chart 5: Number of children on child protection registers, by age group and gender, at 31
March 2015
0 100 200 300 400 500
Under 1 year 1-4 years 5-9 years 10-15 years 16-18 years
Boys Girls
There were 1,460 boys and 1,460 girls on the registers at 31 March 2015. However, the number of girls aged 10 and over on the registers was slightly higher than the number of boys aged 10 and over.
Table 3: Number of children on child protection registers, by category of abuse and age,
at 31 March 2015
(a)Neglect (only)
Physical abuse
(only)
Sexual abuse
(only)
Emotional abuse
(only)
Neglect, physical abuse and
sexual abuse
Neglect and physical
abuse
Neglect and sexual abuse
Physical abuse
and sexual
abuse Total
Rate per 10,000 children
(b)
Boys
Under 1 75 30 5 35 * 10 * * 160 92
1-4 220 55 15 145 * 10 5 * 455 62
5-9 170 50 20 155 * 25 * * 430 47
10-15 145 55 15 130 * 10 10 * 370 36
16-18 20 10 * 15 * * * * 45 12
Total boys 625 195 60 485 5 60 20 5 1,460 45
Girls
Under 1 65 30 10 45 * 10 * * 160 99
1-4 155 70 15 160 * 20 * * 430 61
5-9 160 45 25 165 * 10 5 * 415 48
10-15 130 35 45 150 * 15 15 * 395 40
16-18 20 5 10 20 * * * * 60 17
Total girls 535 190 105 535 5 55 25 10 1,460 48
Unborn
children 10 * * * * * * * 15 .
Total 1,170 385 170 1,020 15 115 50 15 2,935 47
(a) Data for all columns except 'rate per 10,000 children' rounded to the nearest 5 for disclosure reasons. The sum of the component parts may not add up to the totals shown.
(b) Based on the Office for National Statistics' mid year estimates (MYEs) of the population aged under 18 at 30 June 2014.
The highest rates of children on child protection registers per 10,000 population are in the under 1 age group for both boys and girls.
Registrations of children on child protection registers, by category of abuse
Table 4: Percentage of registrations to child protection registers, by category of abuse, at
31 March 2015
(a)Neglect Physical abuse
Sexual abuse
Emotional
abuse Total
Isle of Anglesey 39 38 8 15 100 65
Gwynedd 14 18 24 45 100 85
Conwy 35 30 8 26 100 100
Denbighshire 42 17 14 27 100 80
Flintshire 40 27 6 26 100 75
Wrexham 34 3 7 56 100 170
Powys 34 16 9 41 100 110
Ceredigion 54 15 15 17 100 50
Pembrokeshire 42 26 10 22 100 70
Carmarthenshire 27 2 6 65 100 105
Swansea 53 28 10 9 100 245
Neath Port Talbot 50 12 9 29 100 250
Bridgend 35 29 14 21 100 140
Vale of Glamorgan 41 12 7 41 100 90
Cardiff 47 25 4 24 100 280
Rhondda Cynon Taf 37 19 9 36 100 490
Merthyr Tydfil 30 6 2 62 100 105
Caerphilly 71 6 4 19 100 205
Blaenau Gwent 42 14 0 43 100 70
Torfaen 44 4 4 48 100 100
Monmouthshire 19 21 12 47 100 55
Newport 57 8 4 31 100 185
Wales 43 17 8 32 100 3,140
(c) Data rounded to the nearest 5 for disclosure reasons. The sum of the component parts may not add up to the totals shown.
Percentage
(b) The total number of registrations is greater than the number of children on child protection registers because of the use of multiple categories. Some authorities make use of multiple categories while others use a main category only
(a) Registrations are counted according to each recorded category of abuse
Total number of registrations
(b) (c)
Chart 6: Percentage of registrations of children on child protection registers, by category
of abuse, at 31 March
0 10 20 30 40 50 60
2002 2003 2004 2005 2006 2007 2008 2009 2010 2011 2012 2013 2014 2015
Pe
rc
en
ta
ge
Neglect Physical abuse Emotional abuse Sexual abuse
Since 2002, the percentage of registrations under categories involving sexual abuse has fallen from 14 per cent to 8 per cent. For the same period, categories involving neglect increased from 44 per cent in 2002 to a peak of 52 per cent in 2006 and have since fallen to 43 per cent in 2015. Emotional abuse has increased to 32 per cent, around double the rate in 2006. At 31 March 2015, 17 per cent of registrations were due to physical abuse.
Additions, removals, re-referrals and length of time of children on child protection
registers
Table 5: Number of additions and removals from child protection registers, year ending
31 March
(a)Number of children on the register at
31 March 2014
Additions during the year ending 31 March 2015
Removals during the year ending 31 March 2015
Number of children on the register at
31 March 2015
Net change
Isle of Anglesey 70 75 90 60 -10
Gwynedd 85 130 130 85 0
Conwy 80 135 120 100 20
Denbighshire 85 125 130 80 -5
Flintshire 135 125 185 75 -60
Wrexham 130 180 140 170 40
Powys 60 170 125 105 45
Ceredigion 45 90 95 45 0
Pembrokeshire 70 125 130 65 -5
Carmarthenshire 85 150 130 105 20
Swansea 230 340 360 205 -25
Neath Port Talbot 220 310 315 220 0
Bridgend 180 220 275 125 -55
Vale of Glamorgan 85 135 135 90 5
Cardiff 315 480 540 255 -60
Rhondda Cynon Taf 470 720 740 450 -20
Merthyr Tydfil 135 110 140 105 -30
Caerphilly 215 230 245 205 -10
Blaenau Gwent 70 125 130 65 -5
Torfaen 135 170 205 100 -35
Monmouthshire 35 75 60 50 15
Newport 190 215 225 185 -5
Wales 3,135 4,435 4,635 2,935 -200
(a) Data rounded to the nearest 5 for disclosure reasons. The sum of the component parts may not add up to the totals shown.
Chart 7: Percentage of children added to child protection registers, who had previously
been on the register, year ending 31 March 2015
0 5 10 15 20 25 30 35 Is le o f A n gl es ey W re xh am C ae rp h ill y P ow ys C ar m ar th en sh ir e C er e di g io n N ea th P o rt T al bo t N ew po rt G w yn e dd W al es D en b ig h sh ire R ho n dd a C yn on T a f C ar d iff T o rf ae n B rid ge nd V al e o f G la m o rg a n S w an se a F lin ts hi re M e rt hy r T yd fil P em b ro ke sh ire M o nm ou th sh ire C on w y B la e na u G w en t Pe rc en ta ge
The percentage of re-referrals in Wales is 15 per cent, ranging from 4 per cent in Blaenau Gwent to 27 per cent in Isle of Anglesey.
Chart 8: Length of time of children on child protection registers, at 31 March 2015
0 10 20 30 40 50 60 70 80 90 100 F lin tsh ir e C a rd iff C a rm a rt h e n sh ir e P o w ys T o rf a e n C e re d ig io n V a le o f G la m o rg a n B ri d g e n d G w yn e d d M o n m o u th sh ir e N e w p o rt W a le s R h o n d d a C yn on T a f S w a ns ea N e a th P o rt T a lb o t C o n w y P e m b ro ke sh ire B la e n a u G w e n t D e n b ig h sh ir e W re xh a m C a e rp hi lly Isl e o f A n g le se y M e rt h yr T yd fil Pe rc en ta ge
0-6 months 6-12 months 12 months and over
Around 56 per cent of children across Wales as a whole have been on the register for less than six months, and a further 29 per cent for between six months and one year. Only 16 per cent have been on the register for more than a year.
Glossary
Children in need: the term 'child in need' has a specific meaning defined by the Children Act 1989,
which placed a statutory duty on local authorities to 'safeguard and promote the welfare of children within their area who are in need'. The Act defines a child in need as a child that is unlikely to achieve or maintain, or have the opportunity of achieving or maintaining, a reasonable standard of health or
development without the provision of services by a local authority.
Children looked after: is the term used to describe any child who is in the care of the local authority or
Notes
Care should be taken in interpreting these statistics. They are not estimates of the number of children subject to, or at risk of, significant harm, as not every case is reported and many child protection referrals are resolved without having to enter the child on the register. Also, some cases will be on a register because it was considered that the child is at continuing risk of significant harm and therefore safeguarding the child requires inter-agency help and intervention delivered through a formal child protection plan.
The numbers of unborn children included in these statistics refer to children for whom the local
authority has held a pre-birth child protection conference at which it was agreed that the child should be registered at birth.
Child protection statistics are collected annually on the PM1 data collection form. Details are collected regarding:
the number of children on child protection registers at 31 March; the reasons for addition to the register; and
the numbers of children added or removed during the preceding 12 months.
The PM1 return also collects details of: looked after children;
other children in need; and social worker allocation.
The purpose of the register is:
to provide a record of all children in the area with unresolved child protection issues and who are currently the subject of an inter-agency protection plan; and
to ensure that the plans are formally reviewed every six months.
The register provides a central point of speedy enquiry for professional staff who are worried about a child and want to know whether the child is the subject of an inter-agency protection plan.
The register also provides useful information for the individual child protection agencies and for the Local Safeguarding Children Board in its policy development work and strategic planning. A decision to add a child’s name to the register will only happen following a child protection conference, or when a child on another register moves into the area. It should be recognised that the registers do not reflect the full extent of child abuse because:
not every case of child abuse is reported; and
many child abuse referrals to Social Services Departments are resolved without the need to enter the child on the register, for example, where the abuse is unsubstantiated, if the child is removed from home, or if the abuser leaves the household.
The flow of children on to and off the registers does not therefore reflect the full workload of the social workers involved in child protection.
It should also be noted that not all children listed on the register have been abused. Some will have been registered because of the continuing risk of significant harm and therefore safeguarding the child
1. The registers are used by Social Services Departments and Local Safeguarding Children boards in managing child protection work and are not designed specifically to collect statistical
information.
2. Recording and management practices may vary between Social Services Departments.
For the purposes of the statistical return, local authorities are asked to count each child in one, or a combination, of the specified categories of abuse. The category of abuse that a child is registered under is a matter of professional judgment and will normally have been decided upon at the child protection conference, when it was agreed that registration was necessary. The categories of abuse for the statistical return are:
1. Neglect, physical abuse and sexual abuse; 2. Neglect and physical abuse;
3. Neglect and sexual abuse;
4. Physical abuse and sexual abuse; 5. Neglect (only);
6. Physical abuse (only); 7. Sexual abuse (only); 8. Emotional abuse (only).
The definitions of physical abuse, emotional abuse, sexual abuse and neglect are provided in
'Safeguarding Children - Working Together under the Children Act 2004' published October 2006, see pages
5-7 Key definitions and concepts and chapter 6 paragraphs 6.6, 6.7, 6.9 and 6.11:
Physical abuse - this may involve: hitting; shaking; throwing; poisoning; burning or scalding; drowning;
suffocating; or otherwise causing physical harm to a child. Physical harm may also be caused when a parent or carer feigns the symptoms of, or deliberately causes ill health to a child who they are looking after. This situation is commonly described using terms such as factitious illness by proxy or
Munchausen's syndrome by proxy.
Emotional abuse - is the persistent emotional ill-treatment of a child such as to cause severe and
persistent adverse effects on the child’s emotional development. It may involve conveying to children that they are worthless or unloved, inadequate, or valued only insofar as they meet the needs of another person. It may feature age or developmentally inappropriate expectations being imposed on children. It may involve causing children frequently to feel frightened or in danger, or the exploitation or corruption of children. Some level of emotional abuse is involved in all types of ill-treatment of a child, though it may occur alone.
Sexual abuse - involves forcing or enticing a child or young person to take part in sexual activities,
whether or not the child is aware of what is happening. The activities may involve physical contact, including penetrative (e.g. rape or buggery) or non-penetrative acts. They may include: non-contact activities, such as involving children in looking at, or in the production of, pornographic material or watching sexual activities; or encouraging children to behave in sexually inappropriate ways.
Neglect - is the persistent failure to meet a child’s basic physical and/or psychological needs, likely to
Key Quality Information
1. Context
1.1 Policy/operational context
The data were supplied to the Data Collection team within the Welsh Government by the 22 local authorities in Wales on form PM1 except when otherwise noted. The form applies an extensive series of validation checks to ensure that the information provided is accurate and consistent. Further
information on quality and methods can be found in the Quality Report at:
http://gov.wales/statistics-and-research/referrals-assessments-social-services-children/?lang=en In these statistics, the Office for National Statistics’ mid year estimates (MYEs) of population are used to calculate rates and percentages. Where these are used for financial year data the mid year estimate relating to the first part of the financial year is used, for example, for activity relating to 2014-15 the mid year estimate for mid-2014 is used. Where rates have been calculated for the age band 16-18 years, the population aged 16-17 years has been used as only very few children of age 18 are included in the numbers on the register aged 16-18.
1.2 Symbols and rounding conventions The following symbols are used in the tables: . the data item is not applicable .. the data item is not available * the data item is disclosive
(r) data revised since previous publication
Some figures in this bulletin have been rounded to the nearest 5 in order to avoid the possibility of disclosing information about individuals.
2. Quality
This section provides a summary of information on this output against five dimensions of quality: Relevance, Accuracy, Timeliness and Punctuality, Accessibility and Clarity, and Comparability.
2.1 Relevance
The statistics are used both within and outside the Welsh Government to monitor child protection trends and as a baseline for further analysis of the underlying data. These statistics are used in a variety of ways. Some of the key users are:
Ministers and the Members Research Service in the National Assembly for Wales; Local authorities;
The third sector (e.g. charities);
The Department for Health and Social Services in the Welsh Government; Other areas of the Welsh Government;
The research community;
Students, academics and universities; Individual citizens and private companies.
The statistics may also be useful for other UK governments
The Northern Ireland Executive’s Department of Health, Social Services and Public Safety The Scottish Government, Analytical Services Division
The Department for Education in England.
local authority comparisons and benchmarks;
to inform the social services policy decision-making process in Wales; to inform the Care and Social Services Inspectorate Wales;
to model the financial consequences of changes in the population or the care system to assist in research on children receiving social services.
2.2 Accuracy
Every year the data are collected from the same source, PM1, and adhere to the national standard; they will also be coherent within and across organisations.
2.3 Timeliness and Punctuality
The Data Collection team within the Welsh Government collected Performance Management in Children’s Services data for the financial year 2014-15 between March and May 2015. Data in this bulletin refers to final 2014-15 data. This is a more detailed analysis of data previously released on 2 September 2014 in Referrals, Assessments and Social Care for children, 2014-15 (SDR 143/2015). This bulletin was published in November 2015, meeting the planned date.
2.4 Accessibility and Clarity
This statistical bulletin is pre-announced and then published on the Statistics section of the Welsh Government website. It is accompanied by more detailed tables on StatsWales, a free to use service that allows visitors to view, manipulate, create and download data:
https://statswales.wales.gov.uk/Catalogue/Health-and-Social-Care/Social-Services/Childrens-Services/Service-Provision
2.5 Comparability
Statistics collected in each United Kingdom country may differ and the detailed guidance available from each country’s website should be consulted before using these statistics as comparative measures.
Further information on comparability is available at the web page UK Comparability of Children’s Social Services Statistics. When comparing figures for different local authorities, relevant factors such as the size of the local authority population should be taken into account. Local authority population estimates by age can be found on StatsWales at https://statswales.wales.gov.uk/Catalogue/Population-and-Migration/Population/Estimates/Local-Authority
3. A National Statistics publication
National Statistics are produced to high professional standards set out in the National Statistics Code of Practice. They undergo regular quality assurance reviews to ensure that they meet customer needs. They are produced free from any political interference.
4. Revisions
Occasionally, revisions can occur due to errors in our statistical processes or when a data supplier notifies the Welsh Government that they have submitted incorrect information. In these cases, a
judgement is made as to whether the change is significant enough to publish a revised statistical release. Where changes are not deemed to be significant, figures will be corrected if they appear in future
5. Further information
Further information is available for other Personal Social Services statistical releases on the Welsh Government web site:
http://gov.wales/statistics-and-research/?topic=Health+and+social+care&lang=en#/statistics-and-research/?topics=Health+and+social+care&subtopics=Social+services&view=Search+results&types=Sta tistics&lang=en
6. Related publications
Recent relevant Personal Social Services statistical releases include: Referrals, Assessments and Social Services for Children, 2014-15
Adoptions, Outcomes and Placements for Children Looked After by Local Authorities: Year Ending 31 March 2015
A similar statistical release for England can be accessed on the Department for Education website: https://www.gov.uk/government/collections/statistics-child-protection
Child protection statistics for Scotland can be accessed on the Scottish Government website: http://www.scotland.gov.uk/Topics/Statistics/Browse/Children/TrendChildProtection
Child protection statistics for Northern Ireland can be accessed on the Department of Health, Social Services and Public Safety website:
http://www.dhsspsni.gov.uk/index/stats_research/stats-cib/statistics_and_research-cib-pub/children_statistics/stats-cib-children_order.htm
7. Contact information
If you have any comments about this Statistical Bulletin, please contact: Robin Jones
Welsh Government Cathays Park, Cardiff, CF10 3NQ
Telephone: 029 2082 3625
E-mail: stats.pss@wales.gsi.gov.uk
8. User Feedback
We want to engage with users of our statistics and we invite you to send your comments on the publication to stats.pss@wales.gsi.gov.uk