Evolution of social structure in the ant genus Myrmecia fabricius (Hymenoptera: Formicidae)
109
0
0
Full text
(2) Evolution of Social Structure in the Ant Genus Myrmecia Fabricius (Hymenoptera: Formicidae). Thesis submitted by Zengqiang QIAN MSc in January 2012. For the degree of Doctor of Philosophy in Tropical Ecology and Zoology within the School of Marine and Tropical Biology James Cook University Townsville, Queensland, Australia.
(3) TABLE OF CONTENTS. LIST OF FIGURES………...…………………………………………………………i LIST OF TABLES……………………………………………………………………ii ACKNOWLEDGEMENTS………………………………………………………iii CONTRIBUTIONS OF OTHERS….………………………………………………iv PUBLICATIONS ARISING FROM THIS THESIS……………………………v ABSTRACT………………………...………………………………………………vi CHAPTER 1: General Introduction………...………………………………………1 Background…………………..……………………………………………………1 Colony structure of eusocial insects……………………………………………………1 The Australian bulldog or jumper ant genus Myrmecia Fabricius…..……………3 Objectives and outline of the thesis………………………………………………4 CHAPTER 2: Polymorphic EST-Derived Microsatellites in the Fire Ant Solenopsis invicta and Their Cross-Taxa Transferability in the Bulldog Ant Myrmecia brevinoda and the Black Tree Ant Tetraponera punctulata……………6 Abstract……………………………………………………………………………6 Introduction……………………..…………………………………………………7 Materials and methods…………….………………………………………………9 Primer design……………..………………………………………………………………9 PCR amplification and genotyping analysis….………………………………………9 Data analysis……………………….……………………………………………………10 Results and discussion……………………………………………………………10 CHAPTER 3: Characterization of Polymorphic Microsatellites in the Giant Bulldog Ant Myrmecia brevinoda and the Jumper Ant M. pilosula……………12.
(4) Abstract………………….………………………………………………………12 Introduction………………………………………………………………………13 Materials and methods………...…………………………………………………14 Insect samples and DNA extraction……..……………………………………………14 Microsatellite isolation…………………………………………………………………15 PCR amplification and genotyping analysis…………..……………………………16 Data analysis………………………….…………………………………………………16 Results………………………….………………………………………………19 Discussion…………………………………………………………………………20 CHAPTER 4: Intraspecific Support for the Polygyny-vs.-Polyandry Hypothesis in the Bulldog Ant Myrmecia brevinoda…………………………………………21 Abstract…………………………………………………………………………21 Introduction………………………………………………………………………22 Materials and methods…………...………………………………………………25 Insect samples and DNA extraction…………..………………………………………25 Microsatellite genotyping………………………………………………………………25 Statistical analyses……………….……………………………………………………26 Results……………………………………………………………………………29 Basic population genetics and identification of colony boundaries….….….……29 Queen mating frequency and paternity skew……….…………….…………………31 Intracolonial relatedness………….…….…….….……………………………………31 Number of queens and maternity skew……………….………………………………33 Polygyny vs. polyandry…………………………………………………………………33 Discussion…………………………………………………………………………33 Queen number, mating frequency and dispersal……………………………………33.
(5) Polygyny vs. polyandry…………………………………………………………………36 CHAPTER 5: Nestmate Recognition in the Facultatively Polygynous Bulldog Ant Myrmecia brevinoda…………………………………………………………………39 Abstract…………………………………………………………………………39 Introduction………………………………………………………………………40 Materials and methods…………………………………………………………42 Ant sampling……………….….…………………………………………………………42 Behavioural assays……………..………………………………………………………43 Statistical analyses………………….…….….…………………………………………44 Results…………………….………………………………………………………45 Discussion…………………………………………………………………………49 CHAPTER 6: Colony Genetic Structure in the Australian Jumper Ant Myrmecia pilosula…………………………….…………………………………………………52 Abstract…………………….……………………………………………………52 Introduction………………………………………………………………………53 Materials and methods…………………………………………………………55 Field sampling, DNA extraction and microsatellite genotyping…………………55 Marker evaluation and population genetic estimates………………………………57 Estimation of relatedness………………………………………………………………58 Queen numbers, queen-mating frequencies and reproductive skew…….….….…58 Results………………………….………….………………………………………59 Basic population genetics and identification of colony boundaries….…….….…59 Queen mating frequency and paternity skew……….……….………………………61 Intracolonial relatedness………………………………………………………………61 Number of queens and maternity skew……….………………………………………63.
(6) Polygyny vs. polyandry…………………………………………………………………63 Discussion…………………………………………………………………………63 Queen-mating frequency and dispersal………………………………………………63 Polygyny vs. polyandry…………………………………………………………………66 CHAPTER 7: General Discussion…………………………………………………68 Summary of key findings……….…….…………………………………………68 Polygyny vs. polyandry…………………………………………………………………68 Queen dispersal and colony foundation….…….……………………………………69 Nestmate recognition…….………….….………………………………………………69 Future directions…………………………………………………………………70 REFERENCES……………………………………………………………………73 APPENDICES………………………………………………………………………94 Appendix I: AI-based internest aggression matrix in M. brevinoda…….……94 Appendix II: MAI-based internest aggression matrix in M. brevinoda………95 Appendix III: MAS-based internest aggression matrix in M. brevinoda….…96.
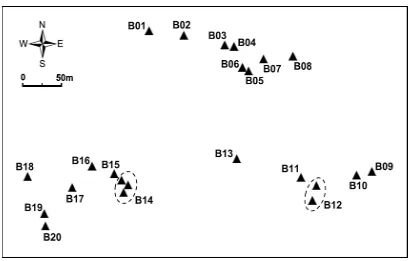
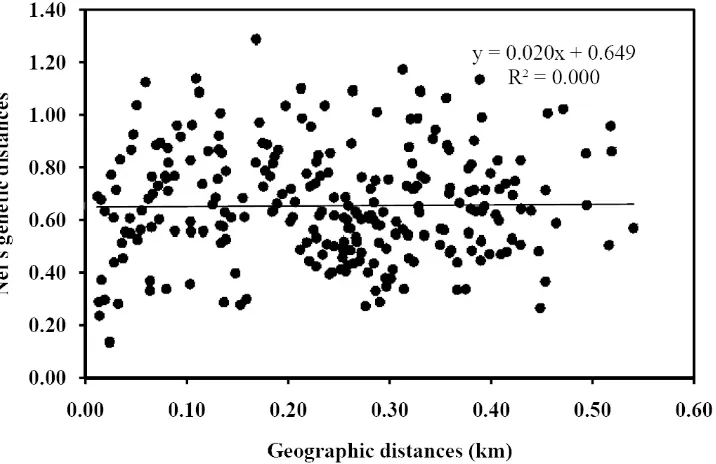
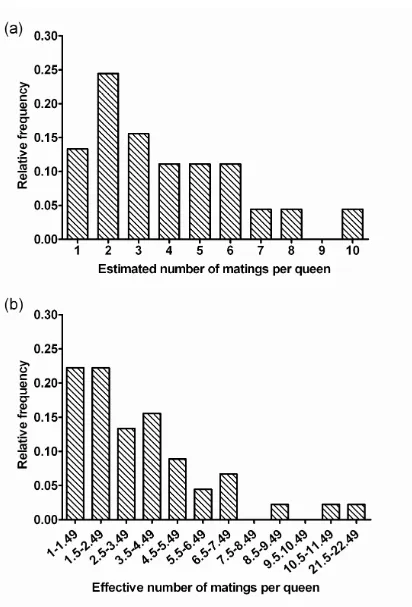
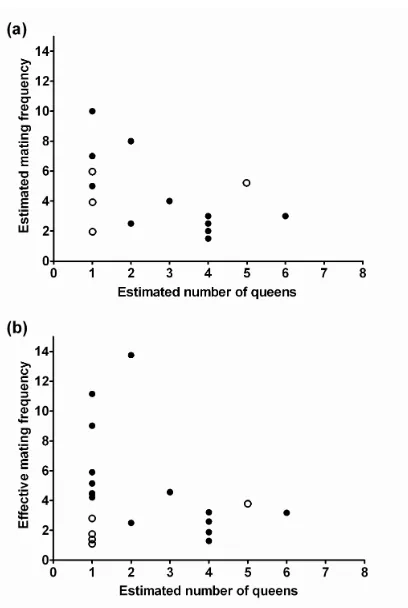
(7) LIST OF FIGURES. Chapter 4 Fig. 4.1 Schematic map of Myrmecia brevinoda colonies…………..………………25 Fig. 4.2 Correlation between geographic and genetic distances for pairs of Myrmecia brevinoda nests (r = 0.013, P = 0.420; 9999 permutations) ….….…………28 Fig. 4.3 Estimated (a) and pedigree-effective (b) number of matings per queen in Myrmecia brevinoda…………………………….………….………………30 Fig. 4.4 The relationship across colonies of Myrmecia brevinoda between polygyny, measured as the number of queens per colony, and polyandry, measured as the mean estimated (a) or pedigree-effective (b) number of matings per queen……………………….………….……………………………………32 Chapter 5 Fig. 5.1 Schematic map of Myrmecia brevinoda colonies…….………….….………42 Fig. 5.2 Mantel’s correlations among internest distance and aggression matrices…46 Fig. 5.3 Observed within- (a) and between-nest (b) aggression levels in Myrmecia brevinoda……………………………………………………………………47 Chapter 6 Fig. 6.1 Schematic map of Myrmecia pilosula colonies……….……….……………55 Fig. 6.2 Correlation between geographic and FST genetic distances for pairs of Myrmecia pilosula nests (r = 0.324, P = 0.046; 9999 permutations)………60 Fig. 6.3 Correlation between geographic and FST genetic distances for pairs of Myrmecia pilosula nests (r = 0.403, P = 0.040, 9999 permutations)………60 Fig. 6.4 Estimated (a) and pedigree-effective (b) number of matings per queen in Myrmecia pilosula….……….………….………….………….……………62 i.
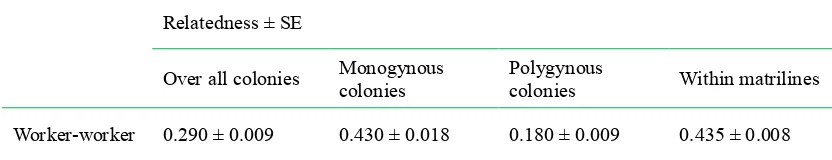
(8) LIST OF TABLES. Chapter 2 Table 2.1 Characterization of 12 polymorphic EST-derived microsatellite loci in Solenopsis invicta (n = 24).……..…………….….………………………8 Table 2.2 Cross-taxa amplification of EST-derived microsatellite loci in distantly -related species………….……………………….………………………11 Chapter 3 Table 3.1 Characterization of polymorphic microsatellite loci in M. brevinoda and M. pilosula, and amplifiability in M. pyriformis……………………………17 Table 3.2 Transferability and utility of candidate microsatellite loci in M. brevinoda and M. pilosula…………………..………………………………………19 Chapter 4 Table 4.1 Characteristics of the colonies used to study colony genetic structure in Myrmecia brevinoda…………….….……………………………………24 Table 4.2 Relatedness among workers in the colonies of Myrmecia brevinoda…..…29 Chapter 5 Table 5.1 Aggression scale used to score interactions among workers of Myrmecia brevinoda……………………..……….…………………………………43 Table 5.2 Mantel’s correlations among internest distance and aggression matrices…45 Table 5.3 Pairwise comparisons of internest aggression levels among various social form combinations using two-tailed independent-samples t-tests….……48 Table 5.4 Pairwise comparisons of internest aggression levels among nests with different levels of worker-worker relatedness using two-tailed independent-samples t-tests……………………………………………48 Chapter 6 Table 6.1 Characteristics of the colonies used to study colony genetic structure in Myrmecia pilosula………………….……………………………………56 ii.
(9) ACKNOWLEDGEMENTS. Many people and organizations have provided valuable assistance during my PhD candidature. In particular, I wish to express my sincere gratitude to: My supervisors Prof. Ross H. Crozier, A/Prof. Simon K. A. Robson, Dr. Helge Schlüns, Prof. Birgit C. Schlick-Steiner and Dr. Florian M. Steiner for their continuous guidance, advice and encouragement. Without their patient supervision, the completion of this thesis would have been impossible. Ching Crozier for her assistance in sample collection and her technical guidance in the laboratory. Your rich knowledge of molecular biology has left me a deep impression. All other members of the Crozier lab over the years, especially Ellen Schlüns, Faye Christidis, Itzel Zamora-Vilchis, F. Sara Ceccarelli, Philip S. Newey and Melissa E. Carew, for their valuable help and friendly advice. Working with you has been a pleasant and inspiring experience. The Department of Education, Employment and Workplace Relations (Australia) for financial support to cover tuition fees and living expenses during my PhD candidature. The School of Tropical Biology at James Cook University and the Australian Research Council (ARC) for financial support to cover costs associated with the research. Hui Cao and Yuxin Fu for their assistance in field survey and sample collection. Dr. Robert W. Taylor for his assistance in sample collection and identification. Ainsley Calladine for his assistance in microsatellite genotyping. Staff at the School of Marine and Tropical Biology (JCU) for their general daily support. Two examiners for their critical comments and constructive suggestions on the earlier version of this thesis. My wonderful family for their unconditional love and understanding during these years. iii.
(10) CONTRIBUTIONS OF OTHERS. People and organizations, who have substantially contributed to the major chapters of this thesis, have been acknowledged in details in the following table. Chapters. 2. 3. 4. 5. 6. Idea. ZQ. ZQ, RC. ZQ, RC. ZQ, RC. Study design. ZQ. ZQ, FC, MC, RC ZQ, FC, MC. ZQ, RC. ZQ, RC. Sample collection. ZQ, RC, CC. ZQ, RC, CC. ZQ, YF. ZQ, RC, BS, FS ZQ, YF. Data collection. ZQ, CC. ZQ, FC, MC. ZQ. ZQ. ZQ. Data analyses. ZQ, RC. ZQ. ZQ, SR. ZQ, SR. ZQ. Manuscript preparation. ZQ, RC, BS, FS. ZQ, FC, MC, BS, FS, HS. ZQ, BS, ES, FS, HS, SR. ZQ, BS, ES, FS, HS, SR. ZQ, BS, ES, FS, HS, SR. Financial support. ARC, DEEWR, SMTB. ARC, DEEWR, SMTB. ARC, DEEWR, SMTB. ARC, DEEWR, SMTB. ARC, DEEWR, SMTB. RC, CC. BS = Birgit C. Schlick-Steiner; CC = Ching Crozier; ES = Ellen A. Schlüns; FC = F. Sara Ceccarelli; FS = Florian M. Steiner; HS = Helge Schlüns; MC = Melissa E. Carew; RC = Ross H. Crozier; SR = Simon K. A. Robson; YF = Yuxin Fu; ZQ = Zengqiang Qian ARC = Australian Research Council; DEEWR = the Department of Education, Employment and Workplace Relations, Australia; SMTB = School of Marine and Tropical Biology, James Cook University. Supervised by: Prof. Ross H. Crozier, James Cook University (Australia) Assoc./Prof. Simon K. A. Robson, James Cook University (Australia) Dr. Helge Schlüns, James Cook University (Australia) Prof. Birgit C. Schlick-Steiner, University of Innsbruck (Austria) Dr. Florian M. Steiner, University of Innsbruck (Austria) iv.
(11) PUBLICATIONS ARISING FROM THIS THESIS. Peer-reviewed journal articles: Qian Z-Q, Crozier YC, Schlick-Steiner BC, Steiner FM, Crozier RH (2009) Characterization of expressed sequence tag (EST)-derived microsatellite loci in the fire ant Solenopsis invicta (Hymenoptera: Formicidae). Conservation Genetics, 10, 1373-1376. Qian Z-Q, Ceccarelli FS, Carew ME, Schlüns H, Schlick-Steiner BC, Steiner FM (2011) Characterization of polymorphic microsatellites in the giant bulldog ant, Myrmecia brevinoda and the jumper ant, M. pilosula. Journal of Insect Science, 11, 71. Qian Z-Q, Schlüns H, Schlick-Steiner BC, Steiner FM, Robson SKA, Schlüns EA, Crozier RH (2011) Intraspecific support for the polygyny-vs.-polyandry hypothesis in the bulldog ant Myrmecia brevinoda. Molecular Ecology, 20, 3681-3691. Qian Z-Q, Robson SKA, Steiner FM, Schlick-Steiner BC, Schlüns EA, Schlüns H, Crozier RH (2011) Intraspecific aggression in the facultatively polygynous bulldog ant Myrmecia brevinoda, 20, 3681-3691. Qian Z-Q, Schlick-Steiner BC, Steiner FM, Robson SKA, Schlüns H, Schlüns EA, Crozier RH (2012) Colony genetic structure in the Australian jumper ant Myrmecia pilosula. Insectes Sociaux, 59, 109-117. Conference abstract: Qian Z-Q, Robson SKA, Schlüns H, Schlüns EA, Schlick-Steiner BC, Steiner FM, Crozier RH (2010) Colony structure in three species of the ant genus Myrmecia. XVI Congress of the International Union for the Study of Social Insects, Copenhagen, Denmark.. v.
(12) ABSTRACT. Eusocial insects vary significantly in colony queen number and mating frequency, resulting in a wide range of social structures. Detailed studies of colony genetic structure are essential to elucidate how various factors affect the relatedness and the sociogenetic organization of colonies. The polygyny-vs.-polyandry hypothesis argues that polygyny and polyandry should be negatively associated since both can result in increased intracolonial genetic variability and have costs. However, evidence for this long-debated hypothesis has been lacking at the intraspecific level. Ants of the genus Myrmecia Fabricius display many ancestral biological traits, and thus are considered valuable in investigating the origin and evolution of more derived social behaviors, life histories and morphologies as found in other ants. In this research, a set of highly polymorphic microsatellite loci were developed, and employed to determine fine-scale sociogenetic organizations in two species of this genus, i.e., the bulldog ant M. brevinoda and the jumper ant M. pilosula. The polygyny-vs.-polyandry hypothesis was also examined using both cases. In addition, I evaluated nestmate recognition in M. brevinoda using behavioural assays, and investigated the impacts of colony social structure, genetic and spatial distances on recognition and aggression. M. brevinoda is facultatively polygynous and polyandrous. The numbers of queens per colony varied from 1 to 6, and queens were inferred to mate with 1 to 10 males. Nestmate queens within polygynous colonies were on average related, but the overall relatedness between queens and their mates was indistinguishable from zero. A lack of genetic isolation by distance among nests indicated the prevalence of independent colony foundation. In accordance with the polygyny-vs.-polyandry hypothesis, the number of queens per colony was significantly negatively associated with the estimated number of matings (Spearman rank correlation R = -0.490, P = 0.028). This study thus provides the rare intraspecific evidence for the polygyny-vs.-polyandry hypothesis.. vi.
(13) Workers of M. brevinoda were always non-aggressive towards nestmates, but acted either aggressively or non-aggressively towards alien conspecifics, suggesting that they are generally able to discriminate between nestmates and non-nestmates. Mantel tests revealed no significant impact of genetic and spatial distances on nestmate discrimination. Moreover, the data appear to lend no support to the hypothesis that colony social structure (queen number) variation significantly affects nestmate recognition and aggression. Thus, the actual mechanism underlying nestmate recognition in this species remains to be resolved. M. pilosula is also facultatively polygynous and polyandrous. The number of queens per colony ranged from 1 to 4, and queens were inferred to mate with 1-9 males. Nestmate queens within polygynous colonies, and queens and their mates, were generally unrelated. This is the first time that the rare co-occurrence of polygyny and high polyandry has been found in the M. pilosula species group. The isolation-by-distance pattern and the occurrence of polygynous polydomy suggest the occurrence of dependent colony foundation in M. pilosula; however, independent colony foundation may co-occur since queens of this species have fully developed wings and can fly. There is no support for the predicted negative association between polygyny and polyandry in ants. Combining the support from the case of M. brevinoda and the rejective evidence from the case of M. pilosula and other intraspecific studies, I suggest that the high costs of multiple matings and the strong effect of multiple matings on intracolonial genetic diversity may be essential to the negative association between polygyny and polyandry, and that any attempt to empirically test this hypothesis should place emphasis upon these two key underlying aspects.. vii.
(14) CHAPTER 1: General Introduction. Background Colony structure of eusocial insects Knowledge of sociogenetic organization is fundamental to understand the evolution of insect eusociality (Seppä & Walin 1996), in which close relatedness has long been considered as a critical factor (Abbot et al. 2011; Hamilton 1964; Hughes et al. 2008a). In eusocial Hymenoptera, colony structure is defined demographically and genealogically by the numbers and identities of reproductive females and males, and spatially by the nest number, size and architecture (Steiner et al. 2009). The former class of factors, i.e., colony queen number, queen mating frequency, relatedness among reproductives and their relative contributions to the worker brood (reproductive skew), together determine the degree of intracolonial relatedness. Both the occurrence of multiple queens (polygyny) and multiple paternity (polyandry) decrease the intracolonial relatedness, while mating among sibs increases relatedness between the workers and the brood they rear (Thurin et al. 2011). Colony queen number and queen-mating frequency are the most important determinants of colony structure in eusocial insects. Eusocial insect colonies with the simplest relatedness structure are headed by a single, once-mated queen, which is considered ancestral in the evolution of insect eusociality (Hughes et al. 2008a). However, polygyny and polyandry are not rare at all, especially in ants (reviewed by Baer 2011; Crozier & Pamilo 1996; Keller & Reeve 1994; Schmid-Hempel & Crozier 1999). As estimated from the dataset of Hughes et al. (2008b), 41.54% and 44.62% of formicid species show some level of polygyny and polyandry, respectively. Even so, the co-occurrence of polygyny and high levels of polyandry appears to be rare, since the lattter have thus far been mostly known from a few genera with strictly monogynous colonies, such as the honey bee (Apis) (Page 1980; Palmer & Oldroyd 2000; Schlüns et al. 2005b; Schlüns et al. 2005a; Tarpy et al. 2004), army ants 1.
(15) (Dorylus and Eciton) (Denny et al. 2004; Kronauer et al. 2004), harvester ants (Pogonomyrmex) (Rheindt et al. 2004; Wiernasz et al. 2004), and the leaf-cutting ants (Atta and Acromyrmex) (Sumner et al. 2004; Villesen et al. 2002). The relationship between colony queen number and queen-mating frequency is one of the major issues in the evolution of multiple matings in eusocial insects, and has long been the focus of much attention in evolutionary biology. On the one hand, polygyny undermines a queen’s individual fitness by sharing her colony’s reproductive output with other queens, while polyandry involves increased energetic loss, higher risk of predation and/or sexually transmitted diseases (reviewed by Hughes et al. 2008b). On the other hand, both polygyny and polyandry can result in increased intracolonial genetic diversity which has been hypothesized to increase the resistance of colonies to pathogens or diseases, to enhance the expression of genetically-based caste systems, to reduce the among-colony variance of diploid male production, and to alleviate genetic drift and inbreeding within local populations (reviewed by Crozier & Fjerdingstad 2001). The polygyny-vs.-polyandry hypothesis argues that polygyny and polyandry should be negatively associated since both have benefits and costs (Keller & Reeve 1994). Despite being supported by two recent comparative analyses across species (Hughes et al. 2008b; Kronauer & Boomsma 2007), to my knowledge, this hypothesis has so far gained no empirical support at the intraspecific level (Bekkevold et al. 1999; Chapuisat 1998; Hammond et al. 2001; Kellner et al. 2007; Pedersen & Boomsma 1999b; Schlüns et al. 2009; Trontti et al. 2005). One reason for this may be that the variation in queen-mating frequency is frequently limited in association with that of colony queen number (Hughes et al. 2008b). During the past decades, the developments of various molecular marker systems and statistical tools have greatly advanced the study of social structure in eusocial insects. Microsallites, also known as simple sequence repeats (SSRs), have become the de facto standard tool for analyzing fine-scale sociogenetic organizations because of their hypervariability and good reproducibility, and have been widely applied to 2.
(16) diverse eusocial insect taxa (e.g., Lucas et al. 2011; Sanetra 2011; Schlüns et al. 2009; Thurin et al. 2011). The study of social structure in eusocial insects has also been greatly facilitated by the recent developments of various statistical tools, e.g., MateSoft v1.0 (Moilanen et al. 2004), Curve v3.0 (Kalinowski et al. 2007) and COLONY v2.0 (Jones & Wang 2010; Wang & Santure 2009). The Australian bulldog or jumper ant genus Myrmecia Fabricius Ants of the genus Myrmecia Fabricius, colloquially known as bulldog and jumper ants, are, together with the monotypic genus Nothomyrmecia Clark, the only extant representatives of the formicid subfamily Myrmeciinae. This genus comprises nine recognized species groups and 90 described species, all of which are restricted to the Australian zoogeographic region (Bolton et al. 2007; Hasegawa & Crozier 2006; Ogata 1991). Although they were for a long time thought to be among the most basal formicids (Ogata 1991), this status has been rigorously rejected by recent phylogenetic studies (Brady et al. 2006; Moreau et al. 2006; Moreau 2009; Rabeling et al. 2008; Ward & Brady 2003). However, these ants display many biological traits that are considered to be ancestral in the family Formicidae. These include, for instance, the limited queen-worker divergence (Dietemann et al. 2004), the solitary foraging behaviour using primarily visual and tactile cues (Hölldobler & Wilson 1990; Haskins & Haskins 1950), and its apparent inability to communicate stimuli among individuals (Haskins & Haskins 1950). In addition, this genus has long been considered as representing the most generalized form of independent colony foundation (ICF) (reviewed by Dumpert 1981), which is also widely believed to be ancestral in ants (Peeters & Molet 2009). From studies of the social organization of Myrmecia ants, one can hope to learn more about the early stages of formicid social evolution (Heinze 2008). However, to my knowledge, only a very few reports have dealt with this aspect (Craig & Crozier 1979; Sanetra 2011). Using one polymorphic allozyme locus, Craig & Crozier (1979) investigated the colony genetic structure in an unknown species of the jumper ant M. 3.
(17) pilosula complex, and indicated the occurrence of multiple related functional queens in single colonies. But largely due to the low resolution of the single allozyme locus, no further details were made available about the other aspects of that species’ colony structure. Recently, Sanetra (2011) reported polygyny and high levels of polyadnry in the bulldog ant M. pyriformis by analyzing variation at five microsatellite loci. This research focuses on two species of this genus, i.e., the bulldog ant M. brevinoda and the jumper ant M. pilosula. M. brevinoda, one of the larger species of Myrmecia, belongs to the M. gulosa species group, while M. pilosula is among the smaller species and belongs to the M. pilosula species group (Hasegawa & Crozier 2006). Thus, they are relatively distantly related in phylogeny, and are good representatives of the genus Myrmecia. Objectives and outline of the thesis The specific objectives of this thesis were: (i) to develop polymorphic microsatellite loci for genetic assays of population and colony structure of Myrmecia ants; (ii) to examine the colony genetic structure in M. brevinoda and M. pilosula; (iii) to test the relationship between colony queen number and queen-mating frequency using both cases; (iv) to evaluate nestmate recognition in M. brevinoda; and (v) to investigate the impacts of colony social structure (queen number), intracolonial worker-worker relatedness, genetic and spatial distances on recognition and aggression in M. brevinoda. This thesis is organized as a series of stand-alone, but conceptually interconnected research papers. In Chapter 2, I characterized a set of polymorphic microsatellites from publicly 4.
(18) available expressed sequence tags (ESTs) of the fire ant Solenopsis invicta, and evaluated their cross-transferability in M. brevinoda. In Chapter 3, I characterized a set of genomic microsatellites from Myrmecia ants. These microsatellites were evaluated for their utility in M. brevinoda and M. pilosula, and for their amplifiability in M. pyriformis. In Chapter 4, I investigated the colony genetic structure in M. brevinoda using the novel microsatellite markers. A total of 20 colonies (23 nests) from a population in Paluma (Queensland, Australia) were examined for colony queen number, queen-mating frequency, reproductive skew, relatedness among reproductives and the mode of colony foundation. The polygyny-vs.-polyandry hypothesis was also tested using the present case. In Chapter 5, I evaluated nestmate recognition in M. brevinoda. A total of nine nests, whose social structure had been determined in Chapter 4, were behaviourally assayed for their pairwise internest aggression. I also examined the impacts of colony social structure (queen number), intracolonial worker-worker relatedness, genetic and spatial distances on recognition and aggression. In Chapter 6, I investigated the fine-scale sociogenetic organization of 14 colonies (16 nests) of M. pilosula. These samples had been sampled from a population in Mongarlowe (New South Wales, Australia). The polygyny-vs.-polyandry hypothesis was also tested using the present case. In Chapter 7, I presented a general discussion of the major findings in this research, and suggested the directions for future research.. 5.
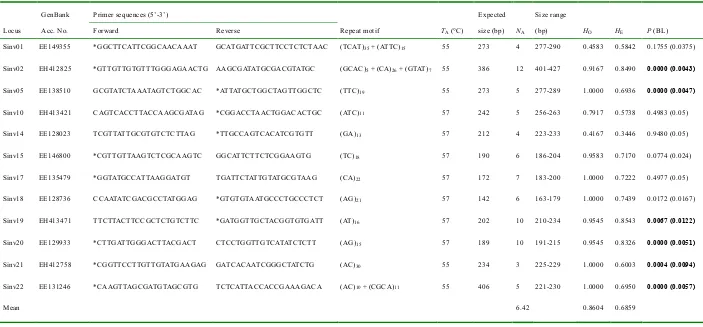
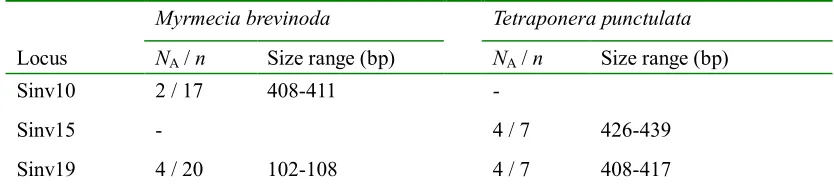
(19) CHAPTER 2: Polymorphic EST-Derived Microsatellites in the Fire Ant Solenopsis invicta and Their Cross-Taxa Transferability in the Bulldog Ant Myrmecia brevinoda and the Black Tree Ant Tetraponera punctulata. Abstract The fire ant Solenopsis invicta (Myrmecinae) has received considerable attention as a damaging invasive pest. In the present study, 12 polymorphic microsatellite loci were developed from publicly available expressed sequence tags (ESTs) of S. invicta. The number of alleles varied between 3 and 12, with an average of 6.42 per locus. The observed and expected heterozygosities ranged from 0.4167 to 1.0000 and from 0.3446 to 0.8543, respectively. These loci were evaluated for their cross-subfamilial transferability in the bulldog ant Myrmecia brevinoda (Myrmeciinae) and the black tree ant Tetraponera punctulata (Pseudomyrmecinae); two loci were successfully amplified for each of these species, with both proving polymorphic. These informative EST-derived microsatellite loci provide a powerful complementary tool for genetic studies of S. invicta.. 6.
(20) Introduction Solenopsis invicta (Myrmicinae), the red imported fire ant (RIFA), is native to South America (Tschinkel 2006) but is invasive and highly damaging both economically (Pimentel et al. 2000) and to the biota (Allen et al. 2001; Wojcik et al. 2001). It has become established in North America (Callcott & Collins 1996), New Zealand (Pascoe 2002), Australia (Henshaw et al. 2005) and China (Du et al. 2007). This species has two distinct social forms, i.e., the monogyne (single-queen) form and the polygyne (multiple-queen) form, and thus is an ideal model for investigating the colony- and population-level genetic consequences of variation in social organization (Krieger et al. 1999). It has also been reported that genetic changes during or subsequent to introduction have caused alterations in social behaviour and colony structure in S. invicta, which in turn promotes the invasive success of introduced populations (Tsutsui & Suarez 2003). So, a good knowledge of its population genetics is of great importance for the formulation of effective strategies in preventing its spread and eradicating its existing populations. To date, both dominant random amplified polymorphic DNA (RAPD) markers (Shoemaker et al. 1994) and codominant allozyme (Ross et al. 1987a; Ross et al. 1987b) and genomic microsatellite (Krieger & Keller 1997) markers have been developed to facilitate genetic studies of S. invicta (Ross et al. 1999). Codominant markers are more informative than their dominant counterparts since two or more alleles can segregate visibly (Miao et al. 2008), and compared to allozymes, microsatellites are more powerful tools because of their higher variability, neutrality, relative abundance and better genome coverage. However, it is well-known that the development of microsatellites from genomic libraries can be costly and time-consuming. In addition, genomic microsatellites are frequently species-specific and have poor cross-taxa transferability (Ellis & Burke 2007). One possible solution to these limitations would be to exploit the publicly available expressed sequence tags (ESTs). EST-derived microsatellites, also known as EST-derived simple sequence repeats (EST-SSRs) or genic microsatellites, provide a time- and cost-efficient method, 7.
(21) Table 2.1 Characterization of 12 polymorphic EST-derived microsatellite loci in Solenopsis invicta (n = 24) GenBank. Primer sequences (5’-3’). Locus. Acc. No.. Forward. Reverse. Repeat motif. TA (°C). size (bp). NA. (bp). HO. HE. P (BL). Sinv01. EE149355. *GGCTTCATTCGGCAACAAAT. GCATGATTCGCTTCCTCTCTAAC. (TCAT)35 + (ATTC)15. 55. 273. 4. 277-290. 0.4583. 0.5842. 0.1755 (0.0375). Sinv02. EH412825. *GTTGTTGTGTTTGGGAGAACTG. AAGCGATATGCGACGTATGC. (GCAC)5 + (CA)26 + (GTAT)7. 55. 386. 12. 401-427. 0.9167. 0.8490. 0.0000 (0.0043). Sinv05. EE138510. GCGTATCTAAATAGTCTGGCAC. *ATTATGCTGGCTAGTTGGCTC. (TTC)19. 55. 273. 5. 277-289. 1.0000. 0.6936. 0.0000 (0.0047). Sinv10. EH413421. CAGTCACCTTACCAAGCGATAG. *CGGACCTAACTGGACACTGC. (ATC)11. 57. 242. 5. 256-263. 0.7917. 0.5738. 0.4983 (0.05). Sinv14. EE128023. TCGTTATTGCGTGTCTCTTAG. *TTGCCAGTCACATCGTGTT. (GA)13. 57. 212. 4. 223-233. 0.4167. 0.3446. 0.9480 (0.05). Sinv15. EE146800. *CGTTGTTAAGTCTCGCAAGTC. GGCATTCTTCTCGGAAGTG. (TC)18. 57. 190. 6. 186-204. 0.9583. 0.7170. 0.0774 (0.024). Sinv17. EE135479. *GGTATGCCATTAAGGATGT. TGATTCTATTGTATGCGTAAG. (CA)22. 57. 172. 7. 183-200. 1.0000. 0.7222. 0.4977 (0.05). Sinv18. EE128736. CCAATATCGACGCCTATGGAG. *GTGTGTAATGCCCTGCCCTCT. (AG)21. 57. 142. 6. 163-179. 1.0000. 0.7439. 0.0172 (0.0167). Sinv19. EH413471. TTCTTACTTCCGCTCTGTCTTC. *GATGGTTGCTACGGTGTGATT. (AT)16. 57. 202. 10. 210-234. 0.9545. 0.8543. 0.0067 (0.0122). Sinv20. EE129933. *CTTGATTGGGACTTACGACT. CTCCTGGTTGTCATATCTCTT. (AG)15. 57. 189. 10. 191-215. 0.9545. 0.8326. 0.0000 (0.0051). Sinv21. EH412758. *CGGTTCCTTGTTGTATGAAGAG. GATCACAATCGGGCTATCTG. (AC)30. 55. 234. 3. 225-229. 1.0000. 0.6003. 0.0004 (0.0094). Sinv22. EE131246. *CAAGTTAGCGATGTAGCGTG. TCTCATTACCACCGAAAGACA. (AC)10 + (CGCA)11. 55. 406. 5. 221-230. 1.0000. 0.6950. 0.0000 (0.0057). 0.8604. 0.6859. Expected. Mean. Size range. 6.42. Fluorolabels with asterisks (*): 5’-GGTGGCGACTCCTGGAG-3’; TA, annealing temperature (°C); NA, number of alleles; HO, observed heterozygosity; HE, expected heterozygosity; P, Chi-square P-value for Hardy-Weinberg equilibrium test; BL, FDR threshold from the FDR controlling procedure of Benjamini & Liu (1999); n, number of individuals assayed. Loci with significant deviations from HWE are denoted in bold.. 8.
(22) and have found wide applications in analyses of functional diversity, genetic mapping, marker-assisted selection in crop species and population genetic analyses (Ellis & Burke 2007; Varshney et al. 2005). Despite their relatively lower variability, EST-SSRs are also well documented to be more widely transferable across species, and even genera (Ellis & Burke 2007), and thus can be a good complement to the traditional ‘anonymous’ microsatellites. In this study, I developed 12 novel polymorphic microsatellite markers from the EST sequences of S. invicta (Wang et al. 2007). Their cross-taxa transferability was also tested in two distantly-related species, the bulldog ant Myrmecia brevinoda (Myrmeciinae) and the black tree ant Tetraponera punctulata (Pseudomyrmecinae). Materials and methods Primer design A total of 22876 ESTs of S. invicta were retrieved from GenBank, and used to perform the contig assembly using Sequencher v4.5 (Gene Codes Corporation, USA) (Minimum overlap: 40; Minimum match: 85%). In all, 12191 unigenes, comprising 4677 contigs and 7514 singletons, were obtained and screened for the SSR-containing unigenes using SciRoKo v3.3 (Kofler et al. 2007). The parameters were set for detection of mono-, di-, tri-, tetra-, penta- and hexanucleotide motifs with a minimum of 14, 7, 5, 4, 4 and 4 repeats, respectively (under perfect MISA search mode). A total of 1112 microsatellite loci were identified, and 23 SSR-containing unigenes were selected for marker development. Primers flanking each repeat sequence were designed using Oligo v6 (Molecular Biology Insights, USA). Either forward or reverse primer of each locus was synthesized with a 5’-end 17-base tag to enable the labelling strategy of Shimizu et al. (2002) (Table 2.1). PCR amplification and genotyping analysis Genomic DNA samples of S. invicta used in this study were obtained from a previous study (Henshaw et al. 2005). Totally, 24 workers (either polygyne or monogyne form) 9.
(23) were randomly sampled from two populations. DNA samples of M. brevinoda and T. punctulata were extracted with PUREGENE DNA Isolation Kit (Gentra Systems, USA) following the manufacturer’s protocol. Polymerase chain reaction (PCR) was performed in a 15-μL reaction volume containing 1x PCR buffer, ~75 ng of genomic DNA, 1.5 mM MgCl2, 0.2 mM each of dNTPs, 0.3 U Taq polymerase (Invitrogen Life Technologies,. USA),. 0.4. μM. universal. fluorescent. primer. (GGTGGCGACTCCTGGAG, 5’ labelled with TET, HEX or FAM), 0.1 μM tagged primer and 0.4 μM untagged primer. The amplifications were performed in the thermal cycler GeneAmp PCR System 9700 (PE Applied Biosystems, USA) with the following program: initial denaturation at 94 °C for 3 min; followed by 35 cycles of 94 °C for 30 s, appropriate annealing temperature (see Table 2.1 for details) for 30 s, 72 °C for 45 s; and last synthesis at 72 °C for 7 min. Fluorolabelled PCR products were cleaned by centrifugation through 300 μL of Sephadex G-50 and multiplexed, and ET-400R size standard (Amersham Biosciences, USA) was added before genotyping on MegaBACE 1000. Data analysis The program PowerMarker v3.0 (Liu & Muse 2005) was employed to calculate various parameters: the number of alleles per locus (NA), observed (HO) and expected (HE) heterozygosities, deviation from Hardy-Weinberg equilibrium (HWE) and linkage disequilibrium (LD). For the detection of LD and the deviation from HWE, the false discovery rate (FDR) controlling procedure of Benjamini & Liu (1999) was applied at the significance level of 0.05. Results and discussion Following the discarding of five loci because of poor amplification or multiple bands and another six monomorphic ones (at the 95% criterion), 12 polymorphic loci with clear and interpretable bands were obtained (Table 2.1). These loci yielded a total of 77 alleles, ranging from 3 (Sinv21) to 12 (Sinv02) with an average of 6.42 per locus. The observed and expected heterozygosities ranged from 0.4167 to 1.0000 and from 10.
(24) 0.3446 to 0.8543, respectively. The heterozygosity levels reported were comparable to those previously reported in either monogyne form (HO: 0.333-0.806 ; HE: 0.282-0.782) or polygyne form (HO: 0.300-0.825 ; HE: 0.258-0.776) using seven polymorphic genomic microsatellites (Krieger & Keller 1997). Thus, these EST-SSRs provide a useful complementary tool to the available allozymes and genomic microsatellites. Deviations from HWE were observed in six loci after following the FDR controlling procedure, and significant linkage disequilibrium was detected between six pairs of loci (Sinv05/Sinv10,. Sinv15/Sinv17,. Sinv17/Sinv18,. Sinv18/Sinv19, Sinv20/Sinv21, Sinv21/Sinv22 with Chi-square P-values of 0.006, 0.000, 0.000, 0.0001, 0.001 and 0.000, respectively). The deviation from HWE could be attributed to the presence of null alleles and/or the social and genetic structure of this species (Bay et al. 2007; Ruger et al. 2005), while the observed LD can be explained by the social structure and/or possible recent migration events. Table 2.2 Cross-taxa amplification of EST-derived microsatellite loci in distantly-related species Myrmecia brevinoda. Tetraponera punctulata. Locus. NA / n. Size range (bp). NA / n. Sinv10. 2 / 17. 408-411. -. Sinv15. -. Sinv19. 4 / 20. 102-108. Size range (bp). 4/7. 426-439. 4/7. 408-417. NA, number of alleles; n, number of individuals assayed; –, no amplification; M, monomorphic locus.. I investigated the transferability of these markers using the same conditions as for RIFA (subfamily Myrmicinae) with two distantly-related ants, the bulldog ant M. brevinoda (Myrmeciinae) and the black tree ant T. punctulata (Pseudomyrmecinae). Two loci were successfully amplified for each of these species, with both proving polymorphic (Table 2.2).. 11.
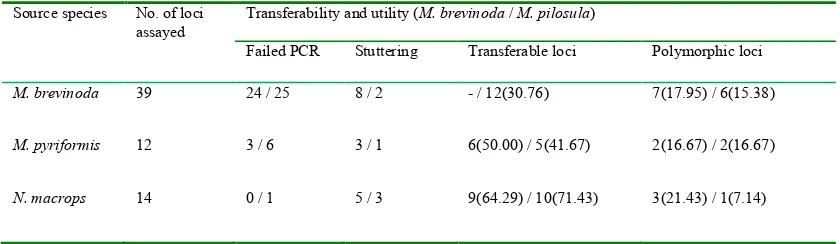
(25) CHAPTER 3: Characterization of Polymorphic Microsatellites in the Giant Bulldog Ant, Myrmecia brevinoda and the Jumper Ant, M. pilosula. Abstract The ant genus Myrmecia Fabricius (Hymenoptera: Formicidae) is endemic to Australia and New Caledonia, and has retained many biological traits that are considered to be basal in the family Formicidae. Here, I present a set of 16 dinucleotide microsatellite loci that are polymorphic in at least one of the two species of the genus, M. brevinoda and M. pilosula, 13 being novel loci and three being loci previously published for the genus Nothomyrmecia Clark (Hymenoptera: Formicidae). In M. brevinoda, the total of 12 polymorphic microsatellites yielded a total of 125 alleles, ranging from 3 to 18 with an average of 10.42 per locus; the observed and expected heterozygosities ranged from 0.4000 to 0.9000 and from 0.5413 to 0.9200, respectively. In M. pilosula, the nine polymorphic loci yielded a total of 67 alleles, ranging from 3 to 12 with an average of 7.44 per locus; the observed and expected heterozygosities ranged from 0.5625 to 0.9375 and from 0.4863 to 0.8711, respectively. Five loci were polymorphic in both target species. In addition, 15 out of the 16 loci were successfully amplified in M. pyriformis. These informative microsatellite loci provide a powerful tool for investigating the population and colony genetic structure of M. brevinoda and M. pilosula, and may also be applicable to a range of congeners considering the relatively distant phylogenetic relatedness between M. pilosula and the other two species within the genus Myrmecia.. 12.
(26) Introduction Studying ‘primitive’ ants has drawn wide attention from myrmecologists and other scientists because it may provide valuable insight into the origin and evolution of more derived social behaviors, life histories and morphologies as found in other ants (Haskins 1970). Ants of the genus Myrmecia Fabricius (Hymenoptera: Formicidae), colloquially known as bulldog and jumper ants, are, together with the monotypic genus. Nothomyrmecia. Clark. (Hymenoptera:. Formicidae),. the only. extant. representatives of the formicid subfamily Myrmeciinae (Hymenoptera: Formicidae). The genus Myrmecia comprises nine recognized species groups and 90 described species, all of which are endemic to Australia with just one of them present in New Caledonia (Bolton et al. 2007; Hasegawa & Crozier 2006; Ogata 1991). Although they were for a long time thought to be among the most basal formicids (Ogata 1991), this status has been rigorously rejected by recent phylogenetic studies (Brady et al. 2006; Moreau et al. 2006; Moreau 2009; Rabeling et al. 2008; Ward & Brady 2003). However, these aggressive ants have retained many biological traits that are considered to be ancestral in the family Formicidae. These include, for instance, the limited queen-worker divergence (Dietemann et al. 2004), the solitary foraging behavior using primarily visual and tactile cues (Hölldobler & Wilson 1990; Haskins & Haskins 1950), and its apparent inability to communicate stimuli among individuals (Haskins & Haskins 1950). From studies of the social organization of Myrmecia ants, one can hope to learn more about the early stages of formicid social evolution (Heinze 2008). A great body of cytogenetic studies have been carried out on the genus Myrmecia (reviewed by Lorite & Palomeque 2010), but to date, the availability of molecular-genetic markers has been poor for this genus. Of 25 isozymes assayed by Craig & Crozier (1979), only one proved polymorphic and useful in M. pilosula. Due to their highly polymorphic and codominant nature, microsatellites have found wide applications in revealing the social structure of social insects (e.g., Schlüns et al. 2009; Wiernasz et al. 2004). Successful cross-taxa amplifications of 11 Nothomyrmecia. 13.
(27) macrops microsatellites in M. forficata were reported, but no details were made available regarding their polymorphisms, heterozygosity, linkage disequilibrium (LD) and deviation from Hardy-Weinberg equilibrium (HWE) (Sanetra & Crozier 2000). Similar transferability was reported for two microsatellites, which were originally designed from the publicly available expressed sequence tags (ESTs) of Solenopsis invicta (Formicidae: Myrmicinae) but successfully amplified in M. brevinoda (see Chapter 2 for details). Here, I present a set of 16 dinucleotide microsatellite loci that are polymorphic in the giant bulldog ant M. brevinoda (from the M. gulosa species group) and/or the jumper ant M. pilosula (from the M. pilosula species group), for the analysis of these ants’ population and colony genetic structure. The set consists of ten novel loci isolated from an enriched genomic library of M. brevinoda, three novel loci isolated from a partial genomic library of M. pyriformis (from the M. gulosa species group), and three loci previously published for the genus Nothomyrmecia. All loci were also examined for their amplifiability in M. pyriformis. Materials and methods Insect samples and DNA extraction Samples of M. brevinoda were collected from a population in Paluma (Queensland, Australia; 19.0206°S / 146.1433°E) in November 2009. Workers of M. pilosula were sampled from a population in Mongarlowe (New South Wales, Australia; 35.4647°S / 149.9381°E) in February 2008. The sampling of M. pyriformis was conducted in the Wildlife Reserve of La Trobe University (Victoria, Australia; 37.7166ºS / 145.0533ºE) in September 1999. Genomic DNA of M. brevinoda and M. pilosula was prepared with PUREGENE DNA Isolation Kit (Gentra Systems, USA) following the manufacturer’s protocol. DNA extraction of M. pyriformis was conducted using a standard phenol chloroform-based method which incorporated an RNase step (Sambrook et al. 1989).. 14.
(28) Microsatellite isolation The isolation of microsatellite loci in M. brevinoda followed the standard protocol for microsatellite-enriched library construction (Bloor et al. 2001). Approximately 6 µg of genomic DNA was cut with the restriction enzyme RsaI (New England BioLabs, USA). Adaptor-ligated DNA fragments ranging in size from 400 to 1000 bp were selected and enriched for (AG)15 repeats using M-280 Dynabeads (Invitrogen, USA). The DNA was then ligated using the pGEM-T vector (Promega, USA) and transformed into JM109 Escherichia coli Competent Cells (Promega, USA) for cloning. 352 clones were picked, of which 96 were selected for sequencing (from 175 shown to have an insert). I then designed primers from 39 sequences using the program OLIGO v4.0 (Molecular Biology Insights, USA). These candidate microsatellite loci were selected based on the availability of flanking regions suitable for primer design. A partial genomic library was constructed for the isolation of microsatellite loci in M. pyriformis. Approximately 2 µg of purified genomic DNA was double digested with restriction enzymes HaeIII and Sau3AI. Digests were run on a 1% agarose gel, and digest products ranging in size from 300 to 800 bp were excised from the gel. Size-selected digest products were then ligated into a BamHI and HincII digested pUC19 vector. Ligations were desalted and transformed into electrocompetent E. coli JM109 cells (Promega). E. coli colonies were grown on LB plates with ampicillin/IPTG/X-Gal media. Colonies were lifted onto N+ hybond membranes. Microsatellite probes (AC)10 and (AG)10 were end-labelled with [c33P] adenosine triphosphate (ATP) and hybridized to membranes overnight at 55ºC. Membranes were exposed to a autoradiograph film, and the film was aligned back to colonies after exposure. Positive colonies were re-screened to confirm their status. Positive clones were sequenced using an fmol sequencing kit (Promega, USA), and 12 primers were designed using OLIGO v4.0. In addition, 14 previously published microsatellites, developed for N. macrops (Sanetra & Crozier 2000), were tested in this study, to check their cross-taxa 15.
(29) transferability and utility in the two target species. The forward primer of each locus was synthesized with a 5’-end 17-base tag to enable the labelling strategy of Shimizu et al. (2002) (Table 3.1). PCR amplification and genotyping analysis In all, 65 microsatellite loci (39 isolated from M. brevinoda; 12 from M. pyriformis; 14 from N. macrops) were assayed against 20 individuals from 20 nests of M. brevinoda and 16 individuals from 16 nests of M. pilosula. The resultant polymorphic loci were also examined for their amplifiability in two individuals from a single nest of M. pyriformis. PCR amplifications were performed in the thermal cycler GeneAmp PCR System 9700 (PE Applied Biosystems, USA), using the following protocol: a final volume of 15 μL containing 1× PCR buffer, ~50 ng of genomic DNA, 1.35 mM MgCl2, 0.2 mM each of dNTPs, 0.3 U Taq polymerase (Invitrogen, USA), 0.4 μM universal fluorescent primer (GGTGGCGACTCCTGGAG, 5’ labelled with TET, HEX or FAM), 0.1 μM tagged primer and 0.4 μM untagged primer. The PCR profile was as follows: initial denaturation at 94 °C for 3 min; followed by 35 cycles of 94°C for 30 s, appropriate annealing temperature (see Table 3.1 for details) for 30 s, 72°C for 45 s, and last synthesis at 72°C for 7 min. Fluorolabelled PCR products were cleaned by centrifugation through 300 μL of Sephadex G-50 and multiplexed, and ET-400R size standard was added before genotyping on MegaBACE 1000 (Amersham Biosciences, USA). Data analysis The program PowerMarker v3.0 (Liu & Muse 2005) was employed to estimate various parameters: the number of alleles per locus (NA), observed (HO) and expected (HE) heterozygosities, deviation from Hardy-Weinberg equilibrium (HWE) and linkage disequilibrium (LD). For the detection of LD and the deviation from HWE, the sequential Bonferroni correction for multiple comparisons was applied at the significance level of 0.05 (Holm 1979). Besides, the possible presence of null alleles was checked using the program Micro-Checker v2.2.3 (van Oosterhout et al. 2004).. 16.
(30) Table 3.1 Characterization of polymorphic microsatellite loci in M. brevinoda and M. pilosula, and amplifiability in M. pyriformis Locus ID. Source species GenBank acc. no.. Primer sequences (5’-3’). Repeat motif. Expected M. brevinoda (n = 20, i = 20) / M. pilosula (n = 16, i = 16) size (bp) TA (ºC) NA Size range (bp) HO HE. Mbre9. M. brevinoda. F: *ACTTTGTGCCGGATGTGAAC. (TC)37. 249. 56 / 55. 18 / 6. 226-308 / 244-256. 0.8500 / 0.6250. 0.9200 / 0.5723. (TC)36. 301. - / 55. -/4. - / 272-286. - / 0.6875. (TC)28. 302. 55 / -. 12 / -. 289-333 / -. (GA)29. 186. - / 55. -/8. - / 156-202. (CT)17GTCC(CT)4 143. 55 / 52. 16 / 1(M) 173-208 / 131. 0.8500 / (M) 0.8975 / (M). (TC)24. 144. 55 / 56. 6 / 11. 144-162 / 181-206. 0.8000 / 0.8125. (TC)39. 290. 50 / 50. 7/3. 266-317 / 249-253. (CT)4C(CT)31. 265. 58 / -. 13 / -. (TC)38TT(TC)4. 247. - / 60. (TC)27. 271. (CT)4TT(CT)2TT (CT)4CG(CT)3. 295. GQ379208. P-value (SB). TA (ºC). PCR. 0.1490 (0.0057) / 0.6570 (0.0170). 55. +. - / 0.5898 - / 0.4400 (0.0064). 55. +. 0.8000 / -. 0.8535 / - 0.1800 (0.0073) / -. 55. +. - / 0.8125. - / 0.7129 - / 0.6010 (0.0127). 55. +. 0.1000 (0.0051) / (M). 60. +. 0.8000 / 0.8652. 0.9020 (0.0500) / 0.3030 (0.0073). 60. +. 0.6000 / 0.5625. 0.7425 / 0.4863. 0.0350 (0.0043) / 1.0000 (0.0500). 50. +. 246-315 / -. 0.7500 / -. 0.8800 / - 0.1540 (0.0064) / -. 60. +. - / 12. - / 272-334. - / 0.8125. - / 0.8652 - / 0.5350 (0.0102). 60. +. 69 / 55. 9 / 1(M). 259-287 / 249. 0.9000 / -. 0.8538 / - 0.6450 (0.0127) / -. 60. +. - / 55. - / 12. - / 330-381. - / 0.9375. - / 0.8711 - / 0.0110 (0.0057). 60. +. R: CTGACAAGCCATAGTTTGTAATG Mbre11. M. brevinoda. GQ379209. F: *CCGTTCTCCGACCGTGTATAATG. M. pyriformis (n = 1, i = 2). R: ACATGCCCAATATGAAGAACGCA Mbre16. M. brevinoda. GQ379210. F: *TCACCTCCCCTCCACTTCC R: TGCTTACTCGCTGAATC. Mbre17. M. brevinoda. GQ379211. F: *ACGAACACCAGGATGCAGC R: GTCTTAACGAGGACTCTTC. Mbre36. M. brevinoda. GQ379212. F: *TTACACGACAGTCTGATAG R: GCCGTGCATCAGCGCCAGC. Mbre40. M. brevinoda. GQ379213. F: *CGTAAAACCGCACACTCGC R: GCGACGATGGTGAAGGGAG. Mbre41. M. brevinoda. GQ379214. F: *CGTTCACAGCGCAAGCAAG R: GTTATAAATTTAATTAGCC. Mbre56. M. brevinoda. GQ379215. F: *TCGTGGGAGTTGCGGGCAG R: GAAGCCGAATAATGATACG. Mbre67. M. brevinoda. GQ379216. F: *ATAGTCAGCCAGGATTCGG R: TGCGAACGTGAAGAGCGAG. Mbre78. M. brevinoda. GQ379217. F: *GTCCAAATTAGCGAACGGC R: AGTCGTTGCTCGGATCGGC. Mpyr22. M. pyriformis. GQ379218. F: *GCACAGGGTCAAAGGGAG R: CTAATCGTTTCTCATCGCAG. 17.
(31) (Continued …) Locus ID. Mpyr38. Mpyr57. Source species. M. pyriformis. M. pyriformis. GenBank acc. no. GQ379219. GQ379220. Primer sequences (5’-3’). Repeat motif. Expected size (bp). M. brevinoda (n = 20, i = 20) / M. pilosula (n = 16, i = 16). M. pyriformis (n = 1, i = 2). TA (ºC). NA. Size range (bp). HO. HE. P-value (SB). TA (ºC). PCR. 260-298 / 317-326. 0.7500 / 0.7500. 0.8150 / 0.6875. 0.5600 (0.0085) / 0.4720 (0.0085). 60. +. 259. 65 / 55. R: CGAAGAATGGAGGCGAAGTG. (GA)8AA(GA)12 AA(GA)3. 12 / 6. F: *GTGTGTACCTGGGGCTGC. (AG)25. 298. 55 / 55. 13 / 1(M). 274-307 / 255. 1.0000 / -. 0.8738 / -. 0.8730 (0.0253) / -. 60. +. 283. 57 / 55. 8/5. 243-289 / 243-257. 0.8000 / 0.8125. 0.7900 / 0.7402. 0.5980 (0.0102) / 0.9520 (0.0253). 60. +. R: GGCGAGGGTTATTTCTTACG. (TC)4TTTG(TC)2 (N)9(TC)11(AC)4T CTT(TC)2. F: *GTTCGTGGCAGCAGTCGG. (CT)23. 126. 50 / -. 8/-. 97-117 / -. 0.8500 / -. 0.8013 / -. 0.8530 (0.0170) / -. -. -. (GA)24. 307. 55 / 55. 3 / 1(M). 309-325 / 313. 0.4000 / -. 0.5413 / -. 0.0490 (0.0047) / -. 60. +. 0.7792 / 0.7569. 0.8141 / 0.7101. F: *TCACCGTTTGTCCTCCTTCAC. R: TTCTCTACCTTTCTCCTTCC Nmac18. Nmac43. N. macrops. N. macrops. AF264866. AF264871. F: *CCAATTCGTGCGTCCCCAT. R: CTCCGTGCTTTCCAGAACG Nmac47. N. macrops. AF264873. F: *GATGTCGTTGGGTTCGTATC R: GAAACTTCGGCAGGGACTC. 10.42 / 7.44. Mean. Fluorolabels with asterisks (*): 5’-GGTGGCGACTCCTGGAG-3’; TA, annealing temperature (°C); N A, number of alleles; HO, observed heterozygosity; HE, expected heterozygosity; P, exact P-value for Hardy-Weinberg equilibrium (HWE) test; SB, sequential Bonferroni threshold at the significance level 0.05; n, number of nests analyzed; i, number of individuals assayed; -, failed amplification or failed genotyping due to stutter bands; M, monomorphic locus. Monomorphic loci were excluded from the calculation of mean values. All loci were examined for their amplifiability in two samples of M. pyriformis (+, successful; -, failed amplification). Loci starting with ‘Nmac’ were previously published by Sanetra & Crozier (2000).. 18.
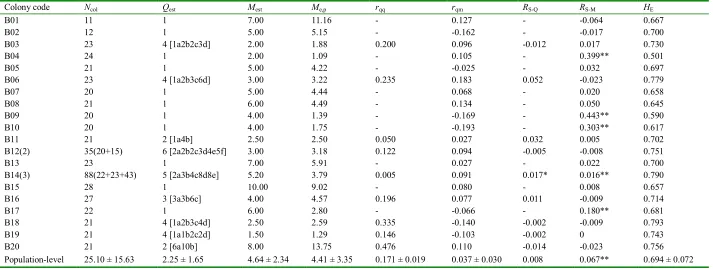
(32) Table 3.2 Transferability and utility of candidate microsatellite loci in M. brevinoda and M. pilosula Source species. No. of loci assayed. Transferability and utility (M. brevinoda / M. pilosula) Failed PCR. Stuttering. Transferable loci. Polymorphic loci. M. brevinoda. 39. 24 / 25. 8/2. - / 12(30.76). 7(17.95) / 6(15.38). M. pyriformis. 12. 3/6. 3/1. 6(50.00) / 5(41.67). 2(16.67) / 2(16.67). N. macrops. 14. 0/1. 5/3. 9(64.29) / 10(71.43). 3(21.43) / 1(7.14). -, not applicable. Transferable loci were loci that could be successfully amplified in another taxon than the one they had been isolated from. Polymorphic loci were a subset of the transferable loci. Both transferable and polymorphic loci are given as absolute numbers followed by % values in parentheses.. Results Forty-nine loci were discarded due to poor amplification, severe stuttering or monomorphism (at the 95% criterion). Sixteen loci (10 isolated from M. brevinoda; 3 from M. pyrifomis; 3 from N. macrops) yielded clear and interpretable peaks and were polymorphic in at least one of the two target species, M. brevinoda and M. pilosula (Table 3.1; Table 3.2). Of these loci, 12 and 9 generated polymorphic products in M. brevinoda and M. pilosula, respectively, with 5 of them proving useful in both species. Notably, 64.29% (9/14) and 71.43% (10/14) of the candidate loci originally isolated from N. macrops were successfully amplified in M. brevinoda and M. pilosula, respectively (Table 3.2). In addition, 15 out of the 16 loci (93.75%) proved amplifiable in M. pyriformis (Table 3.1), the failed locus being one developed for N. macrops. In M. brevinoda, the 12 polymorphic microsatellites yielded a total of 125 alleles, ranging from 3 (Nmac47) to 18 (Mbre9) with an average of 10.42 per locus; the observed and expected heterozygosities ranged from 0.4000 to 0.9000 and from 0.5413 to 0.9200, with an average of 0.7792 and 0.8141, respectively. In M. pilosula, the 9 polymorphic loci generated a total of 67 alleles, ranging from 3 (Mbre41) to 12 (Mbre67 / Mpyr22) with an average of 7.44 per locus; the observed and expected heterozygosities ranged from 0.5625 to 0.9375 and from 0.4863 to 0.8711, with an average of 0.7569 and 0.7101, respectively. Following the sequential Bonferroni correction, no significant deviation from HWE or LD was observed in any of the 16 loci in any of the species. Possible occurrence of null alleles was suggested in one locus (Nmac47) for M. brevinoda, but not in any locus for M. pilosula.. 19.
(33) Discussion In this study, I have collated a set of polymorphic dinucleotide microsatellite loci suitable for population genetic studies of Myrmecia brevinoda and M. pilosula. The levels of heterozygosity reported here were comparable to those previously reported for the consubfamilial dinosaur ant Nothomyrmecia macrops (Myrmeciinae) (Sanetra & Crozier 2000) and one species of the subfamily Ponerinae s.str. (Bolton 2003), which diverged early from other ants (Moreau 2009), i.e., Diacamma cyaneiventre (Ponerinae) (Doums 1999). The heterozygosity levels I found were higher, however, than those for the only other ant from Ponerinae for which microsatellite data are available, i.e., Diacamma ceylonense (Gopinath et al. 2001). The success rates in screening the candidate microsatellites in M. brevinoda and M. pilosula were rather low. Interestingly, those loci originally isolated from N. macrops displayed a high level of cross-generic transferability, which was substantially higher than that reported in the cross-subfamilial transferability of EST-derived microsatellites from Solenopsis invicta (Myrmicinae) to M. brevinoda (16.67%, 2/12) (see Chapter 2 for details). Likely, this reflects the much closer phylogenetic relatedness among the genera of the same subfamily as compared to that of genera from different subfamilies. However, out of the 10 transferable loci, only one proved polymorphic in M. pilosula, in line with the widely held viewpoint that the allelic diversity of transferable microsatellites is closely correlated with the phylogenetic relatedness between the donor and acceptor species (Decroocq et al. 2003). In addition, 15 out of the 16 loci were successfully amplified in M. pyriformis, suggesting the potential applicability in this species. Considering the usefulness of the loci in two different Myrmecia species groups (M. gulosa species group: M. brevinoda, M. pyriformis; M. pilosula species group: M. pilosula), which are relatively distant phylogenetically (Hasegawa & Crozier 2006), the loci may also be applicable to other species groups of the genus. It should be noted that I used constant PCR conditions to evaluate the cross-taxa transferability and utility of these microsatellites in the target species. Further optimization of the PCR protocol might potentially increase the success rate of marker development. These polymorphic loci will be employed to investigate the population and colony genetic structure in M. brevinoda and M. pilosula.. 20.
(34) CHAPTER 4: Intraspecific Support for the Polygyny-vs.-Polyandry Hypothesis in the Bulldog Ant Myrmecia brevinoda. Abstract The number of queens per colony and the number of matings per queen are the most important determinants of the genetic structure of ant colonies, and understanding their interrelationship is essential to the study of social evolution. The polygyny-vs.-polyandry hypothesis argues that polygyny and polyandry should be negatively associated since both can result in increased intracolonial genetic variability and have costs. However, evidence for this long-debated hypothesis has been lacking at the intraspecific level. Here, I investigated the colony genetic structure in the Australian bulldog ant Myrmecia brevinoda. The numbers of queens per colony varied from 1 to 6. Nestmate queens within polygynous colonies were on average related (rqq = 0.171±0.019), but the overall relatedness between queens and their mates was indistinguishable from zero (rqm = 0.037±0.030). Queens were inferred to mate with 1 to 10 males. A lack of genetic isolation by distance among nests indicated the prevalence of independent colony foundation. In accordance with the polygyny-vs.-polyandry hypothesis, the number of queens per colony was significantly negatively associated with the estimated number of matings (Spearman rank correlation R = -0.490, P = 0.028). This study thus provides the rare intraspecific evidence for the polygyny-vs.-polyandry hypothesis. I suggest that the high costs of multiple matings and the strong effect of multiple mating on intracolonial genetic diversity may be essential to the negative association between polygyny and polyandry, and that any attempt to empirically test this hypothesis should place emphasis upon these two key underlying aspects.. 21.
(35) Introduction Eusocial insect colonies with the simplest relatedness structure are headed by a single, once-mated queen, which is considered ancestral in the evolution of insect eusociality (Hughes et al. 2008a). However, multiple queens per colony (polygyny) and multiple paternity (polyandry) are not rare at all, especially in ants (reviewed by Baer 2011; Crozier & Pamilo 1996; Keller & Reeve 1994; Schmid-Hempel & Crozier 1999). As estimated from the dataset of Hughes et al. (2008b), 41.54% and 44.62% of formicid species show some level of polygyny and polyandry, respectively. The number of queens per colony has received significant attention (e.g., Hölldobler & Wilson 1977; Keller 1993, 1995), since it affects the relatedness among colony members and thus the indirect benefits workers gain by helping to raise the brood (Heinze & Keller 2000). It is to a queen’s disadvantage to share the colony with other (especially unrelated) queens due to a decrease in individual reproductive output (i.e., individual fitness), and to the workers’ disadvantage to raise queens that are unrelated (or distantly related) to them (Craig & Crozier 1979). Additional disadvantages proposed for polygyny include an increased energetic burden it imposes on the colony especially during the colony’s early growth, potential for parasitism by queens producing more sexuals and less workers than other queens, and an increased accessibility of the colony and its resources to non-colony members (Bourke & Franks 1995; Buschinger 2009; Elmes 1991; Hölldobler & Wilson 1977) . However, polygyny is thought to be adaptive in situations of environmental stresses such as nest-site limitation or high risks associated with independent colony foundation (Bourke & Franks 1995; Keller 1995). The evolution of polyandry is also a challenging puzzle, and a variety of hypotheses have been proposed (reviewed by Crozier & Fjerdingstad 2001; Trontti et al. 2007). Polyandry, for example, has been associated with extended colony longevity due to an increased lifetime supply of sperm (Cole 1983; Schlüns et al. 2005b), and the convenience polyandry hypothesis proposes that females accept additional copulations due to the higher cost of resistance than that of compliance (Thornhill & Alcock 1983). The most prominent hypotheses to explain polyandry are, however, genetic in nature, i.e., they emphasize the selective benefits of increased genetic variability of offspring. Thus, polyandry has been hypothesized to increase the resistance of colonies to pathogens or diseases, to enhance the expression of. 22.
Figure

+7
Related documents
A motion to approve the proposed ordinance amending Section 94-91 of the Code of Ordinances of the City of McAlester was made by Councilman Smith and seconded by Vice-Mayor
Bend angles measured by phasing analysis for triple helical structures with variable linker sizes at pH 5.5 with oligonucleotides containing 5-methyl C and T. Oligonucleotide
The concern for the customer was also based on law: Under Section 222 of the Communications Act, first passed in 1934, telephone companies are prohibited from giving out
A variable- (also changeable-, electronic-, or dynamic-) message sign, often abbreviated VMS, CMS, or DMS, and in the UK known as a matrix sign, is an electronic traffic
Here, we show for the first time that higher adipsin levels were related to back pain in overweight or obese, otherwise healthy adults, independently of adiposity, which is
If the Femtocell and the network device are not provided by the same service provider, the Femtocell service provider can provide the customer with clear information that without
Their results show the stadium having a negative and statistically significant impact on the age of housing (new housing units were constructed), a positive and
During the treatment phase of the reciprocity condition, the mate of the focal subject had access to the handle of an out-of-reach tray that, when pulled, provided a small food
