80
WAVE PROPAGATION SCATTERING DUE TO DEFECT ON THIN COMPOSITE PLATES
Z. M. Hafizi1, 2, J. Epaarachchi1 and K. T. Lau1
1
Centre of Excellence in Engineered Fiber Composites University of Southern Queensland, Toowoomba QLD 4350, Australia
2
Faculty of Mechanical Engineering, University Malaysia Pahang, 26600 Pekan, Pahang, Malaysia
ABSTRACT
The engineering structures which based on laminated composites, have a high probability of unexpected damage development during services. The damage formations must be monitored from the beginning before it headed towards structural failure which could result in substantial damage. This lead to the necessity of Structural Health Monitoring (SHM) system to be installed during the construction of laminated composite structures. However, an understanding of damage area detection and damage characteristics is essential, before a SHM system can be integrated into the structures. This article presents the effects of propagating wave propagation through an existing damage on composite plates. Theoretically, a propagating wave that started from any source will vary when crossing an area with damage. This study shows a high frequency wave propagation (kHz range) show different reactions when passing through the damaged area, compared with the low frequency wave propagation. Results of the study will lead to good damage detection method, which utilizing the available vibration source; especially for the condition monitoring of thin laminated composite structures.
Keywords: SHM; wave propagation; wavelet analysis; Gl/epoxy composites.
INTRODUCTION
81
structures. Composite materials display a wide variety of failure mechanisms as a result of their complex structure and manufacturing processes, which include fiber failure, matrix cracking, buckling and delamination (Orifici et al. 2008). Damages can develop and propagate very slowly from inside the composite layers (e.g. matrix cracks, delamination and matrix-fiber debonding). As a result, it will affect material properties of the composites, such as, the material strength and the stiffness.
Formation of damage such as matrix cracking sometimes can be seen with the naked eye, however, the damage such as delamination, is a silent killer, in which case, it is almost impossible to detect from the surface of the structure. There are various methods, highlighted by the researchers to identify the damage in the composite structure; particularly for thin laminated composite plates such as the Fiber Bragg gratings, ultrasonic, acousto-ultrasonic, x-ray imaging, and acoustic emission (AE) methods (Kahandawa et al., 2012; Popovics, 2009; Muravin et al., 2010; Lam et al., 2009). However, the passive fault detection system was focused in this study, as it that can be used online, more practical, less equipment and relatively cheaper system. One of the main challenges for a passive system is to create the classifying technique which can evaluate the condition of the examined structures. In other words, passive monitoring must combine with a good signal analysis in order to produce a robust and reliable system. AE technique may suit the need. Despite of the fact that AE usage is highly established for metallic materials, however, there is a huge challenge in detecting the good AE signals that can be correlated to any damage formation and propagation; especially involving composite materials.
This present study highlights a different approach/concept which may be an alternative and more practical in the real application. The idea is, to manipulate the available vibration source in order to identify the existence of damage in thin composite plates. This concept can also be considered as a passive monitoring. Consider a composite structure that is constantly exposed to constant vibration; in any frequency range will produce wave propagation in the structure. For thin plates, this wave propagation is called as the Lamb waves. When the wave propagates through areas with damage, such as matrix cracking or delamination, this wave will change its form and some characteristics, as it is affected by the existence of the damaged area. This article will reveal the results of several experiments that have been carried out on a thin composite sample; in which a small hole has been made to indicate the presence of the damaged area.
EXPERIMENTATION
265 mm × 97 mm × 4.4 mm of Gl/epoxy resin laminates with a stacking sequence of
82
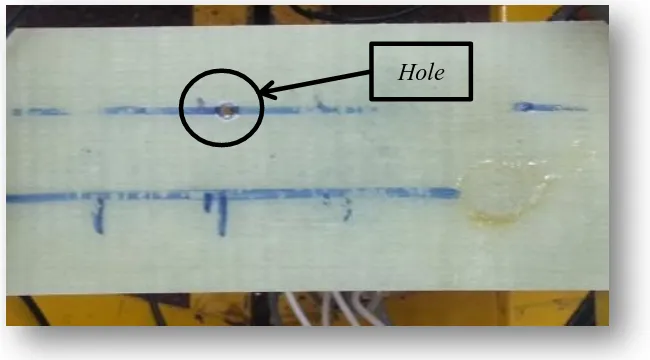
Figure 1. Gl/epoxy resin laminates for the experiments.
High Frequency Case
Figure 2 shows the experimental setup. Two piezoelectric sensors (labeled as number ‘1’ and ‘2’, as shown in Figure 2) were coupled to the surface of the plate. The sensors were individually connected to two PAC AE Node Systems (data acquisition from Physical Acoustic Corporation) for waveform acquisition and were synchronized with the help of AE Win software. The sampling rate for acquisition was set to 1 Mega sample per second and threshold was set to 45 dB.
Figure 2. Set-up for ‘high frequency source’ test.
Point B states the hole’s location. Pencil lead break (PLB) test was done at point A. PLB test was chosen as it can excite high frequency wave propagation, approximately 30 kHz. The signal propagation due to lead breaking will be acquired by both piezoelectric sensors. For this case, sensor ‘2’ captured the signal which propagating across the artificial damage area (hole). Finally, for comparison, the lead breaking was also done at point C; as this area has no damage in between the sensors.
Low Frequency Case
The test arrangement was shown as in Figure 3. Both piezoelectric sensors were connected directly to a digital storage oscilloscope and the sampling rate was set to 100 kHz. An impact with hammer was done at point F in order to excite the low frequency wave propagation on the thin plates. The wave propagated and travelled crossing the
Hole
1 2
A B
C
Composite laminates
Clamped Clamped
[image:3.595.174.464.435.540.2]83
[image:4.595.177.450.155.229.2]sensor. Impacts were repeated at point E and F; where no wave propagation was expected to cross the damage area.
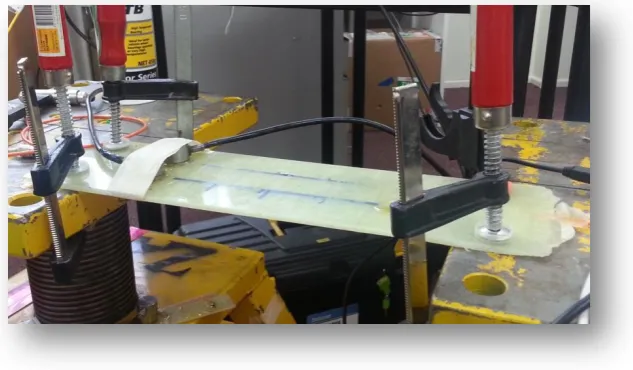
Figure 3. Arrangement for ‘low frequency source’ test.
Figure 4. Specimen prepared before the low frequency impact by hammer.
RESULTS AND DISCUSSION
When a Lamb waves propagate past the damaged area, it will experience a wave scattering. The wave scattering effect due to defect on composite materials, has been discussed theoretically by some researchers. Wave scattering is varied depends on the propagating wave frequency range. Based on several experiments that have been done, the propagation of a high frequency wave experienced a very clear wave scattering, compared with the wave propagation of low frequency range.
High Frequency Case
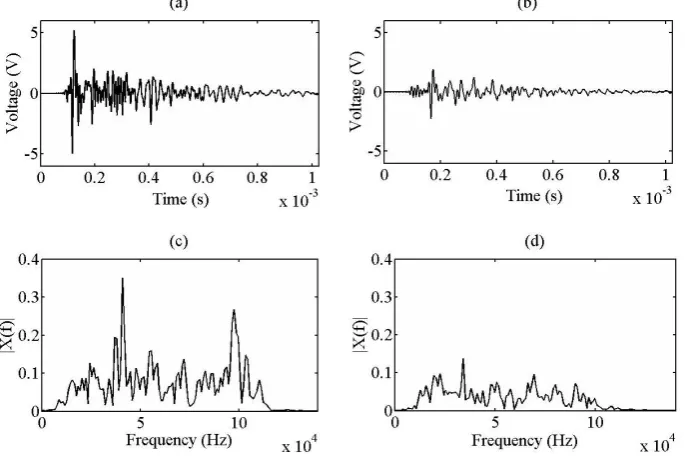
Figure 5 and 6 show the waveform and its respective fast Fourier transform (FFT) of Lamb wave signals due to PLB at point A and C. It is difficult to evaluate the difference between the signals obtained from the two sensors; except an obvious reduction in the signal amplitude and signal energy, which is caused by the effects of attenuation. So too when looking at the results of comparisons of their FFT analysis. Therefore, further analysis is needed to see more clearly the effects of this wave scattering. However, the two major modes of wave propagation still can be observed, which they are always associated with lamb wave propagation; the flexural and extensional modes.
1
2
D B
E
[image:4.595.164.481.272.457.2]84
Figure 5. Response due to PLB at point A; (a) and (c) are from sensor ‘1’, while (b) and (d) are from sensor ‘2’.
Figure 6. Response due to PLB at point D; (a) and (c) are from sensor ‘1’, while (b) and (d) are from sensor ‘2’.
[image:5.595.124.467.379.610.2]85
[image:6.595.117.473.199.460.2]where and the superscript * indicates the complex conjugate. The term ( ) is the basic wavelet. The parameter in Equation 1 stands for the scale of basic wavelet and is related to signal frequency. Meanwhile, the parameter stands for shift or position of basic wavelet and it can be related to the time of the signal. Plotting wavelet transform magnitude on axis gives the time-frequency view of a signal.
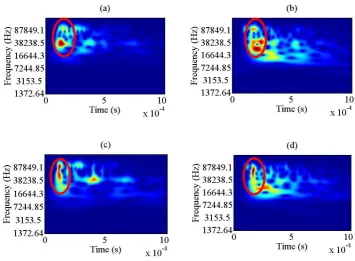
Figure 7. Wavelet analysis of the (a) signal from sensor ‘1’ due to PLB at A; (b) signal from sensor ‘2’ due to PLB at A; (c) signal from sensor ‘1’ due to PLB at C; and (d)
Signal from sensor ‘2’ due to PLB at C.
There are many basic wavelets available and appropriate choice of it will give better result. In this study, Morlet wavelet which is identical to Gabor wavelet (Simonovski and Boltezar, 2003) and has similar shape as an impulse (Lin, 2001) was used. It can be defined as (Simonovski and Boltezar, 2003; Lin, 2001),
(2)
The scale, s can be related with the frequency by this relation,
(3)
86
Now then can be clearly observed, the effect of changes in wave propagation which caused by the presence of the damaged area. The circles in Figure 7 (a, b) indicate the changes of the signal waveform in term of time-frequency analysis due to the existence of the artificial damage. Meanwhile, result in Figure 7 (c, d) show no significant variation.
[image:7.595.179.406.254.522.2]For high-frequency wave propagation (kHz), the overall wave will traverse the existing artificial damage area (hole). This is because the wavelength is very small compared to the size of the hole. As the consequences, this lead to the overall impression of the waves undergoes scattering effect as shown in Figure 7. However, this outcome should not be confused by the wave dispersion and attenuation effect that it always occur when Lamb wave propagate in a thin plate.
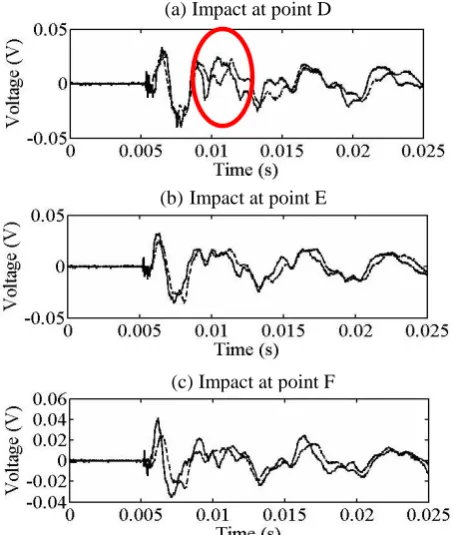
Figure 8. The effect of low frequency wave travelling across the perforated region (indicated by red circle). Two lines in each figures indicated the two waveforms which
captured by two different sensors (sensor ‘1’ and sensor ‘2’).
Low Frequency Case
At the meantime, for low-frequency wave propagation, not the entire wave packet traversed the hole at point B. A part of the propagated wave seems to change a little compared with the wave which propagated without passing the perforated region. After a few test, it can be observed that almost 80 to 90 percent of low frequency wave which travel passing the artificial damage area, will have the changes as stated in the result in Figure 8. Figure 8 (a) shows that, if the impact by hammer was done at point D (refer Figure 3), there is a significant variation of the waveform which captured by sensor ‘1’ and sensor ‘2’; although the waveform actually came from the same source. This situation did not happen if the impact was done at other location (E and F). This is due to none of the source will propagate across the point B (the hole).
(a) Impact at point D
(b)Impact at point E
87
This study has been successfully reported on the effects of wave propagation traverse the defect area. In the case of a real composite structure, propagation may originate from various sources, such as engine vibration and rotation of the ball bearing. This investigation is still in the early stages and is very useful in order to develop an effective monitoring system for composite structures.
ACKNOWLEDGEMENT
The authors would like to thank the Faculty of Engineering and Surveying and the Centre of Excellence in Engineered Fibre Composites, University of Southern Queensland for providing laboratory facilities and financial support. They would also like to thank the Universiti Malaysia Pahang together with the Ministry of Higher Education, Malaysia for scholarship support.
REFERENCES
Chui, C.K. 1992. An introduction to wavelets. San Diego, CA: Academic Press.
Croxford, A.J., Wilcox, P.D., Drinkwater, B.W. and Konstantinidis, G. 2007. Strategies for guided-wave structural health monitoring. Proceedings Royal Society A, 463: 2961–2981.
Diamanti, K. and Soutis, G. 2010. Structural health monitoring techniques for aircraft composites structures. Progress in Aerospace Sciences, 46: 342 - 352.
Hamstad, M.A., O’Gallagher, A. and Gary, J. 2002. A wavelet transform applied to Acoustic Emission Signals: Part 2: Source location. Journal Acoustic Emission, 20: 62-82.
Jingpin, J., Bin, W. and Cunfu, H. 2008. Acoustic emission source location methods using mode and frequency analysis. Struct. Control Health Monit, 15: 642–651. Kahandawa, G.C., Hafizi, Z.M., Epaarachchi, J. and Lau, K. T. 2012. Detecting delamination in a composite structure using an embedded FBG – AE hybrid system. In: 7th Australasian Congress on Applied Mechanics (ACAM 7), 9-12 Dec 2012, Adelaide, Australia.
Lam, P.M., Lau, K.T., Ling, H.Y., Su, Z. and Tamb, H.Y. 2009. Acousto-ultrasonic sensing for delaminated GFRP composites using an embedded FBG sensor. Optics and Lasers in Engineering, 47: 1049–1055.
Lin, J. 2001. Feature extraction of machine sound using wavelet and its application in fault diagnosis. NDT & E International, 34: 25 – 30.
Muravin, B., Muravin, G., Lezvinsky, L. 2010. The Fundamentals of Structural Health Monitoring by the Acoustic Emission Method. Proceedings of the 20th International Acoustic Emission Symposium, November 17-19, Kumamoto, Japan, pp. 253-258.
Orifici, A.C., Herszberg, I. and Thomson, R.S. 2008. Review of methodologies for composite material modeling incorporating failure. Composite Structures 86, 194210.
88
Simonovski, I. and Boltezar, M. 2003. The norms and variance of gabor, morlet and general harmonic wavelet function. Journal of Sound and Vibration, 264: 545 – 557.
Mal, A., Ricci, F., Banerjee, S., and Shih, F. 2005. A Conceptual Structural Health Monitoring System based on Vibration and Wave Propagation. Structural Health Monitoring, 4: 283 – 293.