Counselling for children and young people, 2014/15
(EXPERIMENTAL STATISTICS)
Local authorities in Wales are required to make reasonable provision of independent counselling services for children and young people aged between 11 and 18 and pupils in Year 6 of primary school. Local authorities are required to provide anonymised information about their counselling services to the Welsh Government. The Welsh Government has responsibility for collection of this data and this informs the development of counselling services for children and young people in Wales.
Since 2014 there has been considerable work on guidance and definitions to ensure consistency between authorities, to clarify some known issues, and reflect current policy. For this reason increases or decreases from year to year should be interpreted with caution and are thus published as experimental statistics. The known quality issues are highlighted in the Key Quality Information section and the end of the release.
Key Results for 2014/15
11,567
children or young people received counselling in 2014/15.
School-based staff
was the most common form of referral, accounting for nearly half of all referrals (46%). Females accounted for
64%
or 7,364 of the 11,567 children and young people who received counselling, compared to only 36% of males. The
Year 10
age group had the highest number of children and young people who received counselling, accounting for 22% of all children and young people who received counselling.
Family issues
were the most common form of presenting issue (23%) and predominant issue (24%) for children and young people who received counselling.
89%
of children and young people did not require onward referral after completion of counselling. The average improvement in YP Core score (which is a measure of psychological distress) amongst children and young people who received counselling in Wales was
8.5
.
SDR 18/2016 18 February 2016
Statistician: William Perks Tel: 029 2082 3989 E-mail: school.stats@wales.gsi.gov.uk
All charts and tables below relate to face to face counselling only, with the exception of Chart 4 which provides figures on online counselling that is offered by Cardiff and Powys local authorities.
Chart 1: Number of children and young people who received counselling in Wales
0 2,000 4,000 6,000 8,000 10,000 12,000 14,000
2012/13 2013/14 2014/15
N
u
m
b
e
r
o
f
c
h
ild
re
n
a
n
d
y
o
u
n
g
p
e
o
p
le
w
h
o
r
e
c
e
iv
e
d
c
o
u
n
se
lli
n
g
Year
Data in 2012/13 was collected for each term; therefore the annual figure for the number of children and young people who received counselling may have been overestimated due to double counting, if a child or young person completed episodes of counselling in more than one term. After 2012/13 data were collected based on an annual submission, reducing the likelihood of double counting. Due to this change considerable caution should be used when comparing data between 2012/13 and subsequent years.
11,567 children or young people received counselling services in 2014/15 (please note
comparisons should be treated with considerable caution, as stated in the previous paragraph).
Chart 2: Gender split of children and young people who received counselling in Wales
Males, 4,203 (36%)
Females, 7,364 (64%)
Females accounted for 64% or 7,364 of the 11,567 children and young people who received counsellingin 2014/15, compared to only 36% or 4,203 of males.
The gender split of 64% female, 36% male has been the same since 2012/13.
11,567
Children and young
people received
counselling in
2014/15
Chart 3: Number of children and young people (per 100 of resident 10-18 year olds) who received counselling in Wales by local authority1
0 1 2 3 4 5 6 7 8
Rhondda Cynon Taf Swansea Carmarthenshire Pembrokeshire Torfaen Monmouthshire Ceredigion Merthyr Tydfil Neath Port Talbot Wrexham Bridgend Blaenau Gwent Vale of Glamorgan
Powys Denbighshire Conwy Gwynedd and Isle of Anglesey Newport Flintshire Cardiff Caerphilly
Number of children and young people who received counselling (per 100 of resident 10-18 year olds)
L
o
c
a
l
A
u
th
o
ri
ty
1 Population estimates obtained from 2014 Mid-year population estimates produced by the Office for National Statistics.
3.7 children and young people per 100 of resident 10-18 year olds received counselling in Wales in 2014/15.
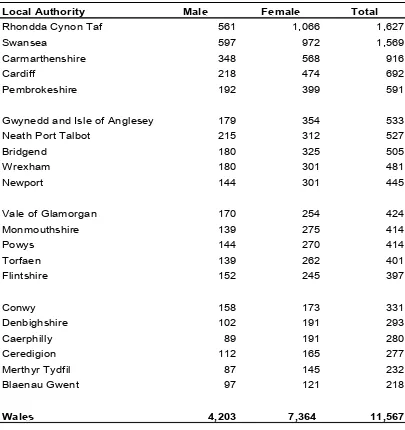
Rhondda Cynon Taf had the highest number of children and young people per 100 of resident 18 year olds who received counselling (6.7 children and young people per 100 of resident 10-18 year olds in 2014/15, Chart 3).
Rhondda Cynon Taf also had the most children and young people who received counselling (1,627 in 2014/15, Table 1).
Caerphilly had the lowest number of children and young people per 100 of resident 10-18 year olds who received counselling (1.4 children and young people per 100 of resident 10-18 year olds in 2014/15, Chart 3).
Blaenau Gwent had the fewest children and young people who received counselling (218 in 2014/15, Table 1).
Chart 4: Number of children and young people who received online counselling in Wales
Table 1: Number of children and young people who received counselling (excluding online counselling) in Wales by local authority2
Local Authority Male Female Total
Rhondda Cynon Taf 561 1,066 1,627
Swansea 597 972 1,569
Carmarthenshire 348 568 916
Cardiff 218 474 692
Pembrokeshire 192 399 591
Gwynedd and Isle of Anglesey 179 354 533
Neath Port Talbot 215 312 527
Bridgend 180 325 505
Wrexham 180 301 481
Newport 144 301 445
Vale of Glamorgan 170 254 424
Monmouthshire 139 275 414
Powys 144 270 414
Torfaen 139 262 401
Flintshire 152 245 397
Conwy 158 173 331
Denbighshire 102 191 293
Caerphilly 89 191 280
Ceredigion 112 165 277
Merthyr Tydfil 87 145 232
Blaenau Gwent 97 121 218
Wales 4,203 7,364 11,567
2 Please note data for Conwy includes 32 children and young persons below Year 6.
Online Counselling
for children and young people in
2014/15
Powys - 198 Cardiff - 101
Chart 5: Number of children and young people who received counselling in Wales by form of referral
School-based Staff Self Parents
Healthcare Professionals
Social
Services Other Not known
2013/14 4,933 3,892 980 433 99 193 7
2014/15 5,284 4,280 1,176 388 117 265 57
0 1,000 2,000 3,000 4,000 5,000 6,000 N u m b e r o f c h ild re n a n d y o u n g p e o p le w h o re c e iv ed c o u n se lli n g
The most common form of referral was by school-based staff (including teachers, support staff and school nurses), which accounted for nearly half of all referrals (46% in 2014/15). Self referral was the second most common form of referral (37% in 2014/15).
The trend for different types of referrals was similar for both 2013/14 and 2014/15.
Chart 6: Form of referral of children and young people who received counselling by gender in 2014/15
School-based
Staff Self Parents ProfessionalsHealthcare ServicesSocial Other Not known
Males 2,126 1,309 488 111 48 92 29
Females 3,158 2,971 688 277 69 173 28
Males and females attending counselling displayed a similar trend in their form of referral, with referral by school-based staff the most common (followed by self referral) for both males and females.
However, males were more likely to be referred by school-based staff (51% of all male referrals) compared to their female counterparts (43% of all female referrals).
Conversely, females were more likely to refer themselves (40% of all female referrals) compared to their male counter parts (31% of all male referrals).
Chart 7: Number of children and young people who received counselling in Wales by school year age group3
Year 6 Year 7 Year 8 Year 9 Year 10 Year 11 Year 12 Year 13 knownNot
2013/14 375 1,215 1,743 2,139 2,262 1,860 530 317 93 2014/15 458 1,412 1,881 2,181 2,490 2,075 493 359 218
0 500 1,000 1,500 2,000 2,500 3,000
N
u
m
b
e
r
o
f
c
h
ild
re
n
a
n
d
y
o
u
n
g
p
e
o
p
le
w
h
o
r
e
c
e
iv
e
d
c
o
u
n
s
e
lli
n
g
3 Please note the “Not known” category includes 32 children and young persons below Year 6 in 2014/15
TheYear 10 age group had the highest number of children and young people who received counselling, followed by the Year 9 age group in 2014/15.
TheYear 10 age group accounted for 22% of all children and young people who received counselling in 2014/15.
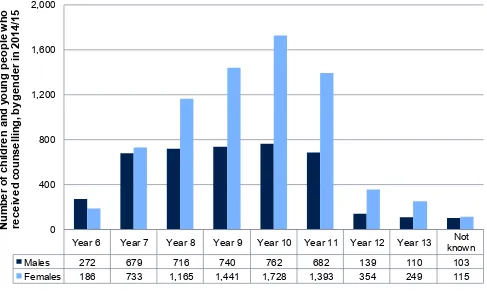
Chart 8: Number of children and young people who received counselling in Wales by gender and school year age group in 2014/153
Year 6 Year 7 Year 8 Year 9 Year 10 Year 11 Year 12 Year 13 knownNot
Males 272 679 716 740 762 682 139 110 103
Females 186 733 1,165 1,441 1,728 1,393 354 249 115
0 400 800 1,200 1,600 2,000
N
u
m
b
e
r
o
f
ch
ild
re
n
a
n
d
y
o
u
n
g
p
e
o
p
le
w
h
o
re
ce
iv
e
d
c
o
u
n
se
lli
n
g
, b
y
g
e
n
d
e
r
in
2
01
4/
15
There were more females than males who received counselling in all year groups, with the exception of the Year 6 age group.
[image:7.595.52.539.88.385.2] From Year 7 to Year 11 the number of males attending counselling remained relatively steady at around 700. However the number of females increased considerably year on year compared to there male counterparts, to a peak in Year 10 (1,728 females).
Table 2: Number and percentage of children and young people who received counselling in Wales, by ethnic background for 2014/15
Number Per cent Number Per cent
White 10,181 96.6 11,028 95.3
Mixed Race 176 1.7 198 1.7
Asian or Asian British 78 0.7 86 0.7
Black or Black British 33 0.3 43 0.4
Chinese or Chinese British 11 0.1 13 0.1
Any other ethnic background 41 0.4 74 0.6
Not known 17 0.2 125 1.1
Total 10,537 100.0 11,567 100.0
Ethnic Background
2013/14 2014/15
Chart 9: Main presenting issues for children and young people who received counselling in Wales in 2014/154
A presenting issue is the reason that a client self-refers or is referred to a counsellor. Local authorities are asked to record up to three presenting issues per child or young person.
Family 23%
Stress 11%
Anger 9%
Self-worth 8%
Behaviour related
6% Relationships
other than
family or teachers
6% Other
37%
Presenting
issues
for children and young people who received
counselling in
2014/15
4Please note percentages may not add up to 100 due to rounding.
Male
presenting
issues in
2014/15
Female
presenting
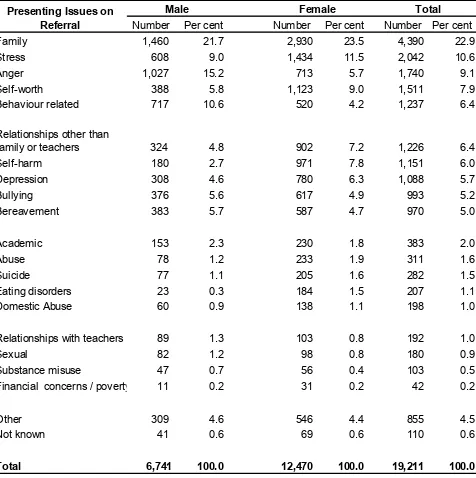
Table 3: All presenting issues for children and young people who received counselling in Wales in 2014/15
Number Per cent Number Per cent Number Per cent
Family 1,460 21.7 2,930 23.5 4,390 22.9
Stress 608 9.0 1,434 11.5 2,042 10.6
Anger 1,027 15.2 713 5.7 1,740 9.1
Self-worth 388 5.8 1,123 9.0 1,511 7.9
Behaviour related 717 10.6 520 4.2 1,237 6.4
Relationships other than
family or teachers 324 4.8 902 7.2 1,226 6.4
Self-harm 180 2.7 971 7.8 1,151 6.0
Depression 308 4.6 780 6.3 1,088 5.7
Bullying 376 5.6 617 4.9 993 5.2
Bereavement 383 5.7 587 4.7 970 5.0
Academic 153 2.3 230 1.8 383 2.0
Abuse 78 1.2 233 1.9 311 1.6
Suicide 77 1.1 205 1.6 282 1.5
Eating disorders 23 0.3 184 1.5 207 1.1
Domestic Abuse 60 0.9 138 1.1 198 1.0
Relationships with teachers 89 1.3 103 0.8 192 1.0
Sexual 82 1.2 98 0.8 180 0.9
Substance misuse 47 0.7 56 0.4 103 0.5
Financial concerns / poverty 11 0.2 31 0.2 42 0.2
Other 309 4.6 546 4.4 855 4.5
Not known 41 0.6 69 0.6 110 0.6
Total 6,741 100.0 12,470 100.0 19,211 100.0
Presenting Issues on Referral
Male Female Total
Presenting issues were recorded for each child and young person who received counselling services in Wales. The most common form of presenting issue on referral was family issues which accounted for nearly a quarter of all presenting issues (23%) in 2014/15. Stress issues were the second most common form of presenting issue on referral (11% in 2014/15).
Chart 10: Main predominant issues for children and young people who received counselling in Wales in 2014/154
A predominant issue is the underlying issue(s) that is identified during the counselling process. For example, a young person’s presenting issue may be anger, but through the counselling process, he/she may come to realise that the predominant issue is family relationships. Local authorities are asked to record up to three predominant issues per child or young person.
Family 24%
Self-worth 11%
Stress 11% Anger
8% Relationships
other than family or teachers
8%
Self-harm 5% Other
34%
Predominant
issues
for children and young
people who received
counselling in
2014/15
Male
predominant
issues in
2014/15
Female
predominant
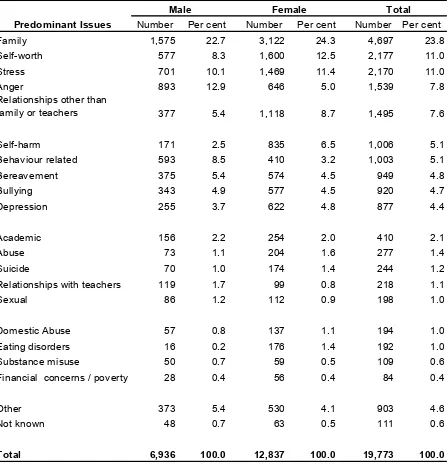
Table 4: All predominant issues of children and young people who received counselling in Wales in 2014/15
Number Per cent Number Per cent Number Per cent
Family 1,575 22.7 3,122 24.3 4,697 23.8
Self-worth 577 8.3 1,600 12.5 2,177 11.0
Stress 701 10.1 1,469 11.4 2,170 11.0
Anger 893 12.9 646 5.0 1,539 7.8
Relationships other than
family or teachers 377 5.4 1,118 8.7 1,495 7.6
Self-harm 171 2.5 835 6.5 1,006 5.1
Behaviour related 593 8.5 410 3.2 1,003 5.1
Bereavement 375 5.4 574 4.5 949 4.8
Bullying 343 4.9 577 4.5 920 4.7
Depression 255 3.7 622 4.8 877 4.4
Academic 156 2.2 254 2.0 410 2.1
Abuse 73 1.1 204 1.6 277 1.4
Suicide 70 1.0 174 1.4 244 1.2
Relationships with teachers 119 1.7 99 0.8 218 1.1
Sexual 86 1.2 112 0.9 198 1.0
Domestic Abuse 57 0.8 137 1.1 194 1.0
Eating disorders 16 0.2 176 1.4 192 1.0
Substance misuse 50 0.7 59 0.5 109 0.6
Financial concerns / poverty 28 0.4 56 0.4 84 0.4
Other 373 5.4 530 4.1 903 4.6
Not known 48 0.7 63 0.5 111 0.6
Total 6,936 100.0 12,837 100.0 19,773 100.0
Female Total
Predominant Issues
Male
The most common form of predominant issue was family issues which accounted for nearly a quarter of all predominant issues (24% in 2014/15). Self-worth and Stress issues were the next most common forms of predominant issue (11% in 2014/15).
The top 6 most common forms of predominant issues were the same as the top 6 most common forms of presenting issues on referral, with the exception of self-harm which replaced behaviour related issues.
Chart 11: Average YP Core score for children and young people who received counselling in Wales in 2014/15
YP Core is a measure of psychological distress reported by young people, both before and after counselling. For further information on the form completed by young people please refer to the following link: http://www.thegrid.org.uk/info/welfare/counselling/documents/yp_core.pdf
0 2 4 6 8 10 12 14 16 18 20
Prior to counselling Following counselling
A v e ra g e Y P C o re s c o re o f c h ild re n a n d y o u n g p e o p le w h o r e c e iv e d c o u n s e lli n g
Chart 12: Average improvement in YP Core score for children and young people who received counselling in Wales by local authority in 2014/15
0 2 4 6 8 10 12 14 16 18
Bridgend Swansea Denbighshire Torfaen Conwy Monmouthshire Caerphilly Wrexham Carmarthenshire Blaenau Gwent Powys Merthyr Tydfil Flintshire Neath Port Talbot Newport Rhondda Cynon Taf Pembrokeshire Gwynedd and Isle of Anglesey Ceredigion Vale of Glamorgan
Cardiff
Average improvement in YP Core score
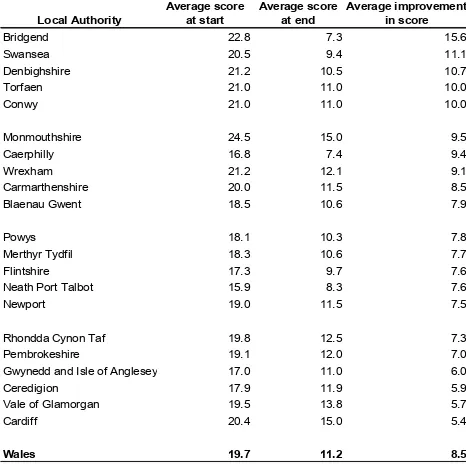
Table 5: Average YP Core score for children and young people who received counselling in Wales by local authority in 2014/15
Local Authority
Average score at start
Average score at end
Average improvement in score
Bridgend 22.8 7.3 15.6
Swansea 20.5 9.4 11.1
Denbighshire 21.2 10.5 10.7
Torfaen 21.0 11.0 10.0
Conwy 21.0 11.0 10.0
Monmouthshire 24.5 15.0 9.5
Caerphilly 16.8 7.4 9.4
Wrexham 21.2 12.1 9.1
Carmarthenshire 20.0 11.5 8.5
Blaenau Gwent 18.5 10.6 7.9
Powys 18.1 10.3 7.8
Merthyr Tydfil 18.3 10.6 7.7
Flintshire 17.3 9.7 7.6
Neath Port Talbot 15.9 8.3 7.6
Newport 19.0 11.5 7.5
Rhondda Cynon Taf 19.8 12.5 7.3
Pembrokeshire 19.1 12.0 7.0
Gwynedd and Isle of Anglesey 17.0 11.0 6.0
Ceredigion 17.9 11.9 5.9
Vale of Glamorgan 19.5 13.8 5.7
Cardiff 20.4 15.0 5.4
Wales 19.7 11.2 8.5
In 2014/15 the average YP Core score for children and young people who received counselling in Wales was 19.7 prior to counselling, this average score reduced to 11.2 after counselling and is an improvement of 8.5 in the average YP Core score (Chart 11).
Bridgend had the biggest average improvement in YP Core score amongst children and young people who received counselling in 2014/15 (an improvement in YP Core score of 15.6, Chart 12).
Chart 13: Onward referrals of children and young people who received counselling in Wales in 2014/15
89% 4%
4%
2% <1%
None
Other
Children and Adolescent Mental Health Services Child Protection services
Unknown
Onward
referral
for children and young
people who received
counselling in
2014/15
Male
onward
referral
2014/15
Onward referral information was collected for children and young people who received
counselling. The majority of children and young people who received counselling did not require any form of onward referral once counselling sessions had been completed (89% in 2014/15).
Of those children and young people who were referred onwards, referrals to the Child and Adolescent Mental Health Service (CAMHS) (4% in 2014/15) and the Child Protection service (4% in 2014/15) were the most common.
The majority of both males and females did not require any form of onward referral once counselling sessions had been completed. However females were more likely to be referred onwards (12% in 2014/15) following the completion of counselling than their male counterparts (9% in 2014/15).
5% of females were referred onwards to the Child and Adolescent Mental Health Service compared to 3% of males in 2014/15.
Chart 14: Average number of counselling sessions attended by children and young people in Wales who received counselling
0 1 2 3 4 5 6
2012/13 2013/14 2014/15
A v e ra g e n u m b e r o f s e s s io n s a tt e n d e d c h ild re n a n d y o u n g p e o p le w h o re c e iv e d c o u n s e lli n g Year
The average number of counselling sessions attended by children and young people who
Chart 15: Average number of counselling sessions attended by children and young people in Wales who received counselling in Wales by local authority in 2014/15
0 2 4 6 8 10 12
Caerphilly Wrexham Bridgend Denbighshire Newport Ceredigion Merthyr Tydfil Gwynedd and Isle of Anglesey Powys Vale of Glamorgan
Pembrokeshire Cardiff Carmarthenshire Torfaen Conwy Flintshire Neath Port Talbot Blaenau Gwent Rhondda Cynon Taf Swansea Monmouthshire
Average number of sessions attended
L
o
ca
l A
u
th
o
ri
ty
Caerphilly had the highest number of average sessions attended amongst children and young people who received counselling in 2014/15 (an average of 10 sessions, Chart 15).
Monmouthshire had the lowest number of average sessions attended amongst children and young people who received counselling in 2014/15 (an average of 3 sessions, Chart 15).
Key Quality Information
Our statistics are produced to high professional standards set out in the Code of Practice for Official Statistics. They undergo regular quality assurance reviews to ensure that they meet customer needs. They are produced free from any political interference.
Please note these statistics are published as experimental statistics as the quality of the data collected through this survey continues to develop and centrally we improve the validation, guidance and definitions used within the survey. Since 2014 there has been a considerable amount of work on guidance and definitions to ensure a consistent approach between authorities, to clarify some known issues with earlier surveys, and to reflect current policy.
School Standards and Organisation (Wales) Act 2013
local authorities are required to provide anonymised information about these counselling services to the Welsh Government, in compliance with a direction issued by the Welsh Ministers under Section 93 of the 2013 Act.
Where a local authority has arranged for a person to provide an independent counselling service on its behalf, the authority must give the person a copy of the Welsh Ministers’ direction and that person must compile the information necessary for compliance with the direction and submit it to the local authority.
Further information on the School Standards and Organisation (Wales) Act 2013 is available by following the link below:
http://www.senedd.assembly.wales/mgIssueHistoryHome.aspx?IId=3633
Methodology
Local authorities, and their counselling providers where applicable, compile aggregated data on children and young people accessing counselling and submit that data to the Welsh Government. Information compiled for the period 1 April 2013 to 31 August 2013 was required to be provided by 31 October 2013 and information compiled for each academic school year after 31 August 2013 is required to be provided by 31 October following the end of each academic school year.
Prior to the School Standards and Organisation (Wales) Act 2013, local authorities provided the Welsh Government with anonymised demographic and outcome data on children and young people accessing counselling under the terms and conditions of the school-based counselling grant.
Figures are based on the numbers of children and young people who have received face to face counselling and have finished their episode(s) of counselling during the period. Online counselling information is set out solely in Chart 4.
The age group of those children and young people who received counselling is based on their school year rather than actual age. Please note not all the children and young people who receive counselling are school pupils. Where this occurs these children and young people are included in the school year age group they would typically attend if they were in school.
Due to the sensitivity of the data it must be transferred to the Welsh Government via a secure medium and also held in a secure environment. The secure medium for transferring the data is the Data
Exchange Wales Initiative (DEWi).
The local authority, or the person who provides the counselling service, must not provide information about an identified individual or provide information in such a way (either by itself or combined with other information) that it identifies an individual or enables an individual to be identified.
Further information on the data requirements is available in ‘Statutory guidance to Welsh
local authorities on the provision of independent counselling services’, available via the link below:
http://gov.wales/docs/dcells/publications/130611-independent-counselling-services-en.pdf
Users and uses of these statistics
We believe the key users of statistics on counselling services for children and young people are: • Ministers, Assembly Members and the Members Research Service in the National Assembly
for Wales
Local Health Boards including Child and Adolescent Mental Health Services (CAMHS) • Students, academics and universities
• Individual citizens and private companies.
The statistics are used in a variety of ways. Some examples of the uses include: • Advice to Ministers
• To inform debate in the National Assembly for Wales and beyond
• To monitor and evaluate counselling services in Wales, at a local level and at a national level. Local authorities can use the data they collect to monitor and evaluate the counselling
services provided in their area, in order to drive service improvement.
To identify key issues and concerns for children and young people which can impinge on their mental health.
User feedback
This is the second edition of this release; we would therefore welcome comments from users of our publication on the content and presentation of this publication. If you have any comments or require further information, please contact us.
William Perks
Knowledge and Analytical Services Welsh Government
Cathays Park Cardiff CF10 3NQ
Email: William.Perks@wales.gsi.gov.uk
Telephone: 029 2082 3989.
All content is available under the Open Government Licence v3.0 , except where otherwise stated.