On the Importance of Using Appropriate Link-to-System Level
Interfaces for the Study of Link Adaptation
Javier Gozalvez and John Dunlop
Department of Electronic and Electrical Engineering, University of Strathclyde
204 George St, Glasgow G11XW, Scotland
[email protected]
,
[email protected]
ABSTRACT
Link Adaptation is an adaptive radio link technique that selects a transport mode, from a set of predefined modes of varying robustness, depending on the channel quality conditions and dynamics. It is therefore very important, when analysing the performance and operation of Link Adaptation, to properly capture such conditions and dynamics. In this context, this paper investigates the effect that different link-to-system level interfaces have on the study of Link Adaptation, in particular on its throughput performance and associated signalling cost.
I. INTRODUCTION
The steady increase in demand for traditional voice services and the introduction of new bandwidth-consuming data services is creating new challenges for mobile operators that need to implement the means to efficiently use the scarce available radio resources. The efficient and dynamic use of the radio resources, which is a key aspect of research conducted for 3G and future mobile systems [1], is the main aim of Radio Resource Management (RRM) techniques. One of these RRM techniques is Link Adaptation (LA).
Link Adaptation (LA), initially developed as a 3G technique, has been identified as a key technology for evolved GSM systems such as the Adaptive Multi-Rate codec (AMR), General Packet Radio Services (GPRS) and Enhanced Data rates for GSM Evolution (EDGE). The potential and benefits of LA are such that it is being considered for the High-Speed Downlink Packet Access (HSDPA) system, which represents the future evolution of 3G systems. The basis of LA is to assess the channel conditions and then use a transport mode, from a set of predefined options, that is optimised for these conditions according to a predefined criteria. This work focuses on a LA algorithm that only changes the coding scheme used. The performance evaluation of a cellular system is usually conducted at two different levels: link level and system level. Interfaces between these levels are then necessary to analyse the final performance. Some system level studies of LA are based on relatively simple link-to-system level interfaces which may not properly model the inherent variability present in the radio channel. Since this variability is an important element for the operation of adaptive radio link techniques, the aim of this investigation is to assess the impact that link-to-system level interfaces have on the study of these techniques and in particular of LA. For this purpose, two link-to-system level interfaces,
each with different degrees of accuracy, have been implemented in the context of this work. This study investigates the impact that such interfaces have on the predicted performance and cost of the LA algorithm.
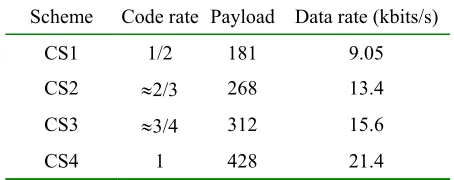
This study has been conducted for packet data transmissions in a GPRS-like system. As it is shown in Table 1, the different GPRS coding schemes (CS) offer a trade-off between throughput and coding protection, paving the way for the application of dynamic LA to GPRS. Although the current GPRS standard does not contemplate CS changes for retransmissions, it has been considered here so that results are not conditioned by GPRS limitations.
Scheme Code rate Payload Data rate (kbits/s)
CS1 1/2 181 9.05
CS2 ≈2/3 268 13.4
CS3 ≈3/4 312 15.6
[image:1.595.317.544.367.457.2]CS4 1 428 21.4
Table 1: GPRS channel coding parameters
II. SIMULATION MODELS
As previously mentioned, the performance evaluation of a cellular system is usually conducted at two different levels: system level and link level. While the former models a mobile radio network, the later models the radio link at the bit level. Interfaces between both levels are hence necessary to study the overall performance. This section is devoted to present different simulations tools and interfaces developed in the context of this work.
A. Link Level Simulation Tool
The link level analysis has been conducted using the high-speed link level simulation tool described in [2]. This tool is an evolved software version of a real-time emulator designed initially to demonstrate the effectiveness of LA for circuit switched voice communications in a dynamically varying radio environment. Subsequently, the emulator has been extended to analyse the GPRS link level performance and produce the different link-to-system level interfaces necessary for the assessment of LA in a packet-switched environment.
by means of a database of error patterns produced with the bit level simulation package COSSAP. The derivation of an error database significantly reduces the simulation time whilst maintaining accuracy of radio link quality representation. In fact, the error database is independent of the data bits transmitted making it possible to be reused whenever the radio path effects have to be taken into account. The link level simulations, conducted under an interference-limited environment, were done following ETSI recommendations [3]. The simulations were performed for a typical urban channel model and speeds of 5 and 50km/h. More details on the link level simulation tool can be found in [2].
B. System Level Simulation Tool
In order to ensure high accuracy and to account for sudden channel quality variations, an event-driven simulator working at the burst level has been implemented. The simulator models the dynamic behaviour of the channel quality in terms of the Carrier to Interference Ratio (CIR).
B.1 System Model
A cellular network of equally sized 3-sector macro cells, with a cluster size equal to four, has been considered. Within the network, interference produced by first and second tier of co-channel interferers is considered. Each cell has a radius of 1km and each sector has been assigned two carriers. Although mobility has been implemented, handover between sectors has not been considered. The boundary effects have been removed by using a wrap-around technique.
The simulator concentrates on the downlink performance. The system load is varied by changing the number of users in the system, with each user operating for the complete duration of the simulation. Following the study presented in [4], a single slot allocation strategy has been implemented by means of a random allocation scheme. Users are assigned channels in a first-come-first-served basis and the channel is kept until all its data has been correctly transmitted. An ARQ protocol, following the GPRS specifications, has been implemented to request the retransmission of erroneous blocks. A perfect feedback of the ARQ report with no RLC block loses has been assumed [5].
Pathloss is predicted using the Okumura-Hata model. Although the Okumura-Hata model was based on measurements done for distances greater than 1km, the model can be extended for distances below 1km [4]. The shadowing has a log normal distribution with a standard deviation of 6dB and a decorrelation distance of 20 meters. Power Control (PC) or Slow Frequency Hopping (SFH) mechanisms have not been implemented in the results reported. PC and SFH directly affect the operation of LA and therefore the use of both techniques together with LA would require the definition of an algorithm describing how they should interact. Since the definition of such algorithm is out of scope of this work, PC and SFH have not been considered here.
B.2 Traffic Modelling
Two different traffic sources have been considered for this study, WWW browsing and email, with the traffic type evenly distributed among users at 50%. No channel partition has been applied between the two services and results are collected individually for each type of traffic from the central cell. For both traffic models, the transmission of a new packet cannot start until the previous transmission has finished, i.e. all the data has been correctly received. The active transmission time will hence depend on the link quality conditions. More details on the system level simulation tool and the traffic sources can be found in [5].
C. Link-to-System Level Interfaces
In order to reduce the complexity of system level simulations, the effects at the physical layer are generally included by means of Look-Up Tables (LUTs). The link level performance is then represented by a simplified model consisting of a set of LUTs mapping the CIR to a given link quality parameter such as the Block Error Rate (BLER). Different LUTs need to be produced for different operating conditions and different levels of accuracy can be targeted with the LUTs depending on the particular study carried out at the system level. This section presents two different approaches implemented in this work to interface the link and system levels. Each interface provides a different degree of accuracy in the representation of the variability present in the radio environment.
The first approach, generally used in the literature, maps the mean CIR experienced over the four bursts used to transmit a Radio Link Control (RLC) block to the final block quality measure, e.g. Block Error Rate. Effectively this approach only models the behaviour at the RLC block level and will therefore be referred in the rest of this paper as block level modelling.
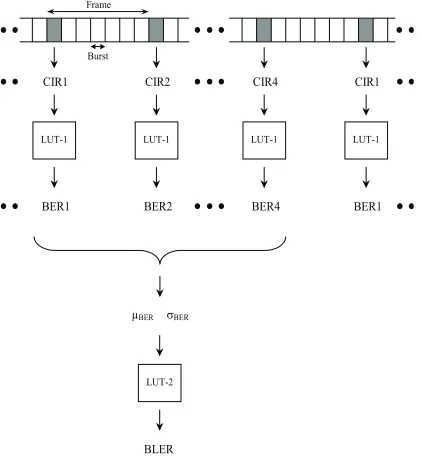
The combined effects of convolutional coding and interleaving make the block errors dependent not only on the mean block quality but also on the quality distribution among the four bursts used to transmit an RLC block. In order to improve the modelling accuracy and the representation of the variability present in the radio channel, a more sophisticated approach, which models the behaviour at the burst level, has also been implemented. This second approach, that will be referred in the rest of this paper as burst level modeling, was proposed in the ATDMA project [6]. The burst level interface is composed of two sets of LUTs, as illustrated in Figure 1.
model the effect of fast fading on the BER through a random process thereby including the fast fading at the system level. The BER is then estimated for the four bursts used to transmit a RLC block and LUT-2 maps the mean BER and the standard deviation of the BER over the four bursts to a corresponding BLER value.
Graphical examples of the block level and burst level interfaces can be found in [2] and [5] respectively. A similar modeling approach was considered for GSM in [7].
Burst Frame
CIR1 CIR2 CIR4 CIR1
LUT-1
BER1
LUT-1
BER1 LUT-1
BER4 LUT-1
BER2
LUT-2
[image:3.595.61.272.198.426.2]BLER µBER sBER
Figure 1: Burst level modelling approach
III. LINK ADAPTATION ALGORITHM
The basis of LA is to assess the channel conditions and then use a CS that is optimised for these conditions. Since this work is based on non-real time data services, a CS is considered to be optimum if it maximises the throughput, defined as:
Throughput = RCS × (1 – BLERCS) (1)
with RCS and BLERCS being the data rate and BLER for a
given CS.
[image:3.595.313.543.199.355.2]The LA switching thresholds define the boundaries between the regions where each CS maximises the throughput. Since the throughput is defined as a function of the link level performance, i.e. BLER, the representation of these boundaries depends on the modelling approach used to represent the link level performance. If the block level modelling approach is considered, each boundary is represented by a single point corresponding to a given value of the mean CIR; see Figure 2. On the other hand, if the burst level modelling approach is considered, the throughput performance is dependent on the mean and standard deviation of the burst quality. As illustrated in Figure 3, in this case, the boundaries are defined as a collection of points, each representing a combination of mean and standard deviation of burst quality values. For
both modelling approaches, no hysteresis thresholds have been implemented.
The LA algorithm uses the quality measurements over the previous LA updating period to decide on the optimum CS. These quality measurements are filtered to get the channel quality estimation necessary for the LA algorithm. A filter with a rectangular shape has been applied throughout and a fixed initial coding scheme, CS4, has been selected at the start of each new data transmission.
0 5 10 15 20
0 5 10 15 20
throughput[kbits/s]
C/I
Throughput vs C/I for TU50 without FH
[image:3.595.315.542.203.570.2]CS1 CS2 CS3 CS4
Figure 2: Throughput performance and LA switching thresholds under the block level modelling approach
0 0.2 0.4
0 0.1 0.2 0.3 0.4 0.5 0.6 0.7 0 2 4 6 8 10 12 14 16 18 20
22 Throughput at 50km/h (noFH)
CS1 CS2 CS3 CS4
Throughput (kbits/s)
Mean BER Stdv
BER
Figure 3: Throughput performance and LA switching thresholds under the burst level modelling approach
IV. SIMULATION RESULTS
A. Performance Metrics and Evaluation Scenarios
[image:3.595.320.542.383.568.2]case, the throughput is measured over intervals of four seconds whenever the user is active. The throughput is collected for all users in the centre cell and the cdf of the throughput is therefore used to provide an indication of the system performance. Other useful parameters to understand the functioning of an LA algorithm are the proportion of RLC blocks received with an optimal CS and the proportions of right-side and wrong-side failures. A right-side failure corresponds to the case where a user is using a non-optimal CS but one robust enough for correct reception. For the wrong-side failure, the current CS is not robust enough. The operation of LA is also analysed by deriving the mode error of each CS, which represents the percentage of time that a given CS was being used and it was not the optimal one.
The analysis here presented considers a load of 16 users per sector (which represents an average bandwidth occupancy of 45%), receiving WWW traffic and a mobile speed of 50km/h. The LA algorithm has been configured with either a 20ms (i.e., one RLC block) or a 200ms LA updating period (i.e., ten RLC blocks).
In order to ensure results with good statistical accuracy, each simulation scenario simulates the transmission of
more than 30 × 106 RLC blocks in the central cell.
B. Results
Section II.C has presented two different approaches used to model block errors and to interface the link and system level analysis. The aim of this section is to evaluate the effect that link-to-system level interfaces have on the accuracy of the LA performance estimation.
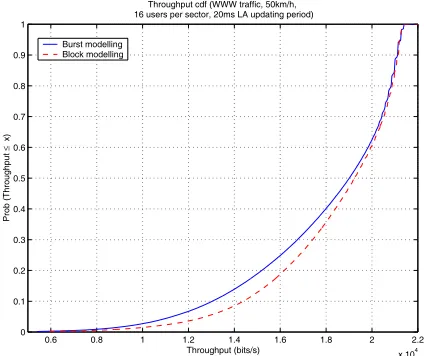
[image:4.595.324.536.186.364.2]Figure 4 shows the throughput performance using both link-to-system level interfaces and for a 20ms LA updating period. The results show that the prediction of the LA performance is influenced by the link-to-system level interface considered. As it has been previously explained, the burst level modelling approach represents the inherent variability present in the radio channel more accurately than the block level modelling approach since it introduces the effect of fast fading at the system level. As a result, using the burst level modelling approach to interface the link and system levels provides a better indication of the true LA performance than using the block level modelling approach. In fact, Figure 4 shows that the results obtained using the block level modelling approach overestimate the predicted LA performance. For example, when considering the burst level modelling approach, the results obtained indicate that 10% of the samples have a throughput lower than 12.9kbits/s. In the case of the block level modelling approach, the maximum throughput experienced by 10% of the samples would be 14.5kbits/s. In order to verify whether these observations are dependent on the length of the LA updating period the estimated throughput performance for a 200ms LA updating period is depicted in Figure 5. This figure reveals that the same behaviour is observed for longer LA updating periods. It is worth noting that while using the block level modelling approach overestimates the predicted throughput performance for
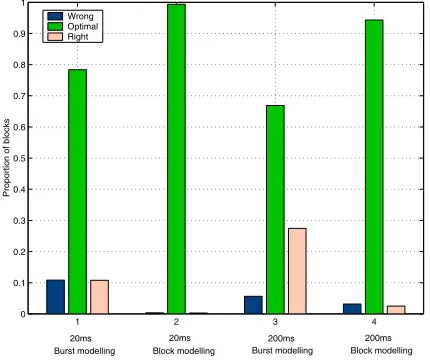
low bit rates with a 20ms LA updating period, the predicted performance is overestimated for high bit rates under longer LA updating periods. The higher throughput performance estimation obtained with the block level modelling approach is due to a higher proportion of blocks received with the optimal coding scheme and a lower proportion of wrong-side and right-side failures. These proportions are illustrated in Figure 6.
0.6 0.8 1 1.2 1.4 1.6 1.8 2 2.2
x 104
0 0.1 0.2 0.3 0.4 0.5 0.6 0.7 0.8 0.9 1
Throughput cdf (WWW traffic, 50km/h, 16 users per sector, 20ms LA updating period)
Throughput (bits/s)
Prob (Throughput
≤
x)
Burst modelling Block modelling
Figure 4: Throughput cdf (20ms LA updating period)
0.4 0.6 0.8 1 1.2 1.4 1.6 1.8 2 2.2
x 104
0 0.1 0.2 0.3 0.4 0.5 0.6 0.7 0.8 0.9 1
Throughput (bits/s) Throughput cdf (WWW traffic, 50km/h, 16 users per sector, 200ms LA updating period)
Prob (Throughput
≤
x)
[image:4.595.324.538.392.570.2]Burst modelling Block modelling
Figure 5: Throughput cdf (200ms LA updating period)
present in a system and the consequent predicted signalling load associated with the use of LA. This could have a significant impact when considering the practical implementation of LA since a system designed to cope with a signalling load established according to the simulation results obtained using the block level modelling approach might not be able to cope with the signalling load present in a real system. This signalling load is better approximated considering the burst level modelling approach.
1 2 3 4
0 0.1 0.2 0.3 0.4 0.5 0.6 0.7 0.8 0.9 1
Proportion of blocks
Wrong Optimal Right
20ms 20ms 200ms 200ms
[image:5.595.326.538.184.366.2]Burst modelling Block modelling Burst modelling Block modelling
Figure 6: Optimal, wrong and right side failures
LA Updating
Period = 20ms
LA Updating Period = 200ms Block Level
modelling approach 0.32 0.275
Burst Level
[image:5.595.58.273.207.387.2]modelling approach 10.81 1.22
Table 2: Average number of CS changes per second
The reduced variability present in the system with the block level modelling approach also results in an important decrease in the proportion of mode errors observed for the different CS compared to those measured with the burst level modelling approach. Such values are depicted in Figure 7 where it can be observed that the decrease is also more significant for shorter LA updating periods.
V. CONCLUSIONS
This paper has investigated the impact on the predicted LA performance of two different types of link-to-system level interfaces, each with a different degree of accuracy. This study has shown that the use of simple link-to-system level interfaces does not give an accurate prediction of the LA performance. In particular, the results presented show that the use of simple interfaces can induce an overestimation of the predicted LA throughput performance and, more importantly, derive an underestimation of the signalling load associated with the use of LA. This could have a significant impact when considering the practical
implementation of LA. For instance, if a system is designed to cope with a signalling load established according to studies conducted using simple interfaces it could be the case that this system would not be able to cope with the true signalling load present in a real system. To summarise, this investigation has highlighted the importance of using accurate link level models for the analysis of adaptive radio link techniques such as LA.
0 1 2 3 4 5 6 7 8 9
0 10 20 30 40 50 60 70 80 90 100
%
Burst modelling Block modelling
CS1 CS2 CS3 CS4 CS1 CS2 CS3 CS4
20ms 20ms 20ms 20ms 200ms 200ms 200ms 200ms
Figure 7: Mode error of each coding scheme
REFERENCES
[1] R. Agusti, O. Sallent, J. Pérez-Romero, J. Ruela and C. Guerrini, "ARROWS Strategies for RRM", in Proceedings of the IST Summit, September 2001. [2] J. Gozalvez and J. Dunlop, "High-Speed Simulation
of the GPRS Link Layer", in Proceedings of the IEEE PIMRC2000, September 2000, pp 989-993.
[3] ETSI, “GSM 05.05; Radio Transmission and reception”, version 7.1.0, Release 1998.
[4] J. Gozalvez and J. Dunlop, "Effect of Slot Allocation Mechanisms on the Performance of Link
Adaptation", to be published in Proceedings of the 5th
European Personal Mobile Communications Conference, EPMCC2003, April 2003.
[5] J. Gozalvez and J. Dunlop, "On the Dynamics of Link Adaptation Updating Periods for Packet Switched Systems", in Proceedings of the Fourth International Symposium on Wireless Personal Multimedia Communications, WPMC2001, September 2001, pp 609-614.
[6] E. Malkamäki et al, “A two-step look-up table approach for modelling the transport part in the ATDMA Detailed Simulation Testbed”, Proceedings of the RACE Mobile Telecommunications Workshop, May 1994, pp 279-283.
[image:5.595.47.283.410.498.2]