SIMULATION SUPPORT FOR INTERNET-BASED ENERGY SERVICES
J A Clarke
1, S Conner
1, V Geros
2, C M Johnstone
1, S Karatasou
2,
J Kim
1, M Santamouris
2and P A Strachan
11
ESRU, University of Strathclyde, Glasgow, Scotland
2
Building Environmental Studies Group, University of Athens, Greece
Contact: [email protected]
ABSTRACT
The rapidly developing Internet broadband network offers new opportunities for deploying a range of energy, environment and health-related services for people in their homes and workplaces. Several of these services can be enabled or enhanced through the application of building simulation. This paper describes the infrastructure for e-services under test within a European research project and shows the potential for simulation support for these services.
INTRODUCTION
Broadband connection to homes has commenced in some countries and, although the timescale is uncertain, it is expected to become commonplace within developed countries in the short-term. The drivers for this are communications, home security and multimedia access. Such home connections offer the opportunity to develop a range of new Internet-based energy services.
The EC funded SmartHomes project commenced in early 2001 with the primary objective of defining a range of new energy services and testing these within field trials in Sweden, Greece, the Czech Republic and the UK. The aim is to prototype and test energy services for citizens and professionals and test cable and wireless approaches to Internet connection. The implementations are based on Ericsson's residential gateway, or `e-box', technology (Lindfors et al 1998).
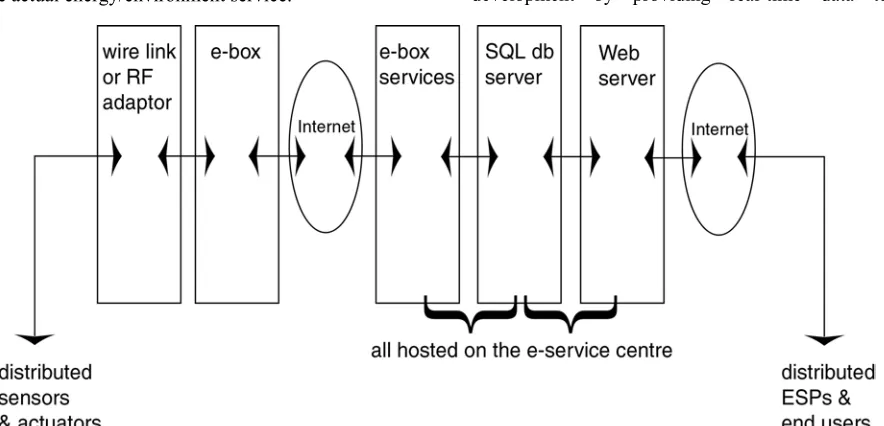
E-boxes, which are essentially small computers utilising the Linux operating system, can be placed in homes (and elsewhere) and connected to the Internet by cable or wireless means. The e-boxes are then connected to local sensors/actuators by radio-frequency (RF) or cable connections. The sensed data is transferred via the e-box to a service centre from where it may be accessed for further processing by designated energy service providers before a service is transmission to users.
Service providers (e.g. utilities, local authority energy managers, health care providers) and users (e.g. citizens, planners) access the information through standard Web browsers. Depending on the particular energy service, the providers may
transmit information or control instructions back to the originating homes. It is here that simulation assistance may be required.
The data collected from homes will normally provide the necessary information to allow the SmartHomes system to offer a range of energy services. However, many of these services require the use of modelling and simulation to provide maximum benefit. This paper focuses on the range of ways in which simulation can be used in conjunction with the new energy services being developed.
SYSTEM OVERVIEW
Many companies in Europe, the USA, Japan and Korea are developing capabilities for providing home services using broadband connections, mostly focused on the telecommunications, home entertainment and security markets. Much of this effort is fragmented and proprietary. The SmartHomes project built upon previous European pilot projects, most notably the Energy Barometer project in Sweden (Westergren et al 1998), which provided actual and projected energy consumption data to home owners/occupiers. The aim of the SmartHomes project is to prototype new energy, environment, health and safety services that offer new value propositions to citizens.
Several options are also available for access network communication, to link buildings to a central energy service centre from where the data transactions to and from service providers are co-ordinated. Two options are ADSL on twisted pair lines and GPRS over mobile networks.
The elements of the SmartHomes system are shown in Figure 1. Internet-enabled gateway devices act to co-ordinate home data acquisitions and actuations using sets of radio frequency (RF) sensors/actuators customised to the particular e-service(s) being enacted. The data obtained for a given site is transferred, by wireless and cable technology, to a central service centre placed at some arbitrary location on the Internet. There, the data is conflated with the private data arriving concurrently from the other sites within a given serviced region. Software agents then operate on the aggregated data in order to extract service-specific information for onward transmission to a related energy service provider (ESP). This ESP adds value by interpreting the data and providing the actual energy/environment service.
For example, information comprising home temperatures and CO levels would support a progressive care for the elderly service, while one comprising fuel and power usage data would support two providers, one concerned with local action planning and the other with the routine dissemination of personalised consumption information to citizens. Where the outcome from a service requires the imposition of on-site control, a provider transaction request is transmitted back to the relevant sites via the service centre to ensure that the actuations are authentic (i.e. that it is a valid component of the service selected by the customer).
The e-boxes, or e-service gateways, that will be placed in homes are designed for always-on operation with high availability. They offer local IP and non-IP network support, internal fault management, and remote configuration. The current version of the e-boxes has 32 Mbyte DRAM and 24 Mbyte flash memory with 10 Mbit TP Ethernet for both the access and local networks. They also have an RS232 serial port for connection to wire or wireless sensor/control networks. Both the e-service centre (eSc) and the e-e-service gateway provide an OSGi compliant application environment (Open Services Gateway Initiative 2002), enabling secure and transparent communication. For security, all HTTP connections, via the eSC, are based on two-way authenticated SSL-connections.
POTENTIAL ENERGY SERVICES
The Internet is now attaining a level of resilience and capacity that enables it to support a wide range of new and beneficial information services. Such services can be tailored to assist sustainable development by providing real-time data todecision-makers on energy and environmental issues.
Examples include:
• fuel use by time, type and sector in support of energy efficiency and renewable energy systems deployments;
• gaseous emissions monitoring in support of air quality and climate change targets attainment;
• systematic building stock performance monitoring in support of legislative requirements and local energy action planning; and
[image:2.595.80.522.344.557.2]• monitoring of energy efficiency components and renewable energy technologies to evaluate their life-time performance.
Equally significant and complementary services may also be established to provide direct links to citizens and to support their greater participation in sustainability issues. Examples include:
• home conditions monitoring (e.g. CO and temperature) in support of responsive care provision for vulnerable members of society;
• local appliance control in order to better match environmental conditions to need and reduce energy consumption at the large scale;
• synchronised appliance control in support of electricity base load management; and
• the provision of personalised energy use data in order to encourage desirable changes in usage patterns.
[image:3.595.316.517.377.628.2]Furthermore, the Internet-enabled information approach gives rise to an efficient mechanism by which to implement low cost energy systems monitoring in order to track the effectiveness of actions taken in response to future legislation (e.g. the European Directive on Energy Performance of Buildings).
Table 1 sets out categories for identified energy services while Table 2 lists some specific services.
Within the SmartHomes project, several of the identified energy services are currently being tested and proven within field trials tailored to the requirements of four European states: the Czech Republic, Greece, Scotland and Sweden. The Internet-based communications infrastructure required to support large scale roll-out has been established. The initial field trials under way reflect local concerns and conditions as follows.
Czech Republic - Individual metering of energy use and thermal comfort in multi-family buildings
with remote actuation of set-point temperatures of heating systems for entire housing blocks. Data is being reported to occupants, the energy supplier and authorities.
Greece - Cooling load predictions based on real time data input to neural networks, and information to occupants on how to effectively reduce space-cooling demand.
Scotland - The services target the public housing sector and comprise cold condition alarms, CO-level monitoring, fuel use metering and reporting to energy suppliers, health care agencies and local authorities.
Sweden - Metering of space and domestic water heating and electricity in multi-family buildings. The coupling of metered values to a simulation program allows estimates of the heat exchange between neighbouring apartments, thereby providing information for energy consumption debiting models. The data is reported to occupants, the energy supplier and the local authorities.
ROLE OF SIMULATION
Some of the uses of simulation that have been identified within the project include the following:
• Enabling control. Two options are outlined below: using modelling with real-time data imported into a simulation program to determine appropriate control actions, e.g. to control heaters based on monitored climate and Service type Examples
Information dissemination
Authorities inform potential customers about the energy labelling of domestic appliances and about the benefits of particular purchases.
Monitoring with alerts or alarms
CO monitoring in a 'care for the elderly' context or gas leak detection in a community safety context.
Monitoring with feedback information
Simultaneous reporting of metered energy consumption to occupants and energy suppliers.
Monitoring with actuation
[image:3.595.71.272.398.611.2]For supply-level network load management and energy efficiency.
Table 1 Service types with examples. Specific service Examples
environmental monitoring
detection of gas, smoke, temperature and humidity metering of gas, electricity and
water consumption weather-related heating control, night
cooling, use of rainwater performance
evaluation
city energy consumption by fuel type and emissions appliance control of heating, lighting and
small power as part of a demand-side management programme
load management demand side management, load scheduling and control
aggregate control district load manipulation and HVAC operation
building-integrated renewable energy systems control
renewable energy trading as a function of electricity prices and demand
internal temperature data; and using a simulation program to train an artificial neural network to determine the control action. In both cases, the SmartHomes infrastructure supplies data and enacts the control action.
• Using modelling to ensure equitable distribution of energy-related charges in multi-occupancy residential buildings.
• Developing strategies for smoothing demand-side energy use by remote switching of non-essential loads, and matching demands with supply for distributed generation.
• Large-scale energy management, selecting priorities for energy reduction measures based on specific monitored energy use.
The following sections describe the role of simulation in more detail.
TRAINING OF NEURAL NETWORKS
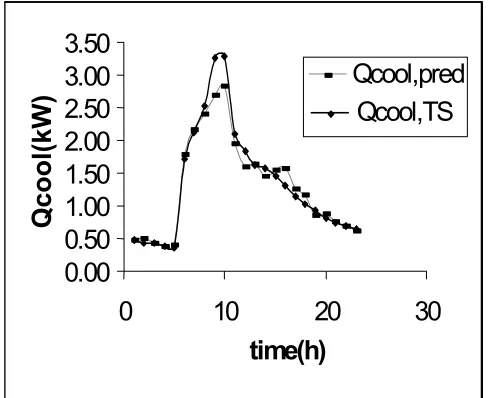
A simulation program is being used to train an artificial neural network (ANN) model that can be used in conjunction with monitored data from e-boxes to forecast cooling loads. In Southern European countries, short term cooling load forecasting in residential buildings with lead times from 1 hour to 7 days can play a key role in the economic and energy efficient operation of cooling appliances.Within the project, a methodology based on a combination of an ANN and a thermal model (TRNSYS) is being used. The ANN is capable of forecasting the following 24-hour cooling load profile for residential buildings. In general, neural network architectures are characterised by a collection of processing nodes connected by a series of weighted links. The relationship between an individual node’s inputs and outputs is typically a non-linear function (for example a sigmoid function). A neural network can carry out complex
calculations from global inputs to global outputs. In carrying out this process, and with the absence of a general theory for non-linear time-series prediction, good performance comes only by carefully analysing available data (i.e. by using so-called ‘training data’).
Reliable cooling load data for at least one season are required but are not usually available for residential buildings, the focus of interest. Thus, dynamic building simulations were carried out with TRNSYS for five selected apartments in Athens, Greece, using known building data (geometry, wall constructions, occupancy etc.). The simulations were carried out for a period of one year, using the Typical Meteorological Year as weather input. Measurements of the indoor and ambient temperature during a period of two months (April-May 2002) were used in order to calibrate the developed TRNSYS model of each house.
Following this procedure, a database consisting of reliable cooling load data was produced, and then extended by carrying out TRNSYS simulations for the period 2000-2002, as yearly meteorological data were available. The database was then divided into two sets: the training data set used to train the prediction system (with variable size in order to find the optimal solution), and the test set, only used at the end to test the performance of the trained system. The factors that were thought to influence the energy cooling demand, used as inputs to the ANN, are a combination of short and long-term historic values of the load profile and the previous day’s ambient temperature.
[image:4.595.176.420.556.755.2]The performance of the developed ANN model for cooling load prediction was tested using the cooling period May-September 2002. This set had not been used for training, as it is important to test the network over an “unknown” set of data. The
Figure 2 Predicted (ANN) and TRNSYS (TS) cooling load
0.00
0.50
1.00
1.50
2.00
2.50
3.00
3.50
0
10
20
30
time(h)
Q
c
o
o
l(
k
W
)
Qcool,pred
average absolute percentage error is of the order of 7.5%. As an example, Figure 2 shows TRNSYS model simulation data versus predicted cooling loads for one day.
The next stage is to enact the control using the SmartHomes infrastructure.
SIMULATION-ASSISTED BUILDING
ENERGY MANAGEMENT
There has been considerable research into model predictive control, using stochastic models, fuzzy logic control, neural net-based control and the development of self-learning algorithms. These methods share a common feature: they have no underlying physical model of the system and the process being controlled. A black-box model is used to determine the control action. The work reported in Clarke et al (2001) demonstrated how, as an alternative, a detailed, physically based model can be integrated into the control system.
Such a facility is likely to become important for passive solar buildings employing natural resources such as daylight and free cooling. For such cases, control actions become complex due to interactions between the elements of the controlled system (e.g. glare requiring blind repositioning, causing luminaire actuation, leading to increased cooling loads and so on). The types of control that may be suited to simulation-assisted control were identified as follows:
• for control with significant look-ahead times (hours, rather than minutes) such as decisions on night ventilation strategies;
• for high-level supervisory control, e.g. load shedding, where several alternatives and their implications for environmental conditions (particularly occupant comfort) may need to be evaluated;
• where interaction is high, e.g.
blinds/lighting/cooling; and
• where the building use varies or changes, e.g. large variations in occupancy and where this variation is known in advance.
The SmartHomes infrastructure is well suited to control applications of these types where rapid response times are not required, where there is time to undertake a number of simulations in real-time to determine optimum control strategies, and where the simulation program may be remote from the building energy management system.
In the previous pilot project, data was collected by a data acquisition system, and used as input in real-time to the ESP-r simulation program. A number of simulations were run to determine the optimum start time for a heater to bring the room temperature to a particular set-point at a certain time. Work is
currently underway to treat data collected by e-boxes as input to ESP-r, and to transfer the simulation-predicted control action back to actuators via the SmartHomes infrastructure.
VIRTUAL METERING
Fujii and Johannesson (2003) describe the development of a method where simulations are combined with measurement of parameters for each apartment in a multi-family dwelling as a basis for individual energy billing. Because of the cost of individual metering, global measurement of the heating and hot water use in apartment blocks is common in some EU countries, with individual bills based on apartment size.
The authors report a technique for a fairer system of billing based on actual energy use. The idea is to employ a limited sensor set (air temperatures and relative humidity of exhaust air from individual apartments) connected to an e-box, with data transmitted over the Internet and used as an input to a simulation program. This program estimates the heating and hot water requirements of the individual apartments based on knowledge of building parameters, meteorological data and global apartment block energy use.
The system, based on the SmartHomes infrastructure, is currently being field-tested. A more equitable billing system together with personalised energy use information provides a significant incentive for energy saving.
LARGE SCALE ENERGY
MANAGEMENT
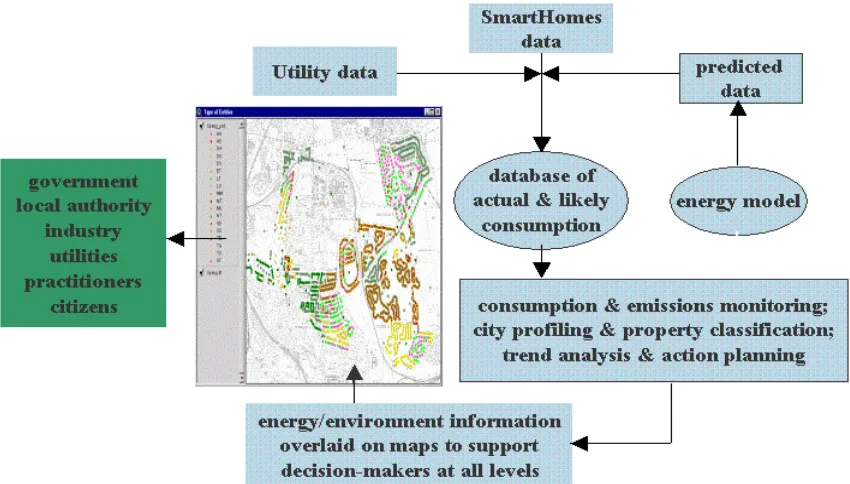
The technology described above is particularly suited for large-scale energy management, selecting priorities for energy reduction measures based on specific monitored energy use. However, in practice, it is unlikely that all properties can be monitored for a variety of reasons – cost, access, data confidentiality, sensor failure etc. In such cases, it is desirable to use simulation to cover the gaps to provide comprehensive datasets.
To assist with interpretation, a Geographical Information System may be employed to overlay the energy and environment information on conventional types of information such as street layouts or power cable routings. To assist with policy formulation, an energy simulation model is included to enable an appraisal of options for change. Where an option proves beneficial, its predicted fuel use may be returned to the database to be held alongside the present fuel use data. This enables the side-by-side display of information relating to present and future states in support of extensive inter-comparisons before deployment decisions are taken.
By modelling proposed measures prior to their deployment, alternative options may be compared in terms of relevant criteria, including the impact on the energy supply system and the mitigation of greenhouse gas emissions. Furthermore, the impact of previous actions is implicit within the monitoring process so that schemes with a poor return can be quickly discarded and those with a high return retained.
DEMAND-SUPPLY MATCHING
Current energy policy promotes the increasing use of renewable technologies for electricity generation. The technologies being deployed to satisfy this are inherently stochastic in operation, e.g. wind and hydro-power. This results in random variations in the quantities of power delivered. If the electrical supply system integrity is to be
maintained during these variations, a greater level of control over both the supply and demand side will be required. As the renewable technologies are typically connected into the electrical supply infrastructure at distribution and supply working voltage (<132 kV), higher levels of local network penetration (>25%) will require greater levels of control if network integrity is to be maintained. This control can be:
• demand-side focused, so that a proportion of the demand load can be shed as the supply availability falls; and the demand increased as output from the supply increases; or
• demand- and supply-side focused, so that supply output can be restricted when there is insufficient demand to absorb the excess power supplied.
In either of these control scenarios, the ability to predict both the demand and supply magnitudes will be crucial so that necessary actions can be implemented within the required time scales to maintain network stability. The use of simulation is crucial in achieving this as it can predict:
• the magnitude and rate of change in demand, based on trend and climate analyses; and
• the magnitude of the power supply from renewable generation plant based on weather trends.
[image:6.595.86.511.379.621.2]for the purpose of building service plant control. However, the time steps and response time characteristics for building services control are considerably longer, in the order of minutes as opposed to seconds as required for electricity demand-supply control and matching.
A Real-time Embedded Dispatch Manager (REDMan) algorithm is under development (Conner 2003) to enable the predictive simulation and control required for the integration of small heterogeneous renewable supply technologies and electrical power demand supply matching. The focus is on single dwellings and small community applications.
REDMan comprises sources of power, demands of power, a central dispatcher, and a communications system, which allow messages to be passed between them. Physically, it consists of several computer programs (agents for sources and demands, plus a dispatching program) running on one or more computers or embedded controllers.
These programs consist of real-time supply-load simulation tools interconnected by the SmartHomes Internet connection. Within this framework, the controller serves to prioritises supply-load matching as follows. (The algorithm for the REDMan approach to prioritising supply-load matching is shown in Figure 4.)
• A source (generator) must advertise to the dispatcher the maximum amount of power it can supply, and its per-unit price. The source will then be informed of the amount of power required of it, and must then supply that amount. The amount of power required may change at any time and may be any amount between zero and the advertised maximum.
• In advance of switching on, a demand (load) must state the amount of power required and the maximum per-unit price it is prepared to pay for the fulfilment. The demand will then be informed as to whether or not it can be fulfilled at that price. If so, it may proceed; if not, it must remain off, or resubmit at a different price.
• This information is supplied to a dispatching algorithm whose goal is to buy energy from sources and sell it to demands in an optimal manner, or as close to optimal as possible. The recommended algorithm is a simple rule-based one, which strikes a compromise between complexity and degree of optimisation.
• The price that the demand submits to the dispatcher is the price it must pay, irrespective of how much the dispatcher paid for the electricity in the first place.
The network may contain several such dispatching algorithms, each dealing only with sources and demands local to itself. The system of algorithms and local sources/loads is named a 'domain'. To interconnect different domains, two connections are used so that each domain appears to the other as if it were one source and one demand.
CONCLUSION
It is likely that the widespread adoption of broadband will open the possibility of new energy and environmental services that can be operated on a large scale. Such new information sources have the potential to deliver benefits to citizens and professionals such as energy managers, designers and planners. This paper has indicated the range of possible services and has focused on how simulation can assist in their implementation.
In particular, the uses outlined include:
• assisting in control of building services, either through the direct use of a simulation program or through indirect use in training artificial neural networks;
• providing virtual data to augment monitored data (virtual metering) – either at the large scale in creating comprehensive databases of estate energy use, or at the small scale in ensuring equitable billing for multi-family dwellings; and
• assisting demand- and supply-side matching and control required with the move towards distributed energy generation.
Inherent in all the internet-based energy services discussed is the need for large quantities of data. For these services to be adopted, it will require significant effort in ensuring sensor and instrumentation reliability together with the implementation of quality control procedures for data processing.
ACKNOWLEDGMENTS
REFERENCES
Clarke J A, Cockroft J, Conner S, Hand J W, Kelly N J. Moore R, O'Brien T and Strachan P (2001) 'Control in Building Energy Management Systems: The Role of Simulation', Proc. Building Simulation 2001, Rio de Janeiro, pp99-106.
Conner S (2003), ‘Distributed Dispatching for Embedded Generators’, PhD thesis, ESRU, University of Strathclyde, Glasgow.
Fujii G and Johannesson G (2003), ‘Energy Simulation Combined with Indoor Climate Measurement as a Basis for Individual Energy Billing in Multifamily Houses’, Proc. Building Simulation ’03, Eindhoven.
Lindfors A, Westergren K-E and Lilliestrale M C J (1998), 'An Internet-based System Suitable for European-wide Monitoring of Building Energy End Use', Proc. EPIC '98, Lyon, pp606-11.
Open Services Gateway Initiative (OSGi) 2002, http://www.osgi.org.
[image:8.595.157.426.285.701.2]Westergren K-E, Högberg H and Norlen U (1998), 'The Energy Barometer - A New System for Monitoring Energy Use in the Housing Stock', Proc. CIB World Building Congress 1998, Gavle, Sweden, pp7-12.