Briefing Paper
A SKETCH OF THE ECONOMIC CONSEQUENCES OF THE GULF WAR by A J Hughes Hallett,Department of Economics,
University of Strathclyde and CEPR London
and Yue Ma, Oepartinent of Economics, University of Strathclyde
1. The Issues 2. An Economic Model The economic analysis of a war involves two
separate but interconnected issues. There is the question of how to finance the necessary expenditures on men, materials and weapons; and there is the question of how the financing of those expenditures, and how the loss of productive capacity, or the interruption of trade or normal financial relations, will affect the combatant's economy and its main trading partners. The former requires an assessment of the costs, in terms of resources, needed to prosecute the war successfully, and then a judgement on the best way of supplying those resources. The latter focuses on economic consequences in terms of incomes, investment, supply capacity and prices, and also in terms of conditions in the financial and foreign exchange markets. Keynes made the point, in an earlier context, when he gave two of his books the titles "How to Pay for the War" (1940) and "The Economic Consequences of the Peace" (1919).
The British and American governments have evidently thought a lot about how to pay for the Gulf War, and their effort to obtain financial contributions from non-combatants in the OECO, and from Gulf Co-operation Council countries, have been fairly successful. In recent days they have also thought - in strictly political terms - about how to win the peace, after winning the war. But what they have not done, at least at an official level, is to consider the economic implications of the Gulf War. The ability to win the peace, and the willingness of other countries to support new arrangements designed to produce more stability in the region, must surely depend in part on the economic situation created by the war. This note projects the likely consequences of the war for the OECD countries, together with some of the indicators for the Gulf countries and the developing economies (LDCs).
To generate the necessary projections, we have used a "state of the art" econometric model - in this case the International Monetary Funds' (IMF) multicountry model, MULTIMOD, which contains
interest rates, fiscal variables etc. The model was last updated and re-estimated by the IMF's research department in 1990.
3. The War Scenarios
We have simulated 4 possible scenarios over the period 1990-95.
a) No invasion, no war: a baseline simulation over the period 1991-1995, which sets the price of oil at $20/barre1 (the pre-August 2 price) in 1990, $21 in 1991, $22 in 1992 and so on up trend. All other exogenous variables are taken to follow the IMFs official projections as published in the World Economic Outlook for 1990. This baseline is then the model's projection of the future, given that World Economic outlook and no further policy changes.
b) Sanctions but no war: As above, but where the oil price averages $26 per barrel in 1990, $35 per barrel in 1991, and floats freely with no constraints to demand and supply thereafter: i.e. Iraqi and Kuwaiti oil production is lost August 1990 - December 1991, but comes back on stream in 1992. Fiscal expenditures also increase by $18bi11ion, $1bi11ion and $0.6bi11ion in the US, UK and France, respectively, to reflect the build-up of forces in the Gulf. But there is no fighting to increase those expenditures any further.
c) A Short War of 2 months duration: (and no The oil
but attacks on Saudi oil installations)
price averages $26 in 1990 as above falls to $15 in 1991 as strategic stocks are released, followed by the Kuwaiti and Iraqi oil fields coming back into production to generate cash for reconstruction. The oil price floats freely from 1992 onwards. Fiscal expenditures are larger and consist of the start up costs above, plus $45b for the US over the 2 month period; UK $4b for 2 months; and France $1.8b for 2 months. We suppose that 25% of these expenditures enter domestic expenditure; and 75% don't (i.e. 25% are spent directly on goods/services/extra salaries etc; 75% is written off for equipment used).
d) A Long War of 9 months: (with some damage to allied oil facilities). The oil price
averages $26 in 1990, and $50 in 1991 (Saudi production is interrupted, say), but $20 in 1992 (with the war finished, production comes back to normal in 1992 to pay for economic and political reconstruction), and a free float thereafter. Fiscal expenditures run at 9/2 times the 2 month figures above, i.e. $204billion for US, $18billion for UK, $8billion for France, plus the same start up costs.
Both war scenarios have been simulated with and without fiscal contributions from other countries. In both scenarios, those contributions run at their currently announced levels:
Japan $13billion ($11b to US, $1b each to UK and France)
Germany $8billion ($6b to US, $1 bill ion each to UK and France)
Gulf Co-operation Council Countries $27billion ($22billion to US, $2^billion each to UK and France).
These contributions reduce the fiscal deficit of the recipient but increase it for the donor. They pass through the balance of payments, and hence potentially affect exchange rates and interest rates. Aggregate fiscal expenditures by the combatants themselves remain unchanged of course.
Each country faces a budget deficit constraint (i.e. governments have to finance and pay interest on the fiscal debt). In most cases this forces tax rates to rise (with a lag). For political reasons, and in view of the emerging recession in the US and the UK, we also simulate what happens if taxes are not allowed to rise. This is important for the US, given its large existing fiscal deficit.
4. The General Pattern of the Results
loss of confidence is felt in the financial
markets because the war goes on longer than
people expected]. The long war results are
not so much influenced by the expenditures
being 4^ times higher, or by the
contributions from other countries, as they
are by movements in the oil price. A long
war does mean an extra 1% GNP growth and an
extra 1% on the inflation rate, plus some
difficulties in financing the fiscal deficit
in the US. But those expenditure effects are
"second order" compared to the "supply side"
effects of any oil price changes which affect
unit production costs right across the
economy. The same is true for the UK,
France, Germany and the smaller
industrialised countries, although without
the accompanying fiscal deficit problems.
The extra growth implied by a long war would
neatly remove the current recession in both
the UK and US.
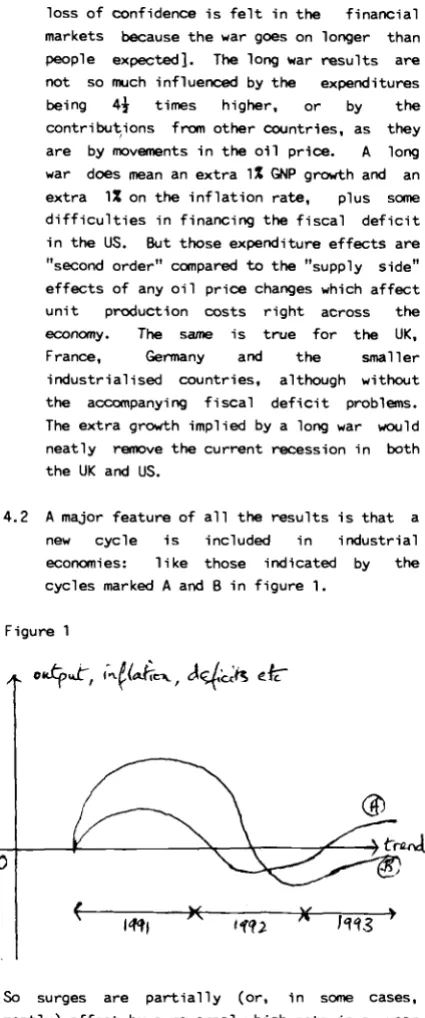
[image:3.530.76.289.56.566.2]4.2 A major feature of all the results is that a
new cycle is included in industrial
economies: like those indicated by the
cycles marked A and B in figure 1.
Figure 1
tmrA.
*
JW*
So surges are partially (or, in some cases,
mostly) offset by a reversal which sets in a year
or two after the war finishes because oil prices
revert to roughly pre-war levels (and also because
fiscal expenditures slow down). This leaves some
variables a bit higher than their pre-war levels
and others back on trend. Thus equilibrium growth
is re-established from about 1992 onwards (in the
case of a short war), and from 1994 (long war) if
the war is a long one. The only exceptions appear
the US and UK, where the cycles persist beyond
1995.
4.3 The main effect of constraining taxes not to
rise is to spread the deficits over several
years (up to the end of 1994). The burden of
this debt has the effect of slowing down
growth in 1994/1995. But the lower tax rates
also imply less of a swing into "recession"
in the year following the war (1992)which in
this case only means lower growth rates than
in the baseline "no war" scenario. It also
means the inflationary impact of the extra
expenditures is somewhat milder. Hence the
swings sketched in figure 1 are milder and,
in the case of the fiscal deficit, they are
removed altogether. However all these
changes, compared to the case where tax rates
are allowed to adjust up, are rather small
-perhaps 0.2% off the growth rate and 0.1% off
the inflation rate.
5. Results for the Industrial Countries: A Short
War
The most striking result of a short war is that
the industrialised economies are disturbed very
little. Compared to the no war baseline
projections, they all lose about 0.2% of GNP in
1991 with a corresponding reduction in their
inflation rates. This loss of output and
reduction in inflation is coming from the increase
in oil prices in 1990 which outweighs the mild
fiscal stimulus in 1991. For the US and Japan the
economic slow down is even smaller; about 0.1% off
GNP and prices. Slower growth naturally means
small improvements in their trade balances, except
in the UK where a further deterioration in the
trade balances appears because oil (export)
revenues fall E^billion with the oil price in
1991.
Thus a short 2 month war has no significant financial or income implications for the OECD economies. Naturally it has some effect on the Gulf countries, where national incomes fall by 0.3% in 1991 (but recover in 1992). And the LDCs benefit from lower oil prices (output prices fall by 0.7%) although that has no impact on growth since the greater availability of foreign exchange (in the form of higher net export earnings) are pre-tempted by the need to service debt.
6. Results for the Industrialised Countries: Long War
rise very mildly in nominal terms. Given greater extra inflation than the other G7 countries, and that this rise is apparently not connected with the oil price, this result reflects our inability (under ERM rules) to depreciate the nominal exchange rate compared to our partners. That is something of a constraint because the current account remains in deficit, by 0.4% of GNP more than would have been the case had there been no war.
b) Contributions to the War Costs (table 2) a) The Financial Implications (table 1)
* A long war adds about 2\% - 3 } % of GNP onto US fiscal deficit in 1991 i.e. nearly doubling it by adding an extra $95 - $130billion to the existing deficit.
* A long war makes the UK fiscal deficit rise to i% GNP in 1991; but we start from small surplus so it does not have any great implications for interest rates, investment or the exchange rate. From 1992-5, the budget shows a small tendency to return to surplus given the faster growth from lower oil prices (and despite the lower tax take from lower oil revenues).
* Both fiscal deficits are reversed from 1992 onwards; for the US, the deficit is then running at about 0.6% of GNP (or $23billion) lower each year than it would have been in the no war case [because, as oil price falls, output rises, and fiscal receipts rise]. A similar pattern holds for the UK. However tax rates have to rise 1% in both the US and UK in 1992, 1993 and 1994, in order to offset the US deficit increase and the emerging deficit in the UK.
* Difficulties in financing the US fiscal deficit pushes the effective exchange rate for the US dollar up 1% in nominal terms. The trade gap widens a little therefore (see below).
* The UK exchange rate is projected to
In the long war scenario, contributions from non-combatants make little difference (-0.1% to GNP, -0.1% to inflation rate) except in so far as they reduce the US budget deficit in 1991 and 1992. They also reduce the UK deficit; but increase the deficits in Japan, Germany by ^% of GNP. The only other effects are slightly higher interest rates in France, and a fall in the real Japanese exchange rate (which is then reversed in 1994/5).
If there are no contributions from others, the US deficit increases by an extra 3/4% of GNP (from 2.8% to 3.5% of GNP). That is a lot. For UK the extra expenditures come to about 0.4% of GNP. But if there are contributions, Japan's deficit rises by 0.4% of GNP, and the German deficit increases by about 5% of GNP. These are large figures; but they are for 1991 only, and vanish thereafter since extra taxes and extra growth then offset the extra expenditures. In the short war the fiscal deficits run at get about 40% of these increases. So you don't get away from financing problems even in a short war.
now know that those expenditures were grossly
underestimated, but this deficit increase is the
same size as the emergency reunification funding
package introduced by the German government on 12
February 1991. It was not easy to secure funding
for the emergency package and we can expect
similar upward pressures on interest rates when
the war contribution is funded.
Interest Rates, Investment and the ERM (tables 1
and 2)
c) Short term interest rates rise in the US by
li% points in long war (but the long rates
only rise i% point) in 1991 and 1992; they
then fall below the pre-war 8% mark. The
UK short and long rates are not affected
because there are no great financing
difficulties. German short rates rise "I%,
reflecting the tight monetary policy needed
to control inflation following reunification
and the extra growth from the war. Japan has
a similar reaction, raising interest rates
1%. Contributions to the war costs hardly
affect these interest rate changes.
d) Some crowding out of private investment
appears from higher interest rates; US
investment falls i% below pre-war trend. The
higher interest rates means a higher Dollar
in real and nominal terms. That makes the US
trade deficit 0.7% GNP (say $25bi11ion) worse
in 1991; it then gets better from 1992
because the dollar depreciates again once
the wartime fiscal expansion is reversed.
In the UK, investment is not affected by
higher interest rates although there is
evidence of a worsening trade deficit.
German and Japanese investment rises slightly
despite the 1% rise in short term interest
rates which results from the tight monetary
policy needed to control inflation and the
extra growth generated by the war. France,
however, adopts a less anti-inflationary
policy (interest rates rise only ?%) despite
a larger fiscal deficit in 1991. The result
is higher inflation than in Germany and
strains within the European exchange rate
system (ERM).
In fact table 1 shows that the real effective
exchange rate for the DM moves very little
(and that is not affected by making
contributions to the war costs: see table 2 ) .
By contrast the Pound and Franc rise, after
an initial dip, in response to the higher
interest rates forced by the need to fund
their extra fiscal expenditures. The US also
has a rising exchange rate while interest
rates are high due to deficit financing
(1991/2), but a falling exchange rate as that
deficit is reduced. Japan, like Germany, has
no significant movements in its real exchange
rate - unless contributions to the war costs
are made, in which case the Yen first
depreciates and then appreciates as those
contributions are successfully financed.
Thus, on a bilateral basis the ERM shows
distinct strains since the DM has to move
more against the other European currencies
(the Pound and the franc) then the other
countries move against each other. The
strain therefore comes from the Mark being
out of step, and not from weakness elsewhere.
Indeed, it is because the Yen only shows the
kind of realignments which are needed from
the Mark when the additional fiscal deficit
of contributing to the war costs is imposed,
that we know see that it is inflationary
pressure and the burden of financing German
reunification (not the war costs) which is
causing difficulties in the ERM. By
contrast, the DM requires realignment whether
or not war contributions are made. The
difficulty is that the rules of the ERM game
effectively rule out realignments which means
the Pound, Franc, Lire etc all have to
follow, with their interest rates, the DM's
rise against the Dollar and Yen. Thus any
economic expansion that might have spilled
over from increased demand in Germany, or
from the war effort, is more likely to spill
over to the US and Japan than to other parts
of the EEC. That would mean the combined
impacts of German reunification and war costs
would produce a recession in the UK and
France, in place of some expansion all round,
and hence significant strains within the
European Monetary System. Nonetheless
realignments within the ERM would have to be
significantly smaller than those of the ERM
currencies against the Dollar.
i) Growth/inflation in a Long Mar (table 1)
oil prices.
* The UK position is similar: an extra 2% output in 1991 (the oil price rise contributes to this too). That would remove our recession. But the extra growth vanishes in 1992 as the oil price and expenditures both drop. It reappears at i% p.a. in 1993-5 on the back of lower oil and production costs. That is a more pronounced cycle than in the US.
* Output rises in the US and UK because fiscal expenditures rise, but the drag from the associated fiscal debt does not cut in until some time later (growth only turns negative in 1992-3). But it also comes because producers and consumers anticipate income growth and
lower oil prices (or production costs) in later years. That makes it worthwhile to increase activity and stock up in advance, and provides a greater impulse for growth.
+ The extra GNP growth also gets reversed (partially) during 1992 and 1993. Typically i-3/4% of GNP is knocked off each year (say $20-30billion) in the long war case. There are also reversals in a short war, but they are small (0.2% GNP).
* France and Germany get extra 1% growth in 1991 and that tails off. That is an awkward result for Germany whose economy is already growing at 5% and is suffering significant excess demand as a result of the reunification process. It is noticeable that German growth is not reversed during the 1991-1995 period. This extra growth will not make it any easier for the German authorities to control inflation.
* Japan gets much less out of this; production averages less than i% above the no war baseline solution with no evidence of a recession, while prices run at a similar rate below their no war path. Elsewhere the war has little effect.
* The extra growth of 0.4% in Japan is
slightly more than its proposed contribution to allied war costs; the extra growth of 1% in Germany is not quite twice its proposed contribution. The German and Japanese growth must come from lower oil prices, and hence lower production costs, and increased inter-OECD trade since their domestic fiscal expenditures do not rise.
* US inflation: an extra 1^% in 1991, but that is more than reversed when fiscal expenditures are reversed and oil prices fall in 1992.
* UK inflation: an extra 2% in 1991 but not fully reversed later. That is likely to cause further difficulties for the UK economy since it means that interest rates do not fall as much as in other countries in the 1994-5 period. * French inflation: an extra 3/4% in 1991 * German inflation down i% because of very
aggressive monetary contraction (interest rates have risen 1% with no fiscal expansion). As we recently saw last week, Bundesbank policy is determined to kill inflation. Japan also enjoys a lower inflation rate. * Contributions to war costs make no
material changes to these figures.
level, because the emerging surplus of 1993-5 is smaller. Otherwise tax restrictions have no material effect.
7. The Reconstruction of the Gulf Countries A much neglected implication of the war is the opportunities for construction and manufacturing firms in the OECO to participate in the reconstruction of Kuwait and Saudi Arabia (and conceivably also Iraq). With the war unfinished, it is impossible to know how much reconstruction will be needed. However one figure which has been discussed is $60 billion for the Kuwait area. If the allies were to be awarded reconstruction contracts of that size, split in proportion to their long war costs and spread over the three years 1992-4 inclusive , the likely outcomes change in three interesting respects.
First, the cycle imposed on GNP and income growth in other exercises is now largely removed. Reconstruction can only have an impact from 1992. But when it appears it removes the 1992-93 downswings in national income, which appeared in reaction to demobilisation and the costs of financing the fiscal deficits (higher interest rates etc.). For the US,the 1% of national income that was lost during the 1992-93 downswing is now turned into a tiny gain (0.1%) on the underlying trend. In relative terms that may be small, but it is worth about $40 billion a year. By 1995 the effect will have been lost (growth falls 1/2%) because the reconstruction "boom" will have passed but the deficit financing costs still have to be carried.
The pattern for the UK is very similar; incomes/output rises by 0.6% in 1992 (instead of falling below trend) and remains 0.3% above trend until 1995. But the effects on France, Germany and Japan are different. France and Japan show little impact; for Germany the GNP cycle is smoothed, giving a steady decline from 1991's peak.
So the US and the UK both gain in the period 1992-93 - a matter of great political significance since both governments have to face re-election by 1992. There are other small changes, for example inflation rises 0.5-0.25% point in the US and UK in 1994, but interestingly there is no material change in interest rates or the fiscal deficits.
The second impact of the reconstruction contracts
would be a rise in the US dollar - its effective nominal rate rises 3/4% in 1992, and is still 1/2% higher in 1995, as a result of the extra exports generated by reconstruction. Interestingly the same effect is not seen elsewhere; the Pound, Franc and DM do not move, while the Yen falls 1/3% throughout because Japan does not participate in the reconstruction. Similarly the US and UK trade balances improve 0.5-0.25% of GNP), with minor positive changes in France, Germany and Japan. That confirms a small revival in world trade has been generated, but that does not take the pressure off the ERM which we noted earlier.
The third and biggest consequence of reconstruction is that the Gulf countries no
longer lose incomes at the rate of 2 to 2.5% over 1991-95. In fact they only lose 0.4% in total over 1991-94, but record a loss of 1.8% in 1995 when reconstruction stops. They are therefore 11.5% (or $62 billion) better off than in our previous scenarios. This may seem a strange result since they have to "import" their reconstruction - but they have to finance it too. This they do by pumping oil, causing the price of oil to fall further in 1993. Since the demand for oil is relatively elastic, Gulf country earnings (and presumably tax revenues) and hence GNPs actually rise. That explains their improvement; and the anticipation of further oil price falls in 1993 is the mechanism which pushes OECD incomes up in the politically sensitive year of 1992.
8. Gulf countries with no reconstruction
Growth slower by about 2% pa as a result of the war - because they are contributing to the costs of fighting and then because the oil price falls, so their GNP and revenues start to fall from 1992 onwards compared to pre-war trend. Growth slows in 1991 too, because high oil prices damp world demand. This negative effect on incomes continues until 1995, and possibly beyond.
9. Conclusion
share since supplies will ultimately meet demands
at a certain price whoever controls the supply
side. The important point for the West and the
developing countries, as well as for the Gulf
countries, that that price should be a free market
price so as to increase growth and improve the
distribution of the world's productive resources.
Hence, as far as oil is concerned, it is the
pricing structure rather than ownership, whether
direct or surrogate, which is at issue.
Footnote
Table 1:Long War, No Fiscal Contributions by Non-combatants or Gulf Countries
1.3
1.4
- 0 . 2
1.6
0 . 9
- 0 . 7
3 . 5
- 0 . 7
- 0 . 5
0 . 1
1.0 0 . 2
- 0 . 1
- 0 . 2
- 0 . 2
- 0 . 7
0 . 3
0.2
- 0 . 5
- 0 . 1
- 0 . 7
0.6
- 0 . 7
0 . 3
- 0 . 6
- 1 . 0
0 . 0
- 0 . 8
1.0
- 0 . 6
0 . 2
- 1 . 0
- 0 . 9
0 . 1
- 0 . 7
1.9
2 . 3
•0.1 0 . 4
•0.4
1.3
1.1
- 0 . 1
- 0 . 9
0 . 1 0 . 3
0.1
0.2
- 0 . 1
0 . 5
- 0 . 8
0 . 3
- 0 . 1
0 . 4
0 . 4
- 0 . 4
0 . 7
- 0 . 6
0 . 2
- 0 . 3
0.6
0 . 4
- 0 . 3
0 . 5
- 0 . 2
0.1 - 0 . 3
0 . 4
0 . 3
- 0 . 2
United States: 1991 1992 1993 1994 1995 GNP
Pri ces Investment
Short Interest Rate Nominal Effective Exchange Rate Trade Balance
Fiscal D e f i c i t
United Kingdom: GNP
Prices Investment
Short Interest Rate Nominal Effective Exchange Rate Trade Balance Fiscal Deficit France: GNP Prices Investment
Short Interest Rate Nominal Effective Exchange Rate Trade Balance
Fiscal D e f i c i t
Germany: GNP Prices Investment
Short Interest Rate Nominal Effective Exchange Rate Trade Balance
F i s c a l D e f i c i t
0.7
0 . 7
-0.2
0 . 5
•0.4
•0.9
1.0
- 0 . 3
- 0 . 2
0 . 1
0 . 3
0.1
- 0 . 1
- 0 . 1
0 . 3
0 . 4
0 . 3
- 0 . 1
0 . 3
- 0 . 1
- 0 . 3
0 . 4
0 . 5
0 . 2
- 0 . 4
0 . 4
- 0 . 1
- 0 . 3
0 . 4
0 . 4
0 . 2
- 0 . 4
0 . 3
- 0 . 1
- 0 . 2
1.0
•0.6
•0.2
1.1
0 . 0
0.6
0 . 3
0.1
- 0 . 9
0.2
0 . 4
- 0 . 3
0.0
0 . 0
0.7
- 0 . 9
0.3
- 0 . 2
- 0 . 1
0.1
- 0 . 3
0.6
- 0 . 5
0 . 3
- 0 . 5
0 . 0
- 0 . 1
- 0 . 2
0 . 2
- 0 . 2
0.1
- 0 . 6
0 . 2
- 0 . 3
Table 1 (coot.)
Japan: GNP Prices Investment
Short Interest Rate Nominal Effective Exchange Rate Trade Balance Fiscal Deficit
1991 1992 1993 1994 1995
0.4
-0.5 -0.1
1.0 0.0
-0.6
0.3
0.2
-0.8
0.1 0 . 4
-0.3
0.0 0.0
0 . 5
-0.8
0.2
-0.2 -0.1
0.1
-0.3
0.6
-0.6
0.2
-0.5
0.0
-0.1 -0.2
0.3
-0.3
0.1
-0.6
0.2
-0.3 -0.1
Gulf Countries: GNP
LDCs
-0.2 -2.7 -2.1 -1.8 -1.7
GNP
Debt Service
-0.3 0.6
-0.6 1.7
-0.5 1.0
-0.4 0.0
-0.4 -1.0 Units:
GNP, annual growth rate in percentage points Prices, annual growth rate in percentage points Investment as a percentage of GNP
Short term interest rates in percent
[image:10.529.38.459.84.452.2]Table 2: Fiscal Deficits and Interest Rates with Fiscal Contributions from Germany, Japan, and the Gulf Co-operation Council in a Long War
United States: 1991 1992 1993 1994 1995 Fiscal Deficit
Short Interest Rates Nominal Effective Exchange Rate
United Kingdom: Fiscal Deficit Short Interest Rate Nominal Effective Exchange Rate France: Fiscal Deficit Short Interest Rate Nominal Effective Exchange Rate Germany: Fiscal Deficit Short Interest Rate Nominal Effective Exchange Rate Japan:
Fiscal Deficit Short Interest Rate Nominal Effective Exchange Rate
2 . 8 1.5 0 . 9
- 0 . 1 1.0
0 . 2
- 0 . 6 0 . 2 - 0 . 4
- 0 . 7 - 0 . 5 - 0 . 9
- 0 . 6 - 1 . 0 - 0 . 9
0.7 0.4 •0.4
- 0 . 1 0 . 3 0.1
- 0 . 3 - 0 . 1 0.4
- 0 . 3
- 0 . 3 0 . 5
- 0 . 2 - 0 . 3 0 . 4
0 . 8 0 . 5 •0.4
- 0 . 1 0 . 3 0 . 0
- 0 . 3 - 0 . 1 0 . 3
- 0 . 3 - 0 . 3 0 . 4
- 0 . 2 - 0 . 3 0 . 3
0 . 8 1.1 0 . 0
- 0 . 1 0 . 4 - 0 . 3
- 0 . 3
- 0 . 1 - 0 . 2
- 0 . 3 - 0 . 5 0.0
- 0 . 1 - 0 . 5
0 . 2
0 . 7 1.0 •0.6
- 0 . 1 0.4 - 0 . 4
- 0 . 2
- 0 . 1 0 . 0
- 0 . 2 - 0 . 5 0 . 4
Table 3: Fiscal deficits and interest Rates When There are No Fiscal Contributions, and No Tax Rises in US
or UK in a Long War
United States: 1991 1992 1993 1994 1995
Fiscal Deficit
Short Interest Rate
Nominal Effective
Exchange Rate
U n i t e d Kingdom:
Fiscal Deficit
Short Interest Rate
Nominal Effective
Exchange Rate
3.5
1.5
1.0
0.6
1.1 0.4
0.4
0 . 3
- 0 . 2
0.2
- 0 . 4
- 0 . 7
0.0
- 0 . 8 - 0 . 7
1.1
0.4
•0.5
0.0
0 . 3
0.0
- 0 . 1
- 0 . 1 0 . 4
- 0 . 2
- 0 . 3
0.5
- 0 . 1
- 0 . 3