PART B: ‘THE ANALYSIS OF DESIGN AND
MANUFACTURING TASKS USING HAPTIC AND
IMMERSIVE VR - SOME CASE STUDIES’
Subtitle
J.M. Ritchie**, T. Lim, R.S. Sung, J.R. Corney, H. Rea
Scottish Manufacturing Institute
Heriot-Watt University
Edinburgh EH14 4AS
lead to the analysis of design and manufacturing tasks at a level of detail not previously possible as well as giving usable engineering outputs. The haptic 3D VR study involves the use of a Phantom and 3D system to analyse and compare this technology against real-world user performance. This work demonstrates that the detailed logging of tasks in a virtual environment gives considerable potential for understanding how virtual tasks can be mapped onto their real world equivalent as well as showing how haptic process plans can be generated in a similar manner to the conduit design and assembly planning HMD VR tool reported in PART A. The paper concludes with a view as to how the authors feel that the use of VR systems in product design and manufacturing should evolve in order to enable the industrial adoption of this technology in the future.
Key words: Data logging, Chronocycle graphs, Haptics, Assembly planning, Therbligs, Virtual reality
1.
INTRODUCTION
An important requisite for any virtual reality application is the ability to track user interactions within the virtual environment. This is especially true for highly immersive systems such as the CAVE [1] where synchronization is required between objects in the scene and user interaction movements. To date, there are several different tracking technologies available ranging from 3D mice to exoskeleton suits, each with its own characteristics (e.g. accuracy, latency, working volume) to cater for a wide range of work flows. Depending on the tracking device, changes in user position and orientations can be recorded in terms of relative motion or with respect to a known reference system. For example, glove devices typically report relative motion of fingers but not global hand movement. However, for applications with tactile feedback, it is the tracked part that has greater importance.
2.
BACKGROUND
Various researchers have investigated sense of presence measurements, simulation validity and human performance, in an effort to assess the effectiveness of force-feedback virtual reality applications.
A classic example relates to peg-in-hole insertion operations. Rosenburg [2] carried out an empirical study where participants were asked to execute a peg insertion task through a telepresence link with force-feedback. Five different haptic overlays were tested which included virtual surfaces, virtual damping fields, virtual snap-to-planes and snap-to-lines. The results indicated that human performance was significantly degraded when comparing telepresence manipulation to direct in-person manipulation. However, by introducing abstract haptic overlays into the telepresence link, operator performance could be restored closer to natural in-person capabilities. The use of 3D haptic overlays was also found to double manual performance in the standard peg-insertion task.
Commercial force feedback interfaces have subsequently appeared, such as the Phantom arm [3], that allow user interaction with virtual environments through a stylus. Gupta et al. [4] investigated the benefits of multimodal simulation using virtual environment (VE) technology for part handling and insertion compared to conventional table-based methods, as presented by Boothroyd et al. [5]. The results showed that assembly task completion time increased in proportion to the complexity of the assembly operations required. However, the measured times were roughly double those required to carry out the operation in the real world. Although they employ two haptic arms their study is restricted to 2D simulations of the insertion operation. Significantly for the work reported in this paper the authors speculate that one of the contributory factors to task completion time was the lack of co-location.
Unger et al. [6] described an experimental arrangement for comparing user performance during a real and virtual 3D peg-in-hole task. The task required inserting a square peg into a square hole via a 6 DOF magnetic levitation haptic device and visual feedback. The goal was to understand human manipulation strategies.
cooperatively solve a motion planning query. By manipulating a virtual robot attached to the Phantom haptic device a sequence of paths were generated and fed to the planner. Haptic interaction comprised of tracking user motion, collision detection between haptic probe and virtual objects,
computing reaction forces, and force rendering. An obstacle-based
probabilistic roadmap method was used in conjunction with a C-Space toolkit to filter the haptically generated paths and generate collision-free configurations for the robot.
The sensory feedback capability of haptics lends itself naturally to tasks that require manual manipulation. Adams el al [8] conducted experiments to investigate the benefits of force feedback for VR training of assembly tasks. Three groups of participants received different levels of training (virtual with haptics, virtual without haptics, and no training) before assembling a model biplane in real world environment. Their results indicated that participants with haptic training performed significantly better than those without.
The HIDRA (Haptic Integrated Dis/Re-assembly Analysis) researched by Coutee et al [9] is a test bed application focused primarily on simulation of assembly procedures with force-feedback. Their intention was to provide a development perspective relevant to haptically enabled simulations. The research efforts of Seth et al [10] fall into the similar assembly/disassembly category of analysis via visualisation with haptic force feedback. These reported examples are particularly useful for applications that provide tactile information regarding assemblability at the design stage. However, there is little evidence of data logged in order to output assembly instructions.
Recent research points towards developing architectures for collaborative haptic virtual environments (CHVEs). Iglesias [11] Collaborative Haptic Assembly Simulator (CHAS) is one reported work that investigates assembly/disassembly simulation of mechanical components in a collaborative virtual environment. The system has the potential to manage large assemblies; unfortunately, they do not appear to have stored and managed the history of movements. A review by Ferreira and Mavroidis [12] on the application of haptics in nano robotics illustrates the advancement of VR and haptics. However, only the exploratory influence and the associated sensory advantages of tactile feedback are reported.
Generally, haptics remains as a facilitator in guiding spatial exploration rather than as an output of task planning and in more general terms, manufacturing information. Extrapolating the cognitive procedures relating to assembly tasks (and even tacit exploration of the virtual components) during user interaction will provide information to better a product’s design for manufacture and assembly (DFMA).
Logging and the reuse of the associated information as an engineering task analysis tool within virtual environments is central to this work; indeed, the application of these methods is similar to those applied by Ritchie et al in a number of engineering task analysis applications covering both design and manufacturing assembly processes as well as early knowledge acquisition [13].
3.
MOTION CHRONOCYCLES
Assembly planning remains an important and active area of research. As advances in technology allows for more complex geometries to be manufactured, so too has the degree of complexities increased when assembling components. In order to automate assembly procedures, it is useful to understand the cognitive insight of the human operator. A method that allows for such analysis is to track user-object interaction. The data obtained can then be plotted as a time-dependent profile describing motion together with position, orientation and velocity.
4.
IMPLEMENTATION
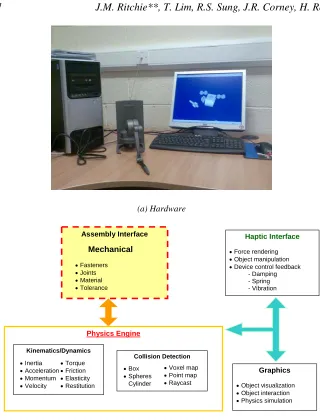
The HAMMS (Haptic Assembly, Manufacturing and Machining System) was developed as a test bed to investigate and measure user interactions and response while performing various engineering tasks in a virtual environment. The hardware comprises a Phantom haptic device for interaction with the virtual environment, along with a pair of CrystalEyes® stereoscopic glasses for stereo viewing if required (Figure 1a).The systems’
architecture is presented in Figure 1b and comprises the following
components:
• Haptics Interface: Sensable Technologies OpenHaptics® Toolkit [15], which provides device control for the Phantom Desktop and Omni, and supports polygonal objects, material properties, and force effects.
• Graphics Interface: The Visualization ToolKit (VTK) [16] is used for rendering graphics, image processing, and visualization.
• Physics’ Interface: AGEIA PhysX™ [17] technology provides the
physics engine that includes an integrated solver for fluids, particles, cloth and rigid bodies.
Central to HAMMS is the physics’ engine, which enables rigid body simulations in real time. State changes within the physics’ environment update haptic rendering and vice versa. As haptic rendering relies on real time collision feedback from the physics engine, it is important that where possible convex hulls and/or primitive shapes are used to represent the objects in the physics’ environment. The most important issue to address is the synchronization between the haptic and physics loops. Essentially, the physics loop runs at approximately 30-60 Hz while to create realistic sensations the haptic loop requires 1000 Hz. To avoid instabilities in force rendering, the input device and any rigid objects are uncoupled. Instead, the system uses the changing states in the physical simulation to influence the forces associated with the haptic rendering.
(a) Hardware
Assembly Interface
Mechanical
• Fasteners • Joints • Material • Tolerance
Haptic Interface
• Force rendering • Object manipulation • Device control feedback
- Damping - Spring - Vibration
Graphics
• Object visualization • Object interaction • Physics simulation
Physics Engine
Collision Detection
• Box • Spheres
• Cylinder
• Voxel map • Point map • Raycast
Kinematics/Dynamics
• Inertia • Acceleration • Momentum • Velocity
• Torque • Friction • Elasticity • Restitution
[image:7.595.59.379.74.494.2](b)Schematic
Figure 1. HAMMS hardware and schematic.
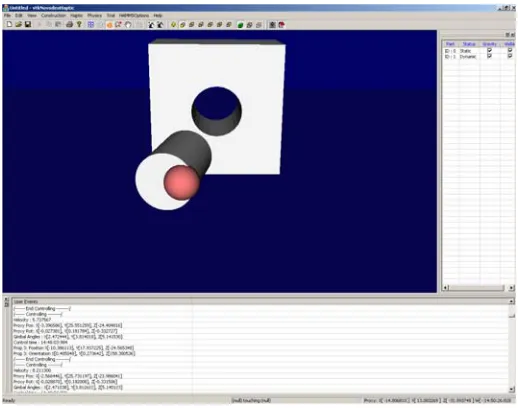
The HAMMS graphical user interface (GUI) is shown in Figure 2
HAMMS logs data for each virtual object in the scene including devices that are used for interaction. The basic logged data comprises position, orientation, time stamps, velocity and an object index (or identifying number). Figure 3 illustrates the color-coded therblig units adapted by HAMMS and its association to the logged data. By parsing through the logged data text files an assembly procedure can be automatically formulated.
[image:8.595.91.350.299.503.2]To visualize the data stream, large spheres are used to signify the start of an event, while smaller contiguous spheres indicate the direction, speed, and location of exploration or controlled displacements. Velocity changes are indicated by the separation of the spheres, i.e. sparsely spaced spheres equate to higher velocity. The line joining all spheres is referred here as the motion-time-line (MTL).
Green spheres represent wandering (therblig – find,
rest)
Large white sphere: - Start wander (therblig – search)
Blue spheres represent explorative interaction
(therblig – inspect)
Large blue sphere: - Start explorative interaction
(therblig - select)
Large red sphere: - Start control interaction (therblig – grasp, hold)
Red spheres represent object control interaction (therblig – position,
dis/assemble)
Sparsely spaced spheres indicate higher velocity
Cylinder A
Cylinder B: Original location
[image:9.595.67.372.80.308.2]Cylinder B: Translated
Figure 2. HAMMS colour coded therbligs. Large spheres signify a start event while small spheres represent motion. Green indicates search, find or rest. Blue represents selection and inspection. Red identifies control events such as grasping, holding, translation, dis/assembly operations. Note: The shadowed cylinder in the middle shows the original position of the
translated cylinder to the right.
5.
EXPERIMENTAL RESULTS AND ANALYSIS
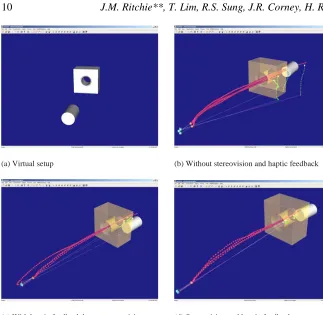
(a) Virtual setup (b) Without stereovision and haptic feedback
[image:10.595.54.377.74.389.2](c) With haptic feedback but no stereovision (d) Stereovision and haptic feedback
Figure 4. Peg-in-hole motion chronocyclegraph. Frames b, c and d show four successive pick and place motions. Object control time-lines are represented by a series of red spheres. Blue spheres indicate that the user was exploring the shape (touching or finding a picking location).
Green spheres indicate that the user was wandering (i.e. no interaction with virtual objects).
Figure 4 shows the results of tactile feedback and how it has influenced the user’s intent. Figure 4b clearly shows that without haptic feedback, tacit knowledge regarding the location of the peg as it passes through the hole is lacking, indicated by the sparsely separated object control lines (red spheres). However, when force cues are available, the user more accurately passes the peg through the hole (Figure 4c and d). The closely converging control lines indicate this as the peg enters the hole. Note also how the user has gained confidence about the environment (or workspace) when tactile information is available. Compared to the closely spaced red control spheres in Figure 4a, those shown in Figure 4c and d are well separated. This indicates that the user’s motion has quickened.
4a compared to the precise motions attributed to augmented tactile information of the latter experiments clearly show the user has learnt to appreciate force cues to complete the task.
The effects of stereovision can clearly be observed in Figure 4d. The start (pick) event and the entry (insertion) event have been markedly improved as indicated by consistent picking and direction of motion. With stereovision the learning process is fast tracked, as there is better depth perception, reducing the guesswork during picking.
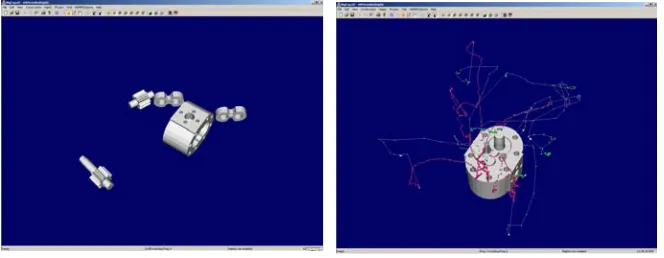
[image:11.595.58.390.238.367.2](a) Pump components (b) Assembly chronocycle and colour coded therbligs
Figure 3. Pump assembly chronocycle. Experiment was conducted with haptic feedback but without stereovision.
Unlike the majority of reported work on assessing and generating assembly plans in a restricted manner, the pump assembly experiment illustrated in Figure 5 was designed to be carried out with randomly placed components, rather than components whose final position was already known. This free-form type of assembly exercise is much closer to real-word assembly applications and novel in its application to assembly planning generation. Further, participants were not shown the actual assembly and had no prior knowledge of how each component fitted. Essentially, this test was about capturing a participant’s perception and intent. The experiment was carried out in both the real and virtual environments with a total of six participants participating.
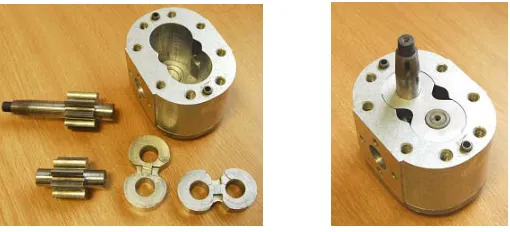
Figure 6a shows the components of a hydraulic gear pump while
the components in their own time. Note that the experiment is not about task completion time rather the objective is to gather information and understand how a human deduces the sequence of assembly and how they arrange the parts to fulfill their intent. Figure 4b presents the chronocyclegraph results and associated therblig units of one such participant. The experiment was conducted with haptic feedback but without stereovision.
[image:12.595.94.349.199.315.2]
Figure 6. The hydraulic gear pump: Components and assembled unit.
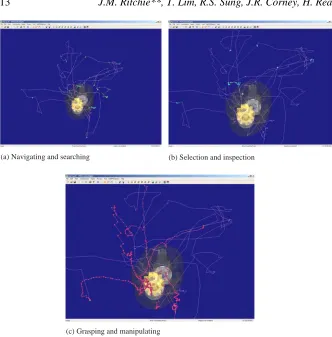
(a) Navigating and searching (b) Selection and inspection
[image:13.595.56.388.79.416.2](c) Grasping and manipulating
Figure 7. Chronocyclegraph analysis. The results indicate this participant has good shape perception and probably some knowledge on the functionality of each component. The MTL and therbligs show: (a) decisive navigation and (b) selection of parts, (c) the majority of time
was spent on manipulating parts for assembly.
Deciding best orientation of housing for the assembly process
[image:14.595.54.389.82.363.2]Pause, look, adjust, and placement
Figure 8. Identifying possible decision making from MTL and therbligs.
6.
GENERATING INSTRUCTIONS
The logged data can be parsed to extract assembly instructions. Table 1
presents the assembly sequence of the pump component layout shown in
Table 1. Pump assembly plan automatically generated by extracting logged data. The total virtual time for the virtual assembly operation is 89.1 seconds while the real world 23.7 seconds. The positions and orientations shown correspond to the assembled unit.
--- HAMMS TRIAL ASSEMBLY PLAN ---
Op Num W/Centre Assembly Instruction Tooling Assembly Time
Virtual (s) Assembly Time Real (s) 10 Assy Station Assemble Housing Pos(52.1973300,132.374680,303.486660), Ori(-27.220080,78.0677600,81.9269900) Hand Assembly
9.563 2.5
20 Assy Station Assemble Bushing Pos(34.1373200,136.032850,262.600090), Ori(-30.080830,90.2299900,91.6540300) Hand Assembly
14.625 2.75
30 Assy Station
Assemble Large Cog
Pos(36.0029300,5.65438850,198.076030),
Ori(-79.139830,47.5445600,48.3960900) Hand Assembly
19.156 3.35
40 Assy Station
Assemble Small Cog
Pos(87.9126700,17.4170450,275.344170),
Ori(15.4471330,95.0802800,90.5356300) Hand Assembly
28.859 12.0
50 Assy Station Assemble Bushing Pos(35.5983700,82.9755150,261.834560), Ori(-30.403610,94.2829200,91.7849300) Hand Assembly
16.906 3.6
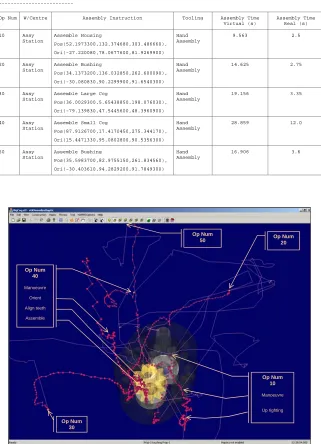
[image:15.595.56.385.165.330.2]Op Num 30 Op Num 10 Manoeuvre Up righting Op Num 20 Op Num 40 Manoeuvre Orient Align teeth Assemble Op Num 50
Figure 9 shows an overlay of assembly operations deduced from the logged data. This validity check is necessary in order to identify any discrepancies during the initial subjective interpretation of the MTL data. In this example, the bush associated with the assembly operation (Op Num 50) does not seem to be in the right place. Comparing to the bush’s location in
Figure 5a, the position of the bush when Op Num 50 begins is much farther away. The reason is that while manipulating the small cog (Op Num 40) there was a collision with the bush causing it to be displaced. Note that the position and orientation of each component in Table 1 correspond to the final assembled location.
Table 1 also lists the real world assembly times of each operation. Note that while the times reported are much faster the trend in relation to the virtual times compare favorably. Interestingly, the installation of the small cog is equally difficult both in the real and virtual environment. This is attributed to aligning the cogs for a proper fit while negotiating the tight contours of the housing and small tolerance of the bush. It is also important to realize that the real world experiment was performed using both hands in contrast to the single point pick-place mechanism of haptics. Even so, the timing trend remains in context.
As the experiment was designed without constraints or restrictions, participants were allowed to assemble the components in the manner they saw fit. Through observation and collected data, 90% of the assembly operations were sequenced in identical format as that described in Table 1.
Only 2 participants assembled the small cog before the large cog. However, there was no change in timing trends with regards to aligning and inserting the cogs. The time required to fit the second cog once the first was install was always more (approximately 10 times) regardless of environment. The only notable difference was when 1 participant assembled the bushings and cogs first before slipping the housing over them. While the times recorded were much less for the cog/bush assembly, the participant spent the majority of time (40 seconds real world; 65 seconds virtual world) locating and aligning the housing such that it could be slipped into position.
7.
CONCLUSION
analyzing the chronocyclegraphs and interpreting user movements and interactions there is considerable potential for analyzing manufacturing methods and formalizing associated decision-making processes. Understanding and extracting the cognitive aspects in relation to particular tasks is not trivial. In the HAMSS environment, it requires dissecting the elements associated to human perception both in terms of visual cues and kinesthesia. It is envisaged that by logging user motion in the manner shown and outputting an interaction pattern over a task, the derived chronocycle can be used to pinpoint areas of where and how decisions are made. HAMMS as a test bed for investigating human factors is still in its infancy and it is accepted that some areas, such as data collection methods and its visualization, can be improved. However, this early work indicated its potential as being much wider than simply validating assembly processes. The provision of auditory cues could also both further enhance a users experience and provide clues on how the human sensory system synchronizes and process sound inputs with tacit and visual signals.
The assembly planning and knowledge capture mechanism presented here is simple and easily embedded in specific engineering processes, especially those that routinely handle important technical task, risk and safety issues. It is important to acquire engineering knowledge as it occurs while preserving the original format and intent. Collecting information in this manner is a more cost effective and robust approach than trying to create new documentation, or capture surviving documents years after key personnel have left the programme. The potential for this has been amply demonstrated in this work.
References
1. C. Cruz-Neira, D.J.Sandin, T.A. DeFanti, "Surround-Screen Projection-Based Virtual Reality: The Design and Implementation of the CAVE," Computer Graphics (Proceedings of SIGGRAPH '93), ACM SIGGRAPH, pp.135-142, 1993.
2. L. B. Rosenberg, “Virtual haptic overlays enhance performance in telerpresence tasks,” Proc. SPIE Telemanipulator and Telepresence Technologies Symposium, pp.99-108, Boston, October 31, 1994.
3. T. Massie and K. Salisbury, “The PHANTom Haptic Interface: A
Device for probing Virtual Objects,” ASME Winter Annual Meeting, DSC-Vol. 55-1, pp.295-300, 1994.
4. R. Gupta, D. Whitney, D. Zeltzer, “Prototyping and Design for
5. G. Boothroyd, P. Dewhurst, W. Knight, “Product Design for Manufacture and Assembly,” 2nd Edition, 2002. ISBN 0-8247-0584-X. 6. B.J. Unger, A. Nicoladis, P.J. Berkelman, A. Thompson, R.L. Klatzky,
R.L. Hollis, “Comparison of 3-D Haptic Peg-in-Hole Tasks in Real and Virtual Environments,” Proc. of the IEEE/RSJ Int’l Conf. On Intelligent Robots and Systems, pp.1751-1756, 2001.
7. O.B. Bayazit, G. Song, and N.M. Amato, “Enhancing Randomised
Motion Planners: Exploring with Haptic Hints,” Proc. 2000 IEEE Int’l Conf. On Robotics & Automation, San Francisco, pp. 529-536, 2000. 8. R.J. Adams, D. Klowden, and B. Hannaford, “Virtual Training for a
Manual Assembly Task,” Haptics-e, vol. 2, no. 2, pp.1-7, 2001. (http://www.haptics-e.org)
9. A.S. Coutee, S.D. McDermott, and B. Bras, “A Haptic Assembly and
Disassembly Simulation Environment and Associated Computational Load Optimization Techniques,” J. of Computing and Information Science and Engineering, vol. 1, pp. 113-122, 2001.
10. A. Seth, H-J. Su, and J. Vance, “A desktop networked haptic VR
interface for mechanical assembly,” Proc. of IMECE’05 ASME Int’l Mech. Eng. Congress and Exposition, pp. 1-8, Nov. 5-11, Orlando, Florida, 2005.
11. R. Iglesias, S. Casado, T. Gutierrez, A. Garcia-Alonso, K.M. Yap, W. Yu, and A. Marshall, “A Peer-to-peer Architecture for Collaborative
Haptic Assembly,” Proc. of 10th IEEE Int’l Sym. On Distributed
Simulation and Real-Time Applications (DS-RT’06), pp.25-34, 2006. 12. A. Ferrieira and C. Mavroidis, “Virtual Reality and Haptics for Nano
Robotics: A Review Study,” IEEE robotics and Automation Magazine. In press 2006.
13. J.M. Ritchie, R.G. Dewar, G. Robinson, J.E.L. Simmons and F.M. Ng, "The Role of Non-intrusive Operator Logging to Support the Analysis and Generation of Product Data using Immersive VR", Journal of Virtual and Physical Prototyping, (June 2006) V1, n2, pp117-134.
14. B. Price, 1990, "Frank and Lillian Gilbreth and the Motion Study Controversy, 1907-1930". In: A Mental Revolution: Scientific Management since Taylor, Daniel Nelson, ed. The Ohio State University Press.
15. SensAble Technologies, Inc., 15 Constitution Way Woburn, MA 01801 (www.sensable.com).
16. The Visualization ToolKit (VTK). Kitware, Inc., 28 Corporate Drive, Suite 204, Clifton Park, New York 12065, USA. Available: http://www.kitware.com.
17. AGEIA PhysX. AGEIA, 82 Pioneer Way, Suite 118, Mountain View,