Abstract-- Increasing numbers of very small generators are being connected to electricity distribution systems around the world. Examples include photovoltaics (PV) and gas-fired domestic-scale combined heat and power (micro-CHP) systems, with electrical outputs in the region of 1 to 2 kW. These generators are normally installed within consumers’ premises and connected to the domestic electricity supply network (230 V single-phase in Europe, 120 V in North America). There is a growing need to understand and quantify the technical impact that high penetrations of such generators may have on the operation of distribution systems. This paper presents an approach to analysing this impact together with results indicating that considerable penetrations of micro-generation can be accommodated in a typical distribution system.
Index Terms— Distributed generation, Distribution networks, Micro-CHP, Micro-generation, Photovoltaics, PV, Cogeneration.
I. INTRODUCTION
NSTALLATION of micro-generators is set to increase rapidly over the next few years. Solar photovoltaic (PV) systems mounted on house roofs are already popular and their economics are becoming more attractive year on year. Gas-fired micro-CHP (cogeneration) systems, providing electricity, space heating and hot water, are now undergoing field-trails in houses in the UK. Their potential to replace traditional heat-only boilers is enormous.
Meanwhile, distribution network operators are concerned that their existing systems may be adversely affected by such generators, particularly when large numbers are connected in a close geographic region [1]. The main concern is that micro-generators may cause excessive voltage rise. The work presented in this paper is part of ongoing research to identify and quantify the effects of high-penetrations of micro-generators on distribution networks and to explore how these effects can be managed.
Micro-generators typically generate up to 1 or 2 kW, and are connected to the domestic electricity supply network, either through single-phase inverters or directly, in the case of some micro-CHP units. In the UK, domestic service connections are usually 230 V single-phase, taken from 400 V three-phase street mains, and known collectively as the
This work was supported by the Engineering and Physical Sciences Research Council, UK, project numbers GR/N35694/01 and GR/S00774/01.
Murray Thomson and David G. Infield are with CREST at the Department of Electronic and Electrical Engineering, Loughborough University, LE11 3TU, UK (e-mail: [email protected], [email protected]).
voltage (LV) network. Elsewhere, equivalent networks are known as secondary distribution. Traditional design methods for LV (secondary distribution) networks generally rely on
load diversity factors; these can be obtained from extensive load measurements, but more often are based on years of experience. Significant penetrations of micro-generation will alter diversity factors and introduce uncertainty in their applicability. Meanwhile, the power of modern computers allows us to consider a much more detailed and thorough approach to the analysis and design of LV networks, particularly with regard to micro-generation. The details we consider important are as follows:
First, individual house loads are highly variable in time and between houses, and the analysis must represent this variability. Our approach is to create and use high-resolution time-series data for each and every house and commercial property connected to the network. Statistical techniques, as exemplified later in this paper, are required to manipulate and present the large volumes of resultant data in a compact manner.
Second, most LV-connected loads are single-phase, and are never perfectly balanced across the three-phases. Indeed, significant imbalances are the norm when one looks in detail at LV distribution networks. Thus, neutrals are displaced and an unbalanced three-phase load-flow analysis is called for.
Third, large sections of LV (secondary distribution) networks are directly interconnected by the 11 kV (primary distribution) network through fixed-tap distribution transformers. A heavy load, or excessive generation, at any point on an LV network will have some affect on voltages throughout the entire LV networks served by that particular 11 kV feeder. The extent of the effect, and therefore a suitable boundary to the analysis, is set by automatic voltage controllers. In the UK, these are usually on-load tap changers at 33 kV to 11 kV primary substations. In other countries, voltage regulators are more common. A full analysis should encompass an entire feeder, which may include upward of a thousand connected customers.
In summary, the aim is to perform unbalanced three-phase load-flow analysis on complex networks using high-resolution time-series data. Modelling the effects of micro-generation is in comparison fairly straightforward.
Network Power-Flow Analysis for a High
Penetration of Distributed Generation
Murray Thomson and David G. Infield, Senior Member, IEEE
II. MODELLING
A. The Test Network
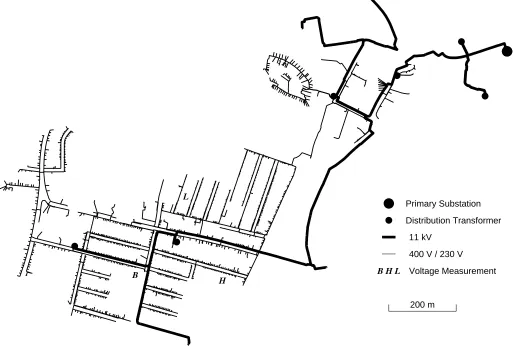
East Midlands Electricity (now Central Networks), a UK distribution network operator owned by E.ON, provided data describing networks in Leicester city-centre in the UK. The section selected as a test network is shown in Fig. 1. It comprises a complete 11 kV feeder and all associated LV networks (400/230 V). The primary substation is on the far right of the figure. There is about 4 km of 11 kV underground
cables providing power to six distribution transformers, which step the voltage down to 400 V. Of these, one is dedicated to a bank, and one to a hotel. The others supply public LV networks, which involve another 23 km of underground cables, including service cables to the customer connection meter points. In all there are 1262 connected customers, each of whom is a possible candidate for micro-generation. The network has in excess of 3000 nodes. There are no voltage regulators or shunt capacitors installed.
B
H L
200 m
Primary Substation
Distribution Transformer
11 kV
400 V / 230 V
[image:2.612.49.562.179.525.2]B H L Voltage Measurement
Fig. 1. Test network in city-centre Leicester, UK.
B. Load Modelling
The need for high-resolution time-series load data has already been mentioned, and, for this study, it was decided to use a one-minute time step. Representations of individual house loads minute by minute have been constructed, based on stochastic modelling work done by the Institute of Environment and Sustainable Development (IESD) at De Montfort University in the UK [2]. Reactive power consumption at each connection point has also been calculated on a stochastic basis.
C. Photovoltaic System Modelling
PV system output has been calculated based on one-minute direct and diffuse radiation data measured at Loughborough University, which lies about 20 km away from Leicester.
such that they would not experience any shading. In practice, some localised shading would be inevitable and would serve to temporarily reduce the output of individual arrays.
All PV arrays were assumed to comprise twelve BP Solar Saturn 180 Wpeak modules [4], giving an array size of 2.16 kWpeak. This power rating is for Standard Test Conditions (STC): irradiance of 1000 W/m2, Air Mass 1.5 spectrum and a cell junction temperature of 25 °C. The actual DC power output of each array for each minute of the selected days was calculated from the irradiance data described above, assuming a simple linear relationship. No allowance was made for differing spectrums. Cell temperatures were estimated using the NOCT method [5] based on measured ambient temperature (logged concurrently with the irradiance), and the DC output powers were then corrected according to the manufacturers’ temperature correction coefficient (–0.5 %/K). Inverter efficiency was modelled, based on the 1.8 kW SMA Sunny Boy [6], and maximum power point tracking (MPPT) was assumed perfect. As with most PV inverters, the AC output of the Sunny Boy has unity power factor.
D. CHP Modelling
Individual micro-CHP units have been modelled based on the WhisperGen from E.ON/PowerGen [7], which employs a Stirling engine driving a standard rotating electrical generator. The units are rated at 1.2 kWelec and they generate this power only when the gas burner is firing, which is controlled to suit the heat demand within the house. With a typical UK domestic heat demand, a WhisperGen will generate around 3000 kWh of electricity per year.
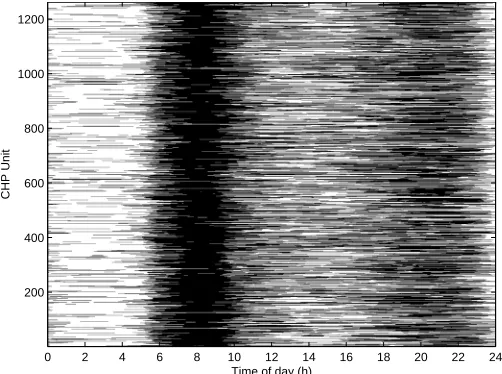
Measured data for space heating and hot water for 350 dwellings in the UK [8] was used to provide typical aggregated heat demand profiles. A stochastic algorithm was then used to create minute-by-minute firing patterns for the individual micro-CHP units. For a typical winter’s day, the operation of the maximum possible 1262 units that can be connected is shown in Fig. 2. The black bars indicate periods for which the individual CHP units are firing and therefore generating 1.2 kW each. As expected, very few of the CHP units are firing during the night, whereas almost all are firing during the morning peak.
Time of day (h)
CHP Unit
0 2 4 6 8 10 12 14 16 18 20 22 24
[image:3.612.313.564.47.234.2]200 400 600 800 1000 1200
Fig. 2. CHP operation for a typical winter day.
E. Network Modelling
The load, PV and CHP models outlined above provide input data for load-flow analysis, which calculates voltages and line loadings throughout the network. Commercial load-flow software packages were found to be ill suited to the complexity of the modelling and the need to repeat the calculations for each minute of the modelled days. Consequently, a new unbalanced load-flow engine was developed in Matlab [9], [10]. It is based on the forward/backward sweep algorithm developed by Shirmohammadi [11] and Kersting [12], but with modifications to allow for Dy11 distribution transformers, which are the norm in the UK. These transformers introduce a 30° phase shift, on top of the normal ±120° phase angles found in all three-phase systems. Correct computation of the exact angles throughout the network is not trivial and to give confidence in the new software it was tested against two commercial packages [13], [14], and found to be in full agreement.
The new load-flow engine was built into a time-domain simulation framework, also in Matlab, which presents it with the modelled load and generation data and saves the calculated voltages as minute-by-minute data for all nodes across the network. It completes the simulation of each day’s operation in approximately 20 minutes on a modest Pentium-4 laptop computer.
F. Validation
The central aim of the modelling is to quantify the voltage rise caused by high penetrations of micro-generation. It is therefore important to validate the load and network models that form the base-case. Acksen voltage loggers [15] were used to measure actual voltages, averaged at one-minute intervals at three houses on the test network, indicated B, H and L in Fig. 1.
discrepancies between modelled and measured voltages, but these are acceptable and expected, given the natural variations between houses and the stochastic methods employed in creating the load data.
The modelled outputs of PV and CHP systems were derived from measured data, as described earlier, and were not further verified.
G. Limitations of the modelling
The network data from East Midlands Electricity included positive-sequence impedances for the installed cables based on the cable length and the manufacture’s specification. For fully unbalanced load-flow analysis however, the individual phase impedances are required, but these are not readily available. In theory, they may be calculated from knowledge of the cable geometries, but the wide range of cable types used in the test network and a lack of information regarding installation conditions makes such calculations extremely difficult in practice. For the modelling presented in this paper, it was assumed that the cables are fully transposed and can thus be represented by sequence impedances, and even these were derived by simple approximation: the zero-sequence resistance was taken as one-half of the positive-sequence resistance, and the zero-sequence reactance as three times the positive-sequence resistance [16]. The sensitivity of the calculated voltage profiles to the zero-sequence impedance was checked and found to be very low: neither doubling nor halving the zero-sequence impedances throughout the entire network data made any significant differences to the voltage rises caused by the PV or CHP. In conclusion, the accuracy of the modelling would certainly be improved by the use of individual phase impedances and this remains an important aspect for the future development of the work, although it is not expected to make significant differences to the general
voltage rise predictions.
The transformers at the primary-substation, which feed the test network, are equipped with on-load tap changers. The automatic voltage control systems that operate these tap changers are configured to maintain a constant voltage on the 11 kV bus-bar. In practice, in the case of the test network, the voltage set point is a little above 11 kV, but no dynamic line-drop compensation is applied. The taps are typically spaced at 1.5 % and the controller will have a dead-band of around 3 %. Voltage variation within a 3 % range is thus to be expected at the source of the feeder. This variation was not included in the model and was expected to lead to an underestimate of the voltage range seen at the test houses.
In keeping with normal UK practice, the test network is, for most intents and purposes, radial. That is, it has no loops, and any break in the network will result in all downstream customers being cut off. This radial topology is exploited by the forward/backward sweep load-flow algorithm discussed earlier. However, it is common practice to bring two ends of a radial network together at what is known as an open point. In the event of a cable fault, the open point can be closed to provide a temporary supply to some of the affected customers. The problem for the load-flow analysis is that the neutral conductors at these open points are permanently connected. This undermines a basic premise of the forward/backward sweep algorithm and is not easily resolved.
0 1 2 3 4 5 6 7 8 9 10 11 12 13 14 15 16 17 18 19 20 21 22 23 24 225
230 235 240 245 250
V
olt
age
(V)
Time (h) House B
Modelled Logged
225 230 235 240 245 250
0 0.05 0.1 0.15 0.2 0.25 0.3
Voltage (V)
Probability
House B
Modelled, Mean: 243.6, SD: 2.6 Logged, Mean: 242.9, SD: 2.0
0 1 2 3 4 5 6 7 8 9 10 11 12 13 14 15 16 17 18 19 20 21 22 23 24 225
230 235 240 245 250
V
olt
age
(V)
Time (h) House H
Modelled Logged
225 230 235 240 245 250
0 0.05 0.1 0.15 0.2 0.25 0.3
Voltage (V)
Probability
House H
Modelled, Mean: 236.2, SD: 2.5 Logged, Mean: 239.3, SD: 2.6
0 1 2 3 4 5 6 7 8 9 10 11 12 13 14 15 16 17 18 19 20 21 22 23 24 225
230 235 240 245 250
V
olt
age
(V)
Time (h) House L
Modelled Logged
225 230 235 240 245 250
0 0.05 0.1 0.15 0.2 0.25 0.3
Voltage (V)
Probability
House L
[image:5.612.48.299.606.723.2]Modelled, Mean: 238.0, SD: 4.8 Logged, Mean: 236.9, SD: 2.5
Fig. 3. Modelled and measured voltages against time-of-day (left) and as probability distributions (right), for houses B, H and L, for a typical winter day. III. THE IMPACT OF MICRO-GENERATION
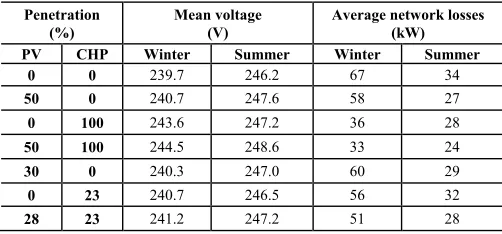
The validated model was used to assess the impact of micro-generation under various penetration scenarios and the results are presented in Table I.
TABLE I
MEAN VOLTAGES AND NETWORK LOSSES FOR VARIOUS PV AND CHP PENETRATIONS
Penetration
(%) Mean voltage (V) Average network losses (kW) PV CHP Winter Summer Winter Summer
0 0 239.7 246.2 67 34
50 0 240.7 247.6 58 27
0 100 243.6 247.2 36 28
50 100 244.5 248.6 33 24
30 0 240.3 247.0 60 29
0 23 240.7 246.5 56 32
28 23 241.2 247.2 51 28
The percentage penetrations given in Table I are defined as follows:
• For PV, it is the percentage of LV customers that have been allocated a 2.16 kWpeak PV array.
50 % corresponds to all houses with roof orientations within 45° of due south having a PV system and is considered a reasonable maximum.
• For CHP, 100 % means that every LV customer is equipped with a 1.2 kWelec micro-CHP system. For each scenario, results for a winter and a summer day are shown. The chosen days are typical regarding their expected electrical loads and heat loads (and therefore micro-CHP operation), but generous regarding the PV: clear sunny days were chosen, as noted earlier.
The mean voltages indicated are the mean of voltages at all LV customer connection points, modelled for every minute of the day under study.
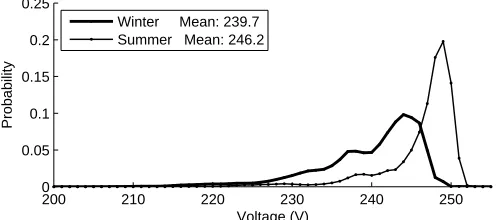
partly because 240 V was the UK nominal until the recent and ongoing harmonisation with the rest of Europe. But there is another reason: the probability distributions, as illustrated in Fig. 4, are not normal distributions, rather they are skewed, having longer tails on the low voltage side than the high. Thus, in order to maximize the numbers of customers within 10 % of the nominal, it follows that the mean will exceed the nominal. Indeed, with the winter mean close to 240 V, there are some customers who occasionally receive a supply voltage as low as 207 V. This is an important point because it illustrates that dealing with the voltage rise caused by micro-generation may not be as simple as tapping down the distributions transformers (a solution that has been suggested by other studies).
200 210 220 230 240 250
0 0.05 0.1 0.15 0.2 0.25
Voltage (V)
Probability
[image:6.612.49.299.235.345.2]Winter Mean: 239.7 Summer Mean: 246.2
Fig. 4. Probability distribution of voltages across all LV customer connection points, modelled for every minute of the day under study.
The second row of data in Table I shows the maximum 50 % penetration of PV. Mean voltages are increased by 1 V in winter and 1.4 V in summer. Network losses are slightly reduced. The next row shows the maximum CHP scenario and the row below considers both PV and CHP installed and operating concurrently. Thus, the model quantifies voltage rises caused by the installation of micro-generators in whatever penetration scenarios are of interest. The results can be analysed in detail, for example to investigate particular points on the network or particular times of day.
The challenge then is to know how much voltage rise can be accommodated by existing networks. As a first approach, we considered the European Standard, EN 50160, which states that, under normal operating conditions, all 10 minute mean values shall be within the range 195.5 V to 253 V. The 50 % PV and 100 % CHP scenarios, already discussed, lead to voltages that exceed this range and thus accommodating penetrations of this order would require some adjustment or re-engineering of network voltage control systems. The next two rows of Table I (30 % PV and 23 % CHP respectively) show scenarios that would be acceptable under EN 50160 without any changes to voltage control systems. These percentage penetrations were determined simply by re-running the model with various percentages and observing when the voltages fell within above mentioned limits. However, it should be noted that these percentages are highly sensitive to the absolute calibration of the model. The last row of Table I indicates a combined PV and CHP scenario that would also be acceptable under EN 50160; notice that, because these two types of generation generally have their maxima at different
times, there is only a slight reduction in allowable PV penetration; CHP is unaffected.
IV. CONCLUSIONS
Load-flow software for the detailed analysis of large unbalanced LV distribution networks has been developed and demonstrated. It shows good agreement with measured voltage data at a one-minute time resolution.
The model has been used to assess the voltage rise that would be caused by the installation of micro-generation in a typical UK network. The results indicate that considerable penetrations of micro-generation may be accommodated without modification of network voltage control systems. The exact penetration limits depend critically on the headroom afforded by existing voltage control systems and practices.
In order to increase penetration limits, and thus ensure that these low-carbon generation technologies are not unnecessarily constrained, we have initiated a study of what we have called distributed automatic voltage control (DAVC). With DAVC, the inverters that connect these generators to the network are also used to supply or consume reactive power so as to improve the network voltages. Initial results are encouraging and the concept will be presented more fully in a forthcoming paper.
V. ACKNOWLEDGEMENTS
The authors would like to thank the team at IESD, in particular Mark Rylatt for his preparation of the initial system representation and Melody Stokes for her domestic load models. We are grateful to Tom Betts of CREST for providing high-resolution solar radiation data, and finally to East Midlands Electricity (now Central Networks) for supplying the network data.
VI. REFERENCES
[1] ER G83/1, "Recommendations for the Connection of Small-Scale Embedded Generators (up to 16 A per Phase) in Parallel with Public Low-Voltage
Distribution Networks," The Electricity Association, Millbank, London, 2003.
[2] M. Stokes, "Removing barriers to embedded generation: a fine-grained load model to support low voltage network performance analysis," Ph.D. thesis, Institute of Energy and Sustainable Development (IESD), De Montfort University, Leicester, 2005.
[3] R. Gottschalg, The Solar Resource and the Fundamentals of Solar Radiation for Renewable Energy Systems: Sci-Notes Ltd, 2001.
[5] T. Markvart, Solar electricity, 2nd ed. Chichester: Wiley, 1999.
[6] SMA Regelsysteme GmbH, "Sunny Boy SWR 1800U, Grid Tied String Inverter for Photovoltaic Systems, Technical Description," SB1800U-11:EE0402, 2 July 2002.
[7] PowerGen, "WhisperGen Specifiers Guide," E.ON PowerGen, Coventry, UK 2005.
[8] P. Woods and J. Dickson, "The contribution CHP can make to energy efficiency in buildings," presented at IMechE Seminar: Energy Efficiency in Buildings, Belgrave Square, London, 23 March 2004.
[9] M. Thomson, D. Infield, M. Stokes, M. Rylatt, J. Mardaljevic, and K. Lomas, "Secondary Distribution Network Powerflow Analysis," presented at Power and energy systems, Palm Springs, CA, 2003.
[10] M. Thomson and D. G. Infield, "Network Power-Flow Analysis for High-Penetration Distributed Micro-Generation," presented at CIRED 18th International Conference on Electricity Distribution Turin, 2005.
[11] D. Shirmohammadi, H. W. Hong, A. Semlyen, and G. X. Luo, "A compensation-based power flow method for weakly meshed distribution and transmission networks," in Conference Papers - Power Industry Computer Application Conference: PICA 87 (Cat. No.87CH2500-7). New York: IEEE, 1987, pp. 370-376.
[12] W. H. Kersting, Distribution System Modeling and Analysis. Boca Raton, Florida, U.S.: CRC Press, 2001.
[13] SynerGEE Electric 3.0, Stoner Software, Advantica Limited, Loughborough, UK.
[14] SimPowerSystems 4.2, The MathWorks Inc., Natick, MA, US.
[15] Electrocorder EC164, "Single-phase voltage logger," Acksen Limited, Belfast, UK.
[16] W. J. S. Rogers, CEng. M.I.E.E. Private communication: 11 Oct 2004.
VII. BIOGRAPHIES
Murray Thomson was born in England on the 10th January 1964. He gained a BSc in Electrical and Electronic Engineering from the University of Leeds in 1985 and then worked in the automation industry as a software and electrical systems engineer.
He joined CREST (Centre for Renewable Energy Systems Technology), Loughborough University, in 1997 to study the technical aspects of integrating large numbers of renewable-energy powered generators into electricity networks. He gained a PhD on photovoltaic-powered desalination in 2004 and continues research in this area. He is a module director and lecturer for the CREST masters course in renewable energy.
David G. Infield (M’2003, SM’2005) was born in Paris on the 30th March 1954. He was brought up and educated in England, gaining a BA in Mathematics and Physics from the University of Lancaster and a PhD in Applied Mathematics from the University of Kent at Canterbury.
He worked first for the Building Services Research and Information Association, Bracknell, UK, on solar thermal system design, and then for the Rutherford Appleton Laboratory, from 1982 to 1983, on wind energy systems and electricity supply modelling.