Int. J. Electrochem. Sci., 13 (2018) 3171 – 3184, doi: 10.20964/2018.03.31
International Journal of
ELECTROCHEMICAL
SCIENCE
www.electrochemsci.org
Short Communication
Facile In-situ Reduction Method for Preparation of GO-Pd
Catalysts
A. Moreno-Bárcenas1, J.F. Perez-Robles1, YV Vorobiev1, Pech-Pech I.E 2, A.G. García3,*
1 Centro de Investigación y de Estudios Avanzados del Instituto Politécnico Nacional. Real de
Juriquilla, Santiago de Querétaro, Qro. C.P. 76230, México.
2
Instituto Tecnológico de Cancún, Av. Kabah Km. 3., CP 77500, Cancún, Quintana Roo, México.
3
Laboratorio de síntesis y modificación de nanoestructuras y materiales bidimensionales. Centro de Investigación en Materiales Avanzados S.C., Alianza Norte #202, Parque PIIT, Apodaca Nuevo León. C.P. 66628, México.
*
E-mail: [email protected]
Received: 11 November 2017 / Accepted: 28 November 2017 / Published: 5 February 2018
In recent years, many researchers have developed techniques for the production of new nanostructured materials. The present work focused on the development of an environmentally friendly synthesis route with excellent catalytic properties that is; an alternative to the synthesis of nanoparticles supported on graphene oxide (GO), and it provides significant reduction in secondary waste. This method was designed for in situ reduction of highly dispersed Pd nanoparticles on the surface of GO for use in catalytic applications. X-ray diffraction measurements determined that the method yielded Pd mainly in the metallic state. Electrochemical characterization by cyclic voltammetry measurements showed that the increased crystallinity of Pd improved the exposure of the active electrochemical sites that carry out the oxygen reduction reaction (ORR). These results allow the design and control of the in-situ growth of nanostructured materials.
Keywords: Graphene oxide, Palladium nanoparticles, Active electrochemical sites.
1. INTRODUCTION
exhibit structural sensitivity, implying that their activity and selectivity depend on the arrangement of surface atoms [3], [4]. This has motivated the search for methods to increase the surface area of the nanoparticles and control their size and morphology by means of their immobilization on different substrates or supporting materials.
Graphene oxide (GO) is one of the most promising supporting materials for the Pd catalysts [5]. It possesses a two-dimensional nanostructure with oxygen functional groups and it is widely used in many electrochemical applications due to its superior properties such as good biocompatibility, high surface area, high mechanical strength, and low production cost. As a good supporting substrate, GO can provide extraordinary modification to active species. Hybridization of noble metal nanoparticles with GO is an effective strategy for enhancing the functionality of nanocatalysts [6],[7].
Unfortunately, most catalysts synthesis methods suffer from various drawbacks such as the use of expensive, toxic, and hazardous reagents, tedious work-up, low yields, lack of selectivity, and environmental pollution caused by the formation of side products [8], [9], [10]. Therefore, it is desirable to develop cheaper and more environmentally friendly methods to produce nanocatalysts or nanocomposites for catalytic applications.
In this study, a simple reduction method with high-efficiency, and low production of secondary waste was employed to synthesize highly dispersed Pd nanoparticles on graphene oxide (GO) sheets. This method is based on the chemical reduction of palladium chloride (PdCl2) in the presence of GO.
The prepared GO-Pd catalyst was analyzed using various characterization techniques. The catalytic response of the electrode prepared with GO-Pd was measured by cyclic voltammetry.
2. EXPERIMENTAL
2.1. Preparation of GO.
GO was prepared from natural powder-graphite by acid exfoliation in reflux (70 ml H2SO4: 30
ml HNO3) for 72 h. It was then washed with deionized water until pH of 7 was obtained.
2.1. Preparation Catalyst GO-Pd.
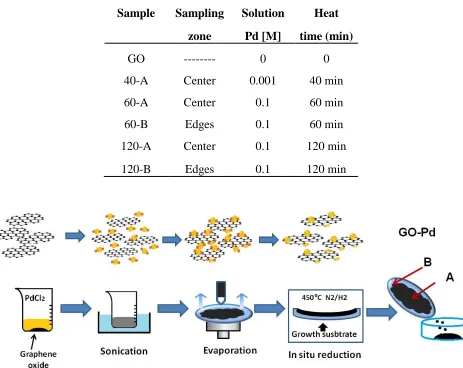
The GO-Pd catalyst was fabricated as follows: a mixture containing 0.5 g of GO was sonicated in 10 ml PdCl2 for 30 min. It was subsequently dried at 120°C on a quartz substrate with the diameter
analysis (TGA), X-ray diffraction (XRD), X-ray photoelectron spectroscopy (XPS), and cyclic voltammetry.
[image:3.596.67.530.196.564.2]To minimize secondary residues, Hummers’ method was not used in our GO synthesis. In addition, the use of a 90:10 N2:H2 reducing atmosphere minimizes the generation of waste.
Table 1. Experimental condition.
Sample Sampling Solution Heat
zone Pd [M] time (min)
GO --- 0 0
40-A Center 0.001 40 min
60-A Center 0.1 60 min
60-B Edges 0.1 60 min
120-A Center 0.1 120 min
120-B Edges 0.1 120 min
Figure 1. Schematic diagram of the method for the in-situ synthesis of GO-Pd.
2.3 Characterization
from 5 to 90° at room temperature. X-ray photoelectron spectroscopy (XPS) was obtained with a Thermo Scientific Escalab 250Xi spectrometer using monochromatized Al K radiation (1486.6 eV). The GO/Pd weight ratio was analyzed by thermogravimetric analysis (TGA) and recorded using an SDT Q 600 TA Instruments equipment in the range of 35°C-1000°C in air. The electrochemical tests were carried out in a cell of three electrodes on an AUTOLAB potentiostat/galvanostat device and a rotor brand Pino.
3. RESULTS AND DISCUSSION
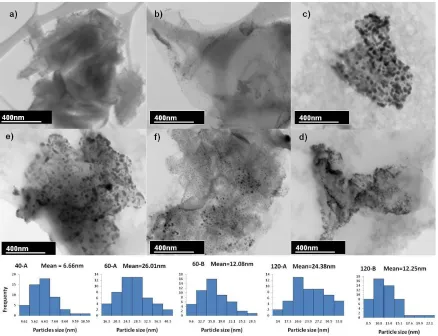
Figure 2. Bright field STEM micrographs of a) GO, b) 40-A, c) 60-A, d) 60-B, e) 120-A, f) 120-B samples.
[image:4.596.80.518.240.576.2]
treatment time. However, the position of the Pd particles in the growth substrate was affected by the material accumulation at center (A sampling zone), as seen in Figures 2c-f, showing the average sizes of ~25 nm at the center, and ~13 nm in the edges (B sampling zone), that can be attributed to the effects of segregation resulting the concavity of the growth substrate.
A smaller particle size was obtained for sample 40-A (0.001 M), suggesting that the concentration also modifies the final diameters of the obtained nanoparticles. The diameter distributions presented below the micrographs in Figure 2 show the highest values for 0.1 M concentration (~13 nm at edges and ~25 nm at center). Therefore, these results demonstrate that this synthesis method allowed us to obtain nanoparticles with different sizes and narrow distributions by controlling the concentration and localization zone (A or B) in the growth substrate of the nanoparticles.
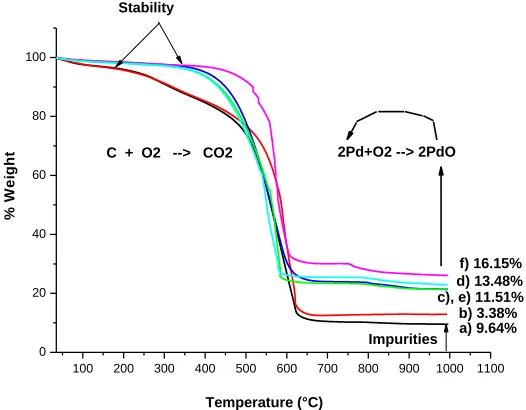
Thermogravimetric analysis under air atmosphere was used to determine the mass percentage of the Pd deposited on the GO surface. It was found that 9.64 wt% of impurities were present, and this GO residue which remained at 1000°C could be attributed to the impurities present in the pristine graphite (as demonstrated later). The percentage of the Pd was calculated from the percentage of the found impurities and considering the stoichiometric ratio of the palladium that the samples exhibit in Figure 3 and Table 2. On the other hand, it was found that a higher concentration of Pd precursor increases the percentage of the Pd on the GO surface.
These catalyst exhibited well-defined mass loss, which occurred between 169°C and 627° C for GO and 40-A samples, and in the 395°C–627°C for 60-A,B and 120-A, B samples and which is attributed to oxidized carbon atoms [13], [14]. Zheng et al. [15], showed that is possible to reduce GO by a thermal process in the presence of H2. Hence, increase the stability of GO in the 60-A, B and
120-A, B samples was due to the partial reduction of GO during the synthesis. This reduction allows the reorganization of the graphitic structure [16].
100 200 300 400 500 600 700 800 900 1000 1100
0 20 40 60 80 100
Impurities Stability
a) 9.64% 2Pd+O2 --> 2PdO C + O2 --> CO2
Temperature (°C)
%
W
e
ig
h
t
[image:5.596.168.431.491.696.2]f) 16.15% d) 13.48% c), e) 11.51% b) 3.38%
Table 2. Thermogravimetric results.
Sample % wt PdO %wt Pd
40-A 3.38 2.39
60-A 11.51 10.01
60-B 16.15 14.04
120-A 11.51 10.01
120-B 13.48 11.71
10 15 20 25 30 35 40 45 50 55 60 65 70 75 80 85 90
d)
c)
b)
a)
2 (°)
In
te
n
s
it
y
(
a
.u
.)
002 220 311 222
200
111
700 600 500 400 300 200 100
Pd 3p
c)
b)
a) Cl 2p
Si 2p Si 2s Pd 3d
O 1s C 1s
Binding energy (eV)
d)
In
te
n
s
it
y
(
a
.
u
[image:6.596.85.499.140.514.2].)
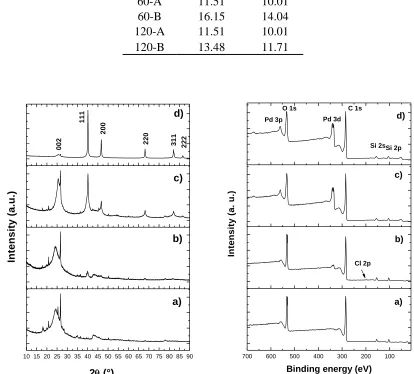
Figure 4. X Ray diffraction pattern (left) and XPS spectrum (right) for a) GO, b) 40-A, c) 60-A, and d) 120-A samples.
The X-ray diffraction (XRD) patterns of GO-Pd (Figure 4), showed a peak approximately 24.3° which is a characteristic peak of the (002) plane attributed to the stacked GO [17], [18], that corresponds, to the interlayer spacing of 0.352 and 0.357 nm, which were larger than that of the graphite powder (0.337 nm); these results were similar to the literature[19], implying the successful preparation of GO. In XRD showed four diffraction peaks at 40.1°, 44.6°, 68.1°, 82.8° and 86.5°, which could be indexed as (111), (200), (220), (311) and (222) planes indicating that Pd nanoparticles (JCPDSNo. 05-0681) [11] in the 60-A and 120-A catalysts possess a cubic structure [20], [21].
120-A, with higher intensities than for sample 60-A, even though Pd percentages by weight for both samples were similar (approx. 10%). This suggests that the treatment time increases the crystallinity of the Pd nanoparticles. Additionally, other diffraction patterns were observed with peaks at 26.6°, 21°, and 18° corresponding to impurities of pristine graphite, silicate residues and SiO2 (ICDD standard
01-087-2096).
XPS was used as the main approach for elucidating the chemical state of Pd (Figure 4.2). The analysis of the GO, 40-A, 60-A and 120-A samples showed signals associated with C1s (284.5 eV), O1s (532.5 eV), Pd 3p (561 eV), Pd 3d5/2, and Pd 3d3/2 (335.2 and 340.5 eV) [22], as well as the
presence of SiO2 impurities corresponding to the impurities of pristine graphite that was used in the
synthesis (155 and 104 eV) (CAS registry No.7631-86-9). A higher Pd peaks intensity was observed for samples 60-A and 120-A, in addition to a lower intensity of the same peak for sample 40-A. This is in accordance with SEM and TGA results, where a greater percentage of Pd was revealed.
344 342 340 338 336 334 332 a)
Pd0 3d
3/2
Pd0 3d 5/2
PdII
3d
5/2
PdII 3d 3/2
In te n s it y ( a .u .)
Binding Energy (eV)
344 342 340 338 336 334 332 b) In te n s it y ( a .u .)
Binding Energy (eV)
Pd0 3d 3/2
Pd0 3d 5/2
PdII
3d 3/2
PdII 3d 5/2
344 342 340 338 336 334 332 c) In te n s it y ( a .u .)
Binding Energy (eV)
Pd0 3d
3/2
Pd0 3d
5/2
PdII
3d 3/2 Pd
II
[image:7.596.101.488.302.591.2]3d 5/2
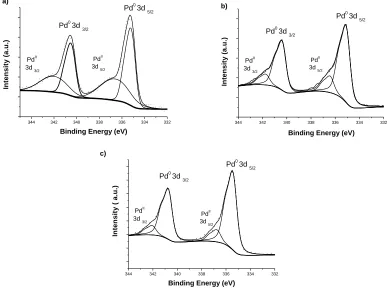
Figure 5. Core level XPS spectra for Pd in the samples a) 40-A, b) 60-A, and c) 120-A.
Furthermore, as seen from Figure 5, the binding energies of Pd 3d can be resolved into 3d5/2
and 3d3/2 doublets caused by spin-orbital coupling [23]. Upon deconvolutions of the spectra, the curves
intensities of Pd(0) peaks were larger than those of Pd(II), indicating the major contribution of metallic Pd. This is evidence that the precursor (PdCl2) was reduced to the metallic state; additionally, the
Pd(II) signal suggests that traces of the precursor (PdCl2) were not reduced completely for sample
40-A.
The electrochemical tests were carried out in a three-electrode cell. A silver/silver chloride (Ag/AgCl) electrode saturated with potassium chloride (KCl) was used as the reference electrode and a platinum wire as the counter electrode. The catalytic inks were prepared by ultrasonically agitating a mixture composed of 5 mg of catalyst, 625 μl of tridistilled water and 125 μl of Nafion-117 (5 %) for 30 min. The thin film formed from 10 μl catalytic ink deposited on the vitreous carbon (5 mm diameter) of a rotating disk electrode was used as the working electrode, in 0.5 M solution of H2SO4
prepared with tridistilled water which was used as the electrolyte.
Cyclic voltammetry measurements were performed after 50 potential cycles between 0-1.2 V vs NHE in Ar (99.998%)-saturated acid electrolyte at 50 mVs-1.The rotating disk electrode (RDE) technique was used under O2 atmosphere(99.99%) in the range of potentials between 0.0-0.8 V vs
NHE at the scan rate of 5 mV s-1 and at different rotation rates (from 100 to 1600 rpm).
0.0 0.2 0.4 0.6 0.8 1.0 1.2
-1 0 1
GO 40A
a)
j
(m
A
c
m
-2 )
E (V vs NHE)
0.0 0.2 0.4 0.6 0.8 1.0 1.2
-1.5 -1.0 -0.5 0.0 0.5 1.0
60A 60B 120A 120B IV
II
III I
b)
j
(m
A
c
m
-2 )
[image:8.596.80.504.361.531.2]E (V vs NHE)
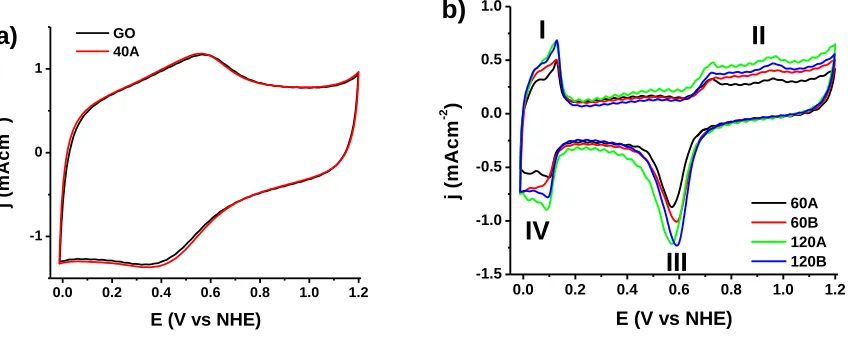
Figure 6. Cyclic Voltammograms for A) GO and 40-A, B) 60-A, 60-B, 120-A and 120-B.
shift of 20 mV toward positive potentials in peak III exhibited for catalysts B in comparison to catalysts A suggests: 1) a delayed formation of Pd–OH[31]and/or an easier removal of absorbed OH (OHads) due to a weaker energy binding between OHads and the surface of catalysts B [31] [32], [33]. A
high presence and/or a strong adsorption of the hydroxyl species could compete with the adsorption of new oxygen molecule and gradually decrease the number of actives sites and consequently reduce the kinetic and the catalytic activity for oxygen reduction [34], [35]; based on the above and the fact that the catalysts 60-B and 120-B show the particle sizes lower than those of catalysts A (as was seen in SEM results), these results could suggest that ORR catalysis is favored to some degree by Pd nanoparticles with a smaller diameter.
On the other hand, sample 40-A showed the electrochemical signal similar to that shown by GO (Figure 6a); the absence of the Pd signal in this sample suggests that a low concentration of this metal was deposited on the surface of the support, which is in agreement with the results obtained by TGA, where the concentration of Pd of approximately 3% w/w was found; in addition, the absence of peaks associated to oxygen species formation/reduction suggests that this sample has poor or no ability to catalyze ORR due to low concentrations of Pd; this, is in accordance with other results, where low catalytic activities have been reported for catalysts with metal loading lower than 5% w/w [36], [37].
An increase in the area of the hydrogen absorption/desorption region was found for the catalysts that were subjected to a longer treatment time (Peaks I and IV, 120A-B), suggesting that crystallinity significantly increases the exposure of possible active sites for ORR. To corroborate this observation, the electrochemical active surface areas (ECSA) were calculated using the following equation:
) 1 (
LS Q
ECSA
where Q is the integration of the charge associated with the desorption of the monolayer of hydrogen of the CV curve, L is the mass of Pd deposited on the working electrode, calculated from TGA measurements and S (212 mC cm-2) is the theoretical charge required for desorption of one monolayer of hydrogen on a Pd surface [27], [38], [39]. Thus, the ECSA values for catalysts 60-A, 120-A, 60-B and 120-B were 8.63, 14.13, 8.59 and 14.26 m2gPd−1, respectively. The fact that catalyst
ORR in catalysts 120A-B. Moreover, the fact that sample 120-A shows a greater number of active sites but the same overpotential as that of sample 60-A suggests that the number of active sites increase with the treatment time.
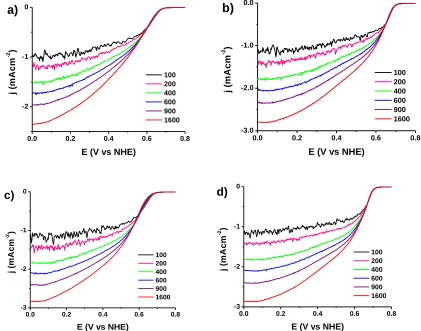
Figures 7 a-d shows the polarization curves measured at several rotating speeds (ω's), which were used to construct Koutecky-Levich (KL) plots, j-1 vs. ω-1/2 (Figure 8A) based on the following equation [41]:
0.62 (2)1 2 1 6 1 3 2 1 1 1 1
jk jd nFkCo nFDo v Co
j
The equation (2) can be written as: ) 3 ( 2 / 1 1 1
1
w B j
j k ,
where B0.62nFDo23v16Co, j is the overall current, jk is the kinetic current, jd is the
diffusion-limiting current, n is the overall number of transferred electrons, F is Faraday’s constant (96,500 C·mol-1
), k is the rate constant for oxygen reduction, Co is the bulk O2 concentration in the electrolyte
(1.13x10⁻⁶mol·cm-3), Do is the diffusion coefficient of O2 (1.8x10⁻⁵cm2·s-1), and v is the kinematic
viscosity of the aqueous 0.5 M sulfuric acid solution (1x10⁻²cm2·s-1) [42].
0.0 0.2 0.4 0.6 0.8
-2 -1 0 a) j (m A c m -2 )
E (V vs NHE)
100 200 400 600 900 1600
0.0 0.2 0.4 0.6 0.8
-3.0 -2.0 -1.0 0.0 b) j (m A c m -2 )
E (V vs NHE)
100 200 400 600 900 1600
0.0 0.2 0.4 0.6 0.8 -3 -2 -1 0 j (m A c m -2 )
E (V vs NHE)
100 200 400 600 900 1600 c)
0.0 0.2 0.4 0.6 0.8
-3 -2 -1 0 d) j (m A c m -2 )
E (V vs NHE)
100 200 400 600 900 1600
Figure 7. RDE voltammetry curves for oxygen reduction obtained in an oxygen-saturated 0.5 M H2SO4 solution at rotating speeds in a range of 100-1600 rpm for samples a) 60A, b) 60B, c)
[image:10.596.94.515.345.676.2]
All catalysts exhibited a KL slope (Table 3) for the ORR calculated at 0.38 V that was similar to the theoretical slope (12.91x10⁻²mA·cm-2·rpm-0.5) for a four-electron transfer process. This result suggests that the mechanism of oxygen reduction proceeds mainly via the direct formation of water, as described by O2 + 4H+ + 4e- <--> 2H2O, and suggests that the reaction mechanism is independent of
[image:11.596.177.419.217.322.2]crystallinity or particle size when oxygen reduction occurs on the surface of this type of catalysts.
Table 3. Values of the half-wave potential of O2 reduction (E1/2) vs NHE.
Sample B x10
-2
(mAcm-2rpm-0.5)
E1/2 vs NHE
(V)
40-A -- --
60-A 12.42 0.47
60-B 13.38 0.50
120-A 14.23 0.53
120-B 12.20 0.56
The comparison of j–E curves for O2 reduction at the rotation rate of 1600 rpm is shown in
Figure 8B. The weak signals and the higher negative shifts in the polarization curves found for the GO support and the sample 40-A demonstrate that these samples showed poor or no ability to catalyze ORR, as suggested previously (Figure 6). In addition, compared to the 60-A and 120-A catalysts, the onset potential of oxygen reduction for 60-B and 120-B catalysts shifted to the more positive potentials; this is in accordance with the positive shift of the ORR peaks observed in CV tests, and suggests that catalysts B are more actives for ORR than catalysts A [42], [43], [44] and therefore these catalysts more readily promoted the four-electron reduction process of oxygen.
0.02 0.04 0.06 0.08 0.10
0.5 1.0 1.5
a) 60A 60B
120A 120B Theoretical 4e Theoretical 2e
-j
-1 (
mA
-1 cm
)
w-1/2 (RPM-1)
0.0 0.2 0.4 0.6 0.8
-3 -2 -1 0 b)
j
(m
A
c
m
-2 )
E (V vs NHE)
Graphene 40A 60A 60B 120A 120B
[image:11.596.103.518.512.673.2]
On the other hand, the values of the half-wave potential of O2 reduction (E1/2) increased in the
following order (table 3): 60A< 120A < 60B < 120B. Based on the ORR onset potential and half-wave potential values, it can be concluded that catalyst 120B possesses the highest electrocatalytic activity for ORR. The main reasons for this highest activity could be assigned as due to 1) the higher ordering (crystallinity) which increases the number of the available active sites (ECSA) for the ORR and 2) to the lower particle size which could be favoring the electronic environmental in each active site during oxygen reduction, and which are in agreement with other reports where the crystallinity [45], [46], [47], [48] and the particle size [26], [49], [50] have been demonstrated to exert an influence on the catalytic activity of the nanoparticles.
These results demonstrate that a longer treatment time during the growth of Pd on GO is a potential alternative approach to increasing the number of exposed active sites, and that precursors concentration and growth zone of the nanoparticles are also alternative factors that can be used to control the particle size and therefore the overpotentials as well as the ease of ORR catalysis on the surface of the Pd nanoparticles.
4. CONCLUSIONS
In summary, GO-Pd catalysts with different size and percentage of the nanoparticles were synthesized via an in-situ reduction method. The ORR activities for samples 120-A-B and 60-A-B were higher than that for sample 40-A, as revealed by cyclic voltammetry evaluations. Our results showed that position at the growth substrate, precursor concentration, and treatment time; are crucial parameters for the design and control of Pd nanoparticle synthesis. Concentrations of 0.1 M with treatment times of 120 min provided more thermally stable Pd nanoparticles, with a high number of electrochemically active sites and slightly lower overpotentials to carry out the ORR catalysis. This method of in-situ reduction allows a considerable reduction of the secondary residues, and can be applied to other types of precursors for different research areas and especially in catalysis regarding the nanoparticles supported in GO.
ACKNOWLEDGMENTS
The financial support by CONACyT. We thank to Luis Gerardo Silva Vidaurri, Alberto Toxqui Terán, Nayely Pineda Aguilar, and Francisco Longoria from CIMAV Monterrey, Luz Maria Avilez Arellano from CINVESTAV Qro., and for the technical support. I.E. Pech-Pech thanks for the Postdoctoral fellowship from CONACYT-SENER-Energy Sustainability (# 266373).
References
4. L. Fernández-García, M. Blanco, C. Blanco, P. Álvarez, M. Granda, R. Santamaría, R. Menéndez ., Journal Mol. Catal. A, Chem., 416 (2016) 140.
5. M. Ho, S. Mook, D. Un, W. Bae, and Z. Chen, J. Power Sources, 300 (2015) 1.
6. T. K. Das, S. Banerjee, M. Pandey, B. Vishwanadh, R. J. Kshirsagar, and V. Sudarsan, Int. J. Hydrogen Energy, 42 (2017) 8032.
7. L. Daneshvar, G. Hossein, Z. Es, M. Chamsaz, and S. Tarahomi, Mater. Sci. Eng. C, 69 (2016) 653.
8. D. Phan and G. Chung, Sensors Actuators B. Chem., 199 (2014) 354. 9. B. Lesiak, P. Jiricek, and I. Bieloshapka, Appl. Surf. Sci., 404 (2017) 300.
10. M. Nasrollahzadeh, S. M. Sajadi, A. Rostami-vartooni, and M. Alizadeh, J. Colloid Interface Sci., 466 (2016) 360.
11. Y. Zhang, F. Gao, and M.-L. Fu, Chem. Phys. Lett., 691 (2018) 61. 12. X. Zhang, G. Wu, Z. Cai, and X. Chen, Talanta, 134 (2015) 132.
13. R. Moraes, C. Matos, E. Castro, W. Schreiner, M. Olivera, and A. Zarbin, J. Braz. Chem. Soc, 22 (2011) 2191.
14. J. I. Paredes, P. Solı, and J. M. D. Tasco, Carbon N. Y., 49 (2010) 1653.
15. P. Zheng, L. Ting, S. Ying, Y. Xiaoyan, Z. Lifeng, and G. Shouwu, J. Alloys Compd., 703 (2017) 10.
16. D. Yang, A. Velamakanni, G. Bozoklu, S. Park, M. Stoller, R. D. Piner, S. Stankovich, I. Jung, D. A. Field , C. A. Ventrice Jr., R. S. Ruoff., Carbon N. Y., 47 (2009) 145.
17. J. Xu, R. Meng, J. Cao, X. Gu, W. LiSong, Z. Qi, W. Wang., J. Alloys Compd., 564 (2013) 84. 18. K. S. Subrahmanyam, S. R. C. Vivekchand, A. Govindaraj, and C. N. R. Rao, J. Mater. Chem.,
170 C (2008) 1517.
19. Y. Zhao, L. Zhan, J. Tian, S. Nie, and Z. Ning, Electrochim. Acta, 56 (2011) 1967.
20. A.H. Al-Marri, M. Khan, M. R. Shaik, N. Mohri, S. F. Adil, M. Kuniyil, H. Z. Alkhathlan, A. AlWarthan, W. Tremel, M. N. Tahir, M. Khan, M. R. H. Siddiqui., Arabian J. Chem. 9 (2016) 835. 21. P. Wang, G. Zhang, H. Jiao, X. Deng, Y. Chen, and X. Zheng, Applied Catal. A, Gen., 489 (2015)
188.
22. H. He and C. Gao, Molecules, 15 (2010) 4679.
23. M. Cano, A. M. Benito, E. P. Urriolabeitia, and R. Arenal, Nanoscale, 5(2013) 10189.
24. C. Freire, R. Krishna, D. M. Fernandes, and E. Titus, Int. J. o f Hydrog. Energy,. 41 (2015) 11811. 25. S. Yang, J. Dong, Z. Yao, C. Shen, X. Shi, Y. Tian, S. Lin, X. Zhang, Sci. Rep., 1(2014) 1.
26. G. Ramos-Sánchez, H. Yee-Madeira, and O. Solorza-Feria, Int. J. Hydrogen Energy, 33 (2008) 3596.
27. K. Jukk, N. Alexeyeva, C. Johans, K. Kontturi, and K. Tammeveski, J. Electroanal. Chem., 666 (2012) 66.
28. J. Wu, S. Shan, J. Luo, P. Joseph, V. Petkov, and C. J. Zhong, ACS Appl. Mater. Interfaces, 7 (2015) 46.
29. K. Jukk, N. Kongi, L. Matisen, T. Kallio, K. Kontturi, and K. Tammeveski, Electrochim. Acta, 137 (2014) 206.
30. J. Maya-cornejo, N. Arjona, M. Guerra-balcázar, and L. Álvarez-contreras, Procedia Chem., 12 (2014) 19.
31. J. Zhao and A. Manthiram, Appl. Catal. B Environ., 101 (2011) 660.
32. J.R. Zapata-Fernandez , Y. Gochi-Ponce, M.I. Salazar-Gastelum, E.A. Reynoso-Soto, F. Paraguay-Delgado, S.W. Lin, R.M. Felix-Navarro., Int. J. Hydrogen Energy,. 42 (2017) 9806.
35. G. Wang, H. Wu, D. Wexler, H. Liu, and O. Savadogo, J. Alloys Compd., 503 (2010) 2. 36. I. E. Pech-Pech, D. F. Gervasio, and J. F. Pérez-Robles, J. Power Sources, 276 (2015) 374.. 37. L. Geniès, R. Faure, and R. Durand, Electrochim. Acta, 44 (1998) 8.
38. Q. Wang, X. Cui, W. Guan, W. Zheng, J. Chen, X. Zheng , X. Zhang, C. Liu, T. Xue, H. Wang, Z. Jin, H. Teng., J. Phys. Chem. Solids, 74 (2013) 1470.
39. S. Salomé, A. M. Ferraria, A. M. Botelho Do Rego, F. Alcaide, O. Savadogo, and R. Rego, Electrochim. Acta, 192 (2016) 268.
40. O. Savadogo, K. Lee, K. Oishi, S. Mitsushima, N. Kamiya, and K. I. Ota, Electrochem. commun., 6 (2004) 105.
41. A. J. Bard and L.R. Faulkner, Electrochemical Methods., (2001) New York, USA.
42. K. Jukk, N. Kongi, L. Matisen, T. Kallio, K. Kontturi, and K. Tammeveski, Electrochim. Acta, 137 (2014) 206.
43. K. Oishi and O. Savadogo, Electrochim. Acta, 98 (2013) 225.
44. X. Song, Q. Shi, H. Wang, S. Liu, C. Tai, and Z. Bian, Appl. Catal. B Environ., 203 (2017) 442. 45. C. W.B. Bezerra, L. Zhang, H. Liu, K. Lee, A. L.B. Marques, E. P. Marques, H. Wang , J. Zhang.,
J. Power Sources,. 173 (20 07) 891.
46. K. Jiang, P. Wang, S. Guo, X. Zhang, X. Shen, G. Lu, D. Su, X. Huang., Angew. Chemie - Int. Ed., 55 (2016) 9030.
47. E. Antolini, Appl. Catal. B Environ., 217 (2017) 201.
48. D. Wang, H. Xin, R. Hovden, H. wang, Y. Yu, D. a. Muller, F.J. Disalvo, H. Abruña,. Nat. Mater., 12 (2013) 81.
49. W. P. Zhou, A. Lewera, R. Larsen, R. I. Masel, P. S. Bagus, and A. Wieckowski, J. Phys. Chem. B, 110 (2006) 13393.
50. A. Anastasopoulos, J.C. Davies, L. Hannah, B.E. hayden, C. E. Lee, C. Milhano, Mormiche, L. Offin,. Chem Sus Chem, 6 (2013) 1973.