Int. J. Electrochem. Sci., 13 (2018) 11986 – 11999, doi: 10.20964/2018.12.81
International Journal of
ELECTROCHEMICAL
SCIENCE
www.electrochemsci.org
Influence of Cutting Fluids on the Corrosion Resistance of
X20Cr13 Martensitic Stainless Steel
Tihana Kostadin1,*, Goran Cukor2, Zoran Jurković2
1 Karlovac University of Applied Sciences, Ivana Meštrovića 10, 47000 Karlovac, Croatia 2 University of Rijeka, Faculty of Engineering, Vukovarska 58, 51000 Rijeka, Croatia *E-mail: tihana.kostadin@vuka.hr
Received: 9 September 2018 / Accepted: 11 October 2018 / Published: 5 November 2018
Martensitic stainless steels are difficult-to-cut materials, so the utilization of the cutting fluids with high flow rates is considered necessary in their machining. However, flood cooling method represents a high risk to human health and environment and is also a great economic burden. A chilled jet of compressed air is one of the possible alternatives to conventional liquid coolants. As corrosion can occur even in dry machining, the aim of this paper was to investigate the feasibility of replacing conventional emulsion coolant with the chilled air out of Ranque-Hilsch counter-flow vortex tube. An important outcome of corrosion testing showed a beneficial effect of the chilled air-cooling method on the corrosion resistance since it is on increase over a prolonged time. As expected, the feed rate f was confirmed to be the most important factor affecting the Ra, but the most interesting finding was that about non-significant influence of the cooling method on reducing the Ra and consequently on increasing the corrosion resistance of machined surface. Therefore, the chilled air-cooling by a vortex tube can be successfully applied to turning of steel X20Cr13, thereby eliminating the ecological load caused by the application of conventional liquid coolant.
Keywords: martensitic stainless steel; corrosion resistance; cooling; electrochemical and gravimetric measurements.
1. INTRODUCTION
Disposal of used cutting fluid quantities opens up numerous ecological issues, especially when taken into account that it is one of the most complex types of waste with a high organic charge [2]. It is worrying that almost 30% of the annual consumption of cutting fluids is removed from the machining system observing losses such as evaporation, uncontrolled leakage and residual quantities at the workpiece, tool or chip [3]. Handling of cutting fluid poses a risk to human health and the possibility of illness from various diseases, most commonly skin diseases [4] and malignant and non-malignant respiratory diseases [5]. Other hazardous effects are oil vapour effect, bactericidal effect, genotoxic effect, generation of carcinogenic substances [6], presence of heavy metal particles in additives, etc. The risks of using cutting fluids for the environment and human health stress the necessity for exploring the new possibilities of replacing the conventional emulsion cooling with alternative one.
The ratio of the purchasing cost and the hidden cost, which includes the individual costs of all phases of the cutting fluid life cycle, varies from 1.0 : 1.5 up to 1.0 : 5.5 [7]. Consumption in thousands of tons and allocations in billions of dollars reflect the scope and costs of using cutting fluids [8]. For difficult-to-cut materials, the cost of using cutting fluid ranges from 20% to 30% of total machining cost [9]. Hence, the high cost burden that is generated by the application of cutting fluids is another aspect that has to be taken into account.
The need to observe the application of cutting fluid from three aspects, ecological, sociological and economic, is a major challenge for researchers in seeking for better cooling and lubrication solutions in machining. At the same time, these solutions should be technically and economically competitive and should not be a threat to the future or sustainability of machining.
By using a chilled jet of compressed air, some functions of conventional cutting fluid can be replaced, from which the basic ones are cooling of the tool and workpiece as well as removal of the chips from the cutting zone. Chilled air is considered efficient in heat dissipation i.e. in lowering temperature in the cutting zone during machining. As a disadvantage, the absence of lubrication function should be mentioned. It is possible to compensate this function with the selection of special tools coated with self-lubricating coatings, which allow unobstructed cutting under such machining conditions [10].
Chilled air-cooling is most often carried out using a vortex tube, which splits a compressed air in two streams: hot (up to 100°C) and cold (down to -50°C). The latter is jetted directly to the cutting zone. Using the air as cooling medium in machining represents the cleanest and most favourable cooling method for the environment and humans [11]. Besides, the reduction in variable costs of machining due to non-use of conventional liquid coolants, easier recycling of uncontaminated chip and avoiding degreasing of workpiece after completion of machining meets today's economic demands placed in front of the machining industry.
roughness and tool life relative to dry machining can be achieved by employing a vortex tube cooling system at turning of AISI 1040 carbon steel. Sharma et al. [15] provided an overview of various air-cooling techniques, which contribute to a significant improvement of productivity at turning of difficult-to-cut materials such as nickel alloys or titanium. Liu et al. [16] made a comparison of dry machining and chilled air-cooling at the hard turning of Ti6Al4V alloy, and recorded a considerably lower cutting temperature and a lower tool wear and surface roughness for the latter.
Foltz [17] stated that corrosion could occur even in dry machining and not only owing to utilization of water miscible cutting fluids. Also, in the stainless steels family, martensitic ones are the most sensitive to the appearance of corrosion. As can be seen from the above literature survey, the use of chilled air-cooling when turning martensitic stainless steels was not explored before this paper. The goal set herein was to investigate the feasibility of replacing conventional emulsion coolant with chilled air, also considering the corrosion resistance property of the selected martensitic stainless steel after the turning operation. The findings encourage such replacement so that the ecological and economical loads caused by the common application of liquid cutting fluids can be successfully eliminated. This is an important contribution on the road to "green production".
2. EXPERIMENTAL
2.1. Test Material and Machining System Setting
Material selected for testing was martensitic stainless steel X20Cr13 (EN-Nr 1.4021). Chemical composition and mechanical properties are presented in Table 1 and Table 2 respectively.
Table 1. Determined chemical composition (wt%) of X20Cr13.
Fe% C% Si% Mn% P% S% Cr% Mo% Ni% V% Nb% Cu%
85.85 0.236 0.352 0.683 0.044 0.023 11.97 0.125 0.299 0.053 0.07 0.195
Table 2. Determined mechanical properties of X20Cr13 at room temperature.
Yield strength Rp(0.2) [MPa]
Tensile strength Rm [MPa]
Elongation A [%]
Impact energy KCU [J]
Hardness [HB]
750 881 16.36 15 272
The external turning experiments on the round bars of dimensions Ø80 mm × 463 mm were carried on CNC research lathe TU 360 Prvomajska. A tool arrangement comprising a SECO cutting insert DNMG 150608-MF-4 TP 2501 and a tool holder PDJNL 2525M15 was employed. A new cutting edge was utilised for each experiment.
concentrate content in water was 5%. In the chilled air-cooling method, a Ranque-Hilsch vortex tube with counter-flow (Nex FlowTM Frigid-X Cooler System c/w 57025AD) was applied to cool and jet the compressed air into the cutting zone. The inlet air pressure of 0.69 MPa and outlet air temperature of -10°C were set as operating parameters.
2.2. Electrochemical Measurements
For electrochemical testing two specimens were machined from the test material: one applying the flood cooling method and the other applying the chilled air-cooling method. For both, CNC turning was executed with the cutting speed vc = 220 m/min, feed rate f = 0.3 mm/rev and depth of cut ap = 0.4
mm.
Electrochemical measurements were performed with PARSTAT 2263 potentiostat equipped with Electrochemistry PowerSuite software. A basic polarization cell was used consisting of 3.5% NaCl aqueous solution as electrolyte, a X20Cr13 working electrode (one for each specimen) with an immersed area of 1 cm2, a saturated calomel electrode as reference electrode and a counter electrode made of graphite. Two studies were conducted: open circuit potential measurements to investigate the corrosion tendencies and potentiodynamic polarization measurements to determine the instantaneous corrosion rates of the specimens in the given medium [18].
The corrosion potential Ecorr and the corrosion current density jcorr can be found from the
potentiodynamic polarization measurements using the Tafel extrapolation method [19]. When determined properly, jcorr reflects an instantaneous corrosion rate CRE in mm/year at the time of
measurement according to equation given in ASTM Standard G102-89 [20]:
CRE = 3.27×10⁻³EWjcorr⁄ρ (1)
where EW is the equivalent weight in g (here EW = 26.65 g) and ρ is the density in g/cm3 (here ρ = 7.74 g/cm3) of tested material X20Cr13. Described procedure is performed for both specimens.
2.3. Gravimetric Measurements
Two specimens were prepared as for electrochemical measurements and immersed in the electrolyte of the same composition. The specimens were weighed prior to the tests and after 14 days of immersion. Assuming uniform (general) corrosion, the time-averaged corrosion rate CRG in
mm/year was calculated using the equation given in ASTM Standard G1-03 [21]:
CRG = 3.65×10³∆m⁄(Astρ) (2)
2.4. SEM/EDS Testing
Scanning Electron Microscopy coupled with Energy Dispersive X-ray Spectroscopy (SEM/EDS) was applied to determine the surface elemental composition of the specimens after corrosion testing. Specimens were analysed by VEGA TS 5136 MM microscope and Oxford Instruments Si(Li) INCA X-sight device.
2.5. Machinability Testing
The lesser the surface roughness value, the better is the corrosion resistance. This fact is relevant when comparing different cooling methods in martensitic stainless steel turning due to the resistance of the machined surface to corrosion.
In this study, the cooling method, cutting speed vc, feed rate f and depth of cut ap were selected
[image:5.596.46.554.370.443.2]as the control factors. The cooling method was designated on two levels (flood cooling with emulsion and chilled air-cooling), whereas the other control factors were on three levels as shown in Table 3.
Table 3. Control factors in turning of X20Cr13 and their levels.
Symbol Control factors Level 1 Level 2 Level 3
A Cooling method Emulsion Chilled air -
B Cutting speed vc [m/min] 170 220 270
C Feed rate f [mm/rev] 0.2 0.3 0.4
D Depth of cut ap [mm] 0.3 0.4 0.5
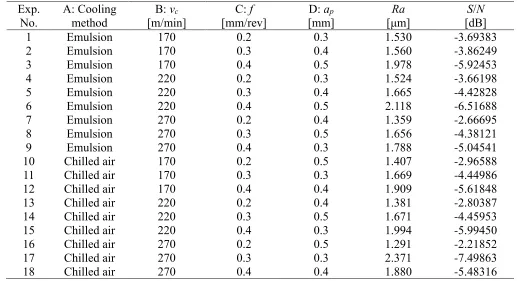
For the specified control factors and their levels, standard L18 Taguchi orthogonal array was selected as the most appropriate. Hence, 18 experiments were made. The surface roughness parameter Ra (mean roughness) was measured using the Hommel Tester T1000 profilometer. The Ra values were directly measured on the workpiece held between the chuck and tailstock, without removing it from the lathe, to avoid possible mistakes due to re-clamping operation. Also, to reduce the deviation, the average value of three measurements was taken as a result.
The obtained Ra data were converted to the signal-to-noise (S/N) ratios in dB to measure the performance characteristics of the levels of control factors against the desired low Ra. The smaller-the-better criterion was expressed as follows [22]:
S N⁄ = -10 log10(n-1∑ y
i
2
n
i=1 ) (3)
3. RESULTS AND DISCUSSION
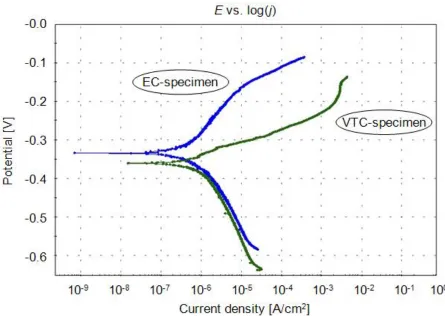
[image:6.596.174.419.123.379.2]3.1. Electrochemical Results
Figure 1. Open circuit potential curves of the emulsion cooled (EC) and the vortex tube cooled (VTC) X20Cr13 specimens in 3.5% NaCl aqueous solution at 25°C.
For the emulsion cooled or EC-specimen and the vortex tube cooled or VTC-specimen immersed in 3.5% NaCl aqueous solution at 25°C, the quasi-stationary Eoc values have been reached
after 1800 s. The summary Eoc-t plot and recorded Eoc values are presented in Figure 1 and Table 4
respectively.
Table 4. Open circuit potential values obtained from open circuit potential curves.
Specimen Initial Eoc Eoc after 900 s Eoc after 1800 s
EC -254.3 mV -294.0 mV -328.6 mV
VTC -352.8 mV -396.2 mV -383.0 mV
From the Eoc curves a comparison between the two specimens during an external longitudinal
turning operation can be carried out. There is a clear evidence of the effect of the cooling method through the variation of Eoc. The EC-specimen shows the quasi-stationary Eoc value closer to zero, and
thus the better corrosion properties compared to the VTC-specimen. However, the Eoc curve of
EC-specimen tends to fall. The cause of this occurrence is the presence of an oil film, which after some time is decayed and after that the corrosion resistance of the EC-specimen decreases. The VTC-specimen shows a slight decrease in the Eoc curve at the beginning and then, after some time, it tends to
[image:6.596.46.506.570.614.2]
Figure 2. Potentiodynamic polarization curves of the emulsion cooled (EC) and the vortex tube cooled (VTC) X20Cr13 specimens in 3.5% NaCl aqueous solution at 25°C (scan rate 0.166 mV/s).
This result indicates a phenomenon of depassivation-passivation. There appears to be delayed spontaneous creation and gradual thickening of the passive oxide film (i.e. protective layer) on the VTC-specimen surface and the corrosion resistance is on increase over a longer time period.
Potentiodynamic polarization curves obtained at a scan rate of 0.166 mV/s are presented in the semi-logarithmic plot in Figure 2. For each specimen, the main parameters of the corrosion process i.e. the slopes ba and bc of anodic and cathodic Tafel lines, corrosion potential Ecorr and corrosion current
density jcorr were extracted from the belonging curve by Electrochemistry PowerSuite software.
[image:7.596.74.519.85.401.2]The obtained data and calculated corrosion rates CRE from Equation (1) are given in Table 5.
Table 5. Tafel data and calculated corrosion rates.
Specimen ba [mV/decade] bc [mV/decade] Ecorr [mV] jcorr [μA/cm2] CRE [mm/year]
EC 131.6 153.7 -332.7 0.555 0.00625
VTC 116.9 238.2 -359.7 1.533 0.01726
Regarding the Tafel slopes ba and bc it should be pointed out that an alloy with a tendency
towards passivation will have ba > bc while an alloy that corrodes will have ba < bc [23]. The values of
[image:7.596.44.553.645.689.2]
determined values of Ecorr are smaller than those corresponding to Eoc in Table 4. This is expected with
the occurrence of a depassivation phenomenon on the surface during cathodic scanning [24]. The EC-specimen exhibits greater value of Ecorr than the VTC-specimen, thus demonstrating a lower
predisposition to undergo corrosion. The value of jcorr is considerably lower for the EC-specimen.
Since the values of CRE are directly proportional to the values of jcorr, the VTC-specimen displays
higher corrosion rate.
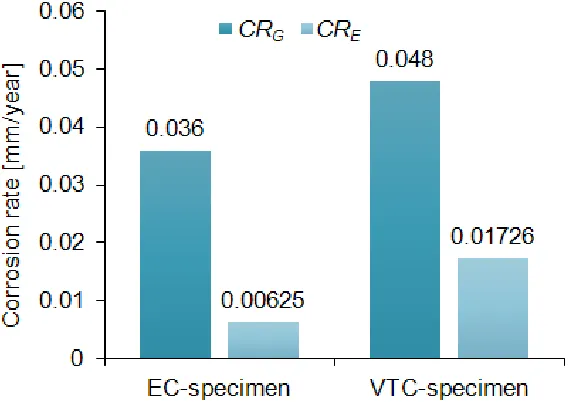
3.2. Comparison of Gravimetric and Electrochemical Corrosion Rates
Mass loss measurement generally gives a true corrosion rate occurring during specimen exposure to electrolyte. For the tested specimens, the mass losses after 14 days of immersion as well as calculated corrosion rates CRG from Equation (2) can be found in Table 6. It can be seen that
[image:8.596.45.505.352.393.2]EC-specimen is more corrosion resistant in 3.5% NaCl aqueous solution at 25°C than VTC-EC-specimen.
Table 6. Gravimetric corrosion rates after 14 days in 3.5% NaCl aqueous solution at 25°C.
Specimen Initial mass [g] Δm [g] CRG [mm/year]
EC 4.5307 0.0059 0.036
VTC 4.4051 0.0078 0.048
Corrosion rate obtained by mass loss measurement is total corrosion rate and obtained by Tafel method is momentary corrosion rate. Hence, the gravimetric corrosion rate can be substantially different from the electrochemical corrosion rate. The difference may arise ordinarily due to time effects and unusually due to errors made in determining the corrosion current density [25].
[image:8.596.157.445.498.699.2]
The gravimetric and electrochemical corrosion rates are compared in Figure 3. As can be seen, the gravimetric corrosion rate of the EC-specimen was 5.76 times higher than the electrochemical one, but both were well below the permissible value of 0.1 mm/year. However, the gravimetric corrosion rate of the VTC-specimen was only 2.78 times higher than the electrochemical one. This is in consistent with the outcome of open circuit measurements and leads to an important conclusion that chilled air-cooling method in turning the tested material X20Cr13 has a beneficial effect on the corrosion resistance over a longer time period.
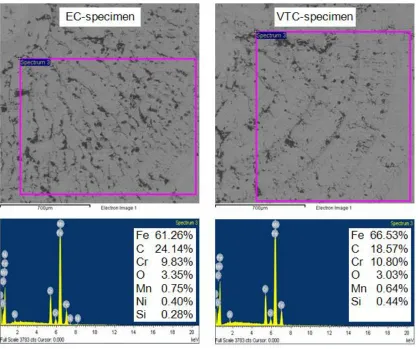
3.3. SEM/EDS Results
The intensity of passivation of stainless steels is most affected by the mass fraction of Cr. In most environments, Cr has the ability to form a stable and passive oxide film on the surfaces of stainless steels that protects them from further corrosion. The corrosion resistance is also influenced by the mass fraction of C. The higher it is, the greater the danger of carbide formations. If C is combined with Cr (chromium carbide) it may have a detrimental effect on corrosion resistance by reducing the amount of Cr available to ensure corrosion resistance property [26]. Therefore, it is desirable to have the highest possible Cr percentage and the lowest possible C content.
[image:9.596.91.509.379.728.2]
SEM/EDS analysis was used to identificate the chemical elements and their percentages inside the observed surfaces on the specimens after corrosion testing in 3.5% NaCl aqueous solution at 25°C for 30 min. The results are shown in Figure 4. For the EC-specimen, the analysis confirmed the presence of Fe, C, Cr, O and less amounts of Mn, Ni, Si on the surface. The presence of O and C was an indication of oxides and carbides formation on the surface. Also, in a chloride environment, Ni could form a stable passive nickel oxide layer. For the VTC-specimen, the analysis confirmed the presence of all elements as for the EC-specimen with the exception of Ni.
In comparison to the EC-specimen, the VTC-specimen had more Cr, appreciably less C and slightly less O. Hence, it is reasonably to say that chilled air-cooling method in turning the tested material X20Cr13 does not degrade noticeably its corrosion resistance.
3.4. Machinability Results
[image:10.596.38.555.441.722.2]After obtaining the Ra (mean roughness) data from the experiments, corresponding S/N ratios were calculated using Equation (3) as given in Table 7. Then, an average of the S/N ratios for each level of control factors individually was determined as listed in Table 8. The total mean of S/N ratios for 18 experiments is also listed. In order to determine the influence of each control factor on the Ra, a graphical analysis of data in Table 8 was performed using the main effects plot for S/N ratios shown in Figure 5.
Table 7. Experimental machinability results and corresponding S/N ratios.
Exp. No.
A: Cooling method
B: vc
[m/min]
C: f [mm/rev]
D: ap
[mm]
Ra [μm]
S/N [dB]
1 Emulsion 170 0.2 0.3 1.530 -3.69383
2 Emulsion 170 0.3 0.4 1.560 -3.86249
3 Emulsion 170 0.4 0.5 1.978 -5.92453
4 Emulsion 220 0.2 0.3 1.524 -3.66198
5 Emulsion 220 0.3 0.4 1.665 -4.42828
6 Emulsion 220 0.4 0.5 2.118 -6.51688
7 Emulsion 270 0.2 0.4 1.359 -2.66695
8 Emulsion 270 0.3 0.5 1.656 -4.38121
9 Emulsion 270 0.4 0.3 1.788 -5.04541
10 Chilled air 170 0.2 0.5 1.407 -2.96588
11 Chilled air 170 0.3 0.3 1.669 -4.44986
12 Chilled air 170 0.4 0.4 1.909 -5.61848
13 Chilled air 220 0.2 0.4 1.381 -2.80387
14 Chilled air 220 0.3 0.5 1.671 -4.45953
15 Chilled air 220 0.4 0.3 1.994 -5.99450
16 Chilled air 270 0.2 0.5 1.291 -2.21852
17 Chilled air 270 0.3 0.3 2.371 -7.49863
18 Chilled air 270 0.4 0.4 1.880 -5.48316
reducing the Ra since it has the largest difference in the values of S/N ratio (between maximum and minimum), followed by depth of cut ap (factor D), cutting speed vc (factor B) and cooling method
(factor A). However, accurate statistical and physical significance as well as the contribution of control factors should be established by analysis of variance (ANOVA).
Table 8. S/N response table (means).
Level A B C D
1 -4.46462 -4.41918 -3.00184 -5.05737
2 -4.61027 -4.64417 -4.84667 -4.14387
3 / -4.54898 -5.76383 -4.41109
Total mean of S/N = -4.53744
The degree of freedom DF, sum of squares SS, mean squares MS (variance), F-value (calculated variance ratio) and F0-value (tabulated variance ratio) were determined along with a
percentage contribution Cp of each source of variation. The ANOVA results are presented in Table 9.
The Cp indicates the relative power of the source to reduce variation. The higher the Cp value, the more
important is the contribution of source change.
[image:11.596.42.509.186.257.2]Figure 5. Main effects plot for S/N ratios.
Table 9. ANOVA results.
Source DF SS MS F-ratio F0-ratio Cp [%]
A 1 0.09547 0.09547 0.109 3.285(0.01, 1, 10) 0.27
B 2 0.15307 0.07653 0.088 2.924(0.01, 2, 10) 0.43
C 2 23.74629 11.87314 13.573* 2.924(0.01, 2, 10) 67.10
D 2 2.64710 1.32355 1.513 2.924(0.01, 2, 10) 7.48
Error 10 8.74791 0.87479 24.72
[image:11.596.136.463.395.596.2] [image:11.596.46.551.665.765.2]
The ANOVA results indicate that the cooling method, vc, f and ap influence the Ra by 0.27%,
0.43%, 67.10% and 7.48%, respectively. Hence, the f is confirmed to be the most important factor affecting the Ra. According to Table 9, it can be said that the ap, vc and cooling method have no
statistical and physical significance with respect to the Ra at the confidence level of 99% because their F-calculated values are less than corresponding F0-tabulated values. The ANOVA also shows that the contribution of error is high (24.72 %), which distinctly suggests the existence of the interaction effects of control factors.
In the scope of this study, the most interesting finding is that about non-significant influence of the cooling method on reducing the Ra and consequently on increasing the corrosion resistance of machined surface. Therefore, the flood cooling with emulsion can be replaced with the chilled air-cooling using the vortex tube during turning the martensitic stainless steel X20Cr13 as the corrosion resistance remains unaffected.
4. CONCLUSIONS
The utilization of cutting fluids is commonly recommended in machining of martensitic stainless steels. The ever growing challenge to practise a green machining without sacrificing the machining performances direct the manufacturing industry to the development and implementation of the alternatives to conventional liquid coolants, which will not be a threat to the future or sustainability of machining. A chilled jet of compressed air is one such alternative. However, corrosion of the workpiece can occur even in dry machining when no cutting fluid is used. The presented study offers indispensable knowledge on the feasibility of replacing conventional emulsion coolant with the chilled air generated by the vortex tube, also taking into account the corrosion resistance of the martensitic stainless steel X20Cr13 after the turning operation. From the investigation results, the following conclusions can be summarized:
According to open circuit potential measurements, the chilled air-cooling method provokes a delayed spontaneous creation and gradual thickening of the passive oxide film on the surface of tested material, which forms a protective layer, and the corrosion resistance is on increase over a longer time period.
According to potentyodinamic polarization measurements, the emulsion cooled surface of tested material shows a lower corrosion predisposition.
Comparison of gravimetric versus electrochemical corrosion rates confirms the outcome of open circuit measurements.
According to SEM/EDS analysis, the chilled air-cooling method does not degrade noticeably the corrosion resistance of tested material.
According to Taguchi analysis, the feed rate f has the greatest influence in reducing the surface roughness parameter Ra, followed by depth of cut ap, cutting speed vc and cooling method.
According to ANOVA, the f is confirmed to be the most significant factor influencing the Ra, the ap, vc and cooling method have no statistical and physical significance, and an existence of
The most motivating discovery in the above findings is surely the non-significant influence of the cooling method on reducing the Ra and consequently on increasing the corrosion resistance of the machined surface. It greatly encourages the replacement of emulsion cooling with chilled air-cooling generated by the vortex tube. Therefore, the green turning of martensitic stainless steel X20Cr13 is feasible without sacrificing the machining performance and the ecological burden inherent in the conventional liquid coolant can be removed.
It would be of further interest to develop mathematical models, which describe the dependence of corrosion resistance on the roughness of machined surface with respect to the cooling methods. Besides, it is necessary to examine the impact of chilled air-cooling on the tool wear. At last, it would also be desirable to check the costs of introducing chilled air-cooling system.
ACKNOWLEDGEMENTS
This work was supported by the University of Rijeka, Croatia under Grant No. 13.09.1.2.10. References
1. BSSA, General principles of machining stainless steels (2017).
http://www.bssa.org.uk/topics.php?article=192 (accessed Nov 18, 2017).
2. M. Soković and K. Mijanović, J. Mater. Process. Technol., 109 (1-2) (2001) 181. 3. G. Byrne, D. Dornfeld and B. Denkena, CIRP Ann., 52 (2) (2003) 483.
4. S. Ueno, Y. Shiomi and K. Yokata, Ind. Health, 40 (2002) 291. 5. C. Mackerer, Toxicol. Ind. Health, 5 (1989) 429.
6. P.S. Thorne, J.A. DeKoster and P. Subramanian, Am. Ind. Hyg. Assoc. J., 57 (12) (1996) 1163. 7. T.J. Bierma and F.L. Waterstraat, Total cost of ownership for metalworking fluids. Research report
105, Illinois Waste Management and Research Center, 2004.
8. V.P. Astakhov, Ecological machining: near-dry Machining. In Machining: fundamentals and recent advances; Davim, J.P., Ed.; Springer-Verlag (2008) London, pp 195-223.
9. F. Pusavec, D. Kramar, P. Krajnik and J. Kopač, J. Cleaner Prod., 18 (12) (2010) 1211.
10.L. Celent, Implementation of compressed cold air using vortex tube in milling process. PhD Thesis, University of Split, FESB, Croatia, (in Croatian) (2014).
11.U.S. Dixit, D.K. Sarma and J.P. Davim, Environmentally friendly machining, Springer (2012) New York, USA.
12.J. Liu and Y.K. Chou, Int. J. Mach. Tools Manuf., 47 (3-4) (2007) 635.
13.Y. Su, N. He, L. Li, A. Iqbal, M.H. Xiao, S. Xu and B.G. Qiu, Int. J. Mach. Tools Manuf., 47 (6) (2007) 927.
14.B. Boswell, Use of air-cooling and its effectiveness in dry machining processes, PhD Thesis, Curtin University, Australia (2008).
15.V.S. Sharma, M. Dogra and N.M. Suri, Int. J. Mach. Tools Manuf., 49 (6) (2009) 435. 16.N.M. Liu, K.T. Chiang and C.M. Hung, Int. J. Adv. Manuf. Technol., 67 (5-8) (2013) 1053. 17.G. Foltz, Corrosion and metalworking fluids (2003).
http://www.productionmachining.com/articles/corrosion-and-metalworking-fluids (accessed Nov 18, 2017).
18.L. Yang (Ed.) Techniques for corrosion monitoring, Woodhead Publishing (2008) Cambridge, UK. 19.N. Popov, Corrosion engineering: principles and solved problems, 1st ed.; Elsevier (2015).
20.ASTM G102-89. Standard practice for calculation of corrosion rates and related information from electrochemical measurements; ASTM International: West Conshohocken, PA, 2015e1.
ASTM International: West Conshohocken, PA, 2011.
22.O. Zerti, M.A. Yallese, S. Belhadi and L. Bouzid, Taguchi design of experiments for optimization and modelling of surface roughness when dry turning X210Cr12 steel. In Applied mechanics, behaviour of materials, and engineering systems. Lecture Notes in Mechanical Engineering; T. Boukharouba, G. Pluvinage, K. Azouaoui, Eds.; Springer: Cham, (2017), pp 275-288.
23.R. Rashad, A.E. Amer, A.Y. Shash and H. Shendy, Effect of alloying elements on corrosion, microstructure and mechanical properties for casted free-nickel duplex stainless steels. In
Mechanical and materials engineering of modern structure and component design; A. Öchner, H. Altenbach, Eds.; Springer: Switzerland, (2015); Advanced Structured Materials, Vol. 70, pp 1-11. 24.F.E.-T. Heakal and Kh.A. Awad, Int. J. Electrochem. Sci., 6 (2011) 6483.
25.X.G. Zhang, Corrosion and electrochemistry of zinc; Springer (1996) US.
26.B. Moisă, Influence of chemical composition on stainless steels mechanical properties, Proceedings of the 13th WSEAS International Conference MACMESE '11; M. Demiralp, Z. Bojkovic, A. Repanovici, Eds.; WSEAS Press: Stevens Point, 2011; pp 95-100.