Research Article
Hybrid PET/MR Kernelised Expectation Maximisation
Reconstruction for Improved Image-Derived Estimation of the
Input Function from the Aorta of Rabbits
Daniel Deidda ,
1,2Nicolas A. Karakatsanis,
3,4Philip M. Robson,
3Claudia Calcagno,
3Max L. Senders,
3Willem J. M. Mulder,
3Zahi A. Fayad,
3Robert G. Aykroyd ,
2and Charalampos Tsoumpas
1,31Biomedical Imaging Science Department, University of Leeds, Leeds, UK 2Department of Statistics, University of Leeds, Leeds, UK
3Translational and Molecular Imaging Institute (TMII), Department of Radiology, Icahn School of Medicine at Mount Sinai, New York, NY, USA
4Division of Radiopharmaceutical Sciences, Department of Radiology, Weill Cornell Medical College, Cornell University, New York, NY, USA
Correspondence should be addressed to Daniel Deidda; [email protected]
Received 28 June 2018; Revised 15 November 2018; Accepted 21 November 2018; Published 16 January 2019
Academic Editor: Anne Roivainen
Copyright © 2019 Daniel Deidda et al. This is an open access article distributed under the Creative Commons Attribution License, which permits unrestricted use, distribution, and reproduction in any medium, provided the original work is properly cited. Positron emission tomography (PET) provides simple noninvasive imaging biomarkers for multiple human diseases which can be used to produce quantitative information from single static images or to monitor dynamic processes. Such kinetic studies often require the tracer input function (IF) to be measured but, in contrast to direct blood sampling, the image-derived input function (IDIF) provides a noninvasive alternative technique to estimate the IF. Accurate estimation can, in general, be challenging due to the partial volume effect (PVE), which is particularly important in preclinical work on small animals. The recently proposed hybrid kernelised ordered subsets expectation maximisation (HKEM) method has been shown to improve accuracy and contrast across a range of different datasets and count levels and can be used on PET/MR or PET/CTdata. In this work, we apply the method with the purpose of providing accurate estimates of the aorta IDIF for rabbit PETstudies. In addition, we proposed a method for the extraction of the aorta region of interest (ROI) using the MR and the HKEM image, to minimise the PVE within the rabbit aortic region—a method which can be directly transferred to the clinical setting. A realistic simulation study was performed with ten independent noise realisations while two, real data, rabbit datasets, acquired with the Biograph Siemens mMR PET/MR scanner, were also considered. For reference and comparison, the data were reconstructed using OSEM, OSEM with Gaussian postfilter and KEM, as well as HKEM. The results across the simulated datasets and different time frames show reduced PVE and accurate IDIF values for the proposed method, with 5% average bias (0.8% minimum and 16% maximum bias). Consistent results were obtained with the real datasets. The results of this study demonstrate that HKEM can be used to accurately estimate the IDIF in preclinical PET/MR studies, such as rabbit mMR data, as well as in clinical human studies. The proposed algorithm is made available as part of an open software library, and it can be used equally successfully on human or animal data acquired from a variety of PET/MR or PET/CT scanners.
1. Introduction
[18F]-based PET imaging has been successfully used as a
noninvasive imaging biomarker of different human diseases.
[18F]-Sodium fluoride ([18F]-NaF) has been associated
with calcium molecular metabolism, and it has been used to study benign osseous diseases such as osteoporosis, vascular
calcification, osteoarthritis, and rheumatoid arthritis [1–6].
[18F]-Fluodeoxyglucose ([18F]-FDG) is the most commonly used
in clinical practice and particularly for the detection, quantifi-cation, staging, and therapy evaluation of cancerous lesions, as well as in cardiovascular and neurological diseases [7–12].
Accurate and precise quantitative biomarkers can be obtained by exploiting the pharmacokinetic information in
the measured data [13]. This requires the estimation of the radiotracer concentration in the arterial blood plasma (input function). The gold standard for such measurement is blood sampling during the PET acquisition, via arterial cannula-tion [14]. Unfortunately, this technique is invasive and can be complicated, as it requires arterial blood samples in specific quantities and at precise times with corrections for delay and dispersion to account for the distance between the sampling site and the regions of interest (ROIs) [15].
A noninvasive technique is the image-derived input function (IDIF) [16] which uses a region of interest (ROI) to measure the uptake in the vessel over time. The IDIF is a simple way to calculate activity over time; however, it is challenging due to image-related issues. Firstly, the choice of the ROI has a very important impact, and nonaccurate ROIs will affect the measurement [17, 18]. Other challenges are related to the use of MR images to extract the ROI because a potentially inaccurate registration between PET and MR images can lead to erroneous estimates of the activity in the chosen arterial ROI. With a hybrid PET/MR scanner, the problem of coregistration is expected to be minimised.
The aforementioned problems are mostly related to the ordered subsets expectation maximisation (OSEM) method [19] which is usually followed by postreconstruction Gaussian filtering due to the high noise levels expected for the very short-time frames used for the IDIF estimation. OSEM with or without postfiltering has been shown to produce inaccurate values of IDIF with bias up to 30% propagating through the kinetic constant calculations [20]. In preclinical experiments, these issues can be even more challenging [13, 21] because of the smaller size of animal vessel tissue, such as rabbit aortas, especially when they are performed with clinical scanners designed for larger human subjects. In this case, the PVE can be significant, as the diameter of the rabbit aorta is about 5 mm which is the same order of magnitude as the PET resolution.
Different studies have proposed methods for the use of IDIF by correcting or avoiding PVE [22–26]. Zanotti-Fregonella et al. [16] have shown in their comparison be-tween cannulation-based and image-derived input functions that the use of high-resolution PET images is often not sufficient to avoid the need of cannulation to obtain a reliable IDIF. Moreover, the accuracy of the IDIF may vary between radiotracers and scanners. MR-guided techniques have been proposed and discussed [15], showing that erroneous regis-tration between the PET and the MR images, as well as er-roneous MR segmentation, can introduce an error in the IDIF estimation. The problem of PET/MR misalignment has been discussed for the kernel by Deidda et al. [27]. In this study, we apply a PET/MR-guided image reconstruction algorithm, hybrid kernelised expectation maximisation (HKEM) [28], to minimise PVE during the reconstruction step so that we can obtain more accurate IDIF estimates. In addition, to minimise the PET/MR misalignment, the HKEM-reconstructed image at the peak activity frame was used together with the MR image to extract the ROI to be used for the estimation of the input function. In this way, only a percentage of the maxi-mum value is included in the ROI avoiding low-value voxels outside the carotid in case of PET/MR misalignment.
The kernel method [29], which was first introduced in PET image reconstruction by Wang and Qi [30] and Hutchcroft et al. [31, 32], makes use of only one prior in-formation image, MR or PET, respectively. Furthermore, many other studies showing promising performances have appeared in the literature [33–39]. In contrast, the HKEM method, which we recently developed in the open-source STIR library [40], exploits both the PET and the MR cor-egistered images to derive PET information iteration after iteration.
The HKEM algorithm was introduced by Deidda et al. [28] as a method for improving PET image resolution and uptake recovery in PET/MR phantom experiments, as well as contrast and quantification of atherosclerotic plaque le-sions in carotid arteries in clinical PET/MR studies—which could also be applied in PET/CT studies. In addition, it is a robust and stable method which gives consistent results across different datasets using the same parameter settings. In this paper, we focus on the quantification of the aorta IDIF of rabbits using18F-based radiotracers such as [18 F]-FDG and [18F]-NaF, to extend the applicability and use-fulness of our novel reconstruction algorithm. Here, we assume that if HKEM can recover the uptake while retaining satisfactory noise suppression for low-count PET acquisi-tions, it will also be capable of providing accurate IDIF estimates using a wide range of dynamic PET frame durations.
The paper is structured as follows: Section 2 describes the datasets used to study image reconstruction, list mode (LM) subsampling, and the experimental methodology. Section 3 presents the results of the proposed method and comparison with different standard algorithms. The results are discussed in Section 4, and conclusions are drawn in Section 5.
2. Methods and Materials
2.1. Simulation. A realistic simulation was created using a
model derived from real [18F]-NaF rabbit data [41] and utilities implemented in the STIR library. The real data were acquired with the Siemens Biograph mMR scanner at Mount Sinai Hospital, NY, USA. The voxel size for the simulated image was 1.56×1.56×2.031 mm. The rabbit was a healthy subject and was anaesthetised before the scan. It was injected with [18F]-NaF 170 MBq and scanned for 90 minutes. Different organs and tissues were segmented from the ac-quired MR UTE sequence, using 0.07 ms echo time. The original voxel size is 1.56×1.56×1.56 mm. It is then aligned to the PET field of view (FOV) and resliced to match the PET native voxel size, 1.56×1.56×2.031 mm3, and FOV size, 344
The measured values were then assigned to every tissue in the simulation.
In order to create the projection data, each simulated image is forward projected into the sinogram space. The attenuation sinogram is estimated using the attenuation coefficient, μ, map obtained from a Dixon MR sequence [42–45], and the precalculated hardware attenuation co-efficients for the bed and coils. The projection data con-taining random events were estimated as a uniform sinogram containing 20% of the total number of events in the simulated acquisition sinogram. In order to estimate the scattered events, the Watson single scatter simulation was applied [46], and a mask obtained from theμmap was used for the tail fitting. At this point, the random and scatter sinograms were combined as an additive term in the emission sinogram to create the modelled prompts pro-jection data. The final step was the simulation of Poisson noise from the prompts events.
The above steps were repeated for each simulated frame image, and 10 noise realisations were created.
2.2. Real Rabbit Data. The acquisition was carried out using
the Siemens Biograph mMR at Mount Sinai Hospital, NY, USA. The rabbit was a healthy subject and was anaesthetised during the scan. It was injected with [18F]-NaF 170 MBq for the first study and [18F]-FDG 133 MBq for the second, both scanned for 90 minutes. The attenuation images were ob-tained from the scanner, which included the attenuation coefficient for bed and coils. The LM data were divided into smaller frames, to permit calculation of the input function. The tracer was injected during the first seconds of the scan. The MR part of the kernel matrix was obtained from a MR UTE sequence with 0.07 ms echo time, and the original voxel size was 1.56 ×1.56×1.56 mm. It was then aligned to the PET field of view (FOV) and resliced to match the PETnative z voxel size, 1.56×1.56×2.031 mm3, and FOV size, 344×
344×127 voxels.
2.3. Reconstruction Setup. All the datasets were
recon-structed using HKEM with 21 subsets and 10 iterations. The PET image voxel, λj, using the HKEM can be written as
λj�
Nj
f�1
αfkfj, (1)
wherekfjis thefjthelement of the kernel,N
jis the number
of feature vectors related to voxel j, and αf is the kernel
coefficient to be estimated iteratively as follows:
α(fn+1)�
α(fn)
jk(fjn)ipfij
k(fjn)
i
pij 1
lpilfkfl(n)α(fn)+si
,
(2)
withpij being the system matrix andsi the additive term.
Thefjthelement of the kernel consists in two components,
and it can be written as follows:
kfj(n)�kmvf,vj·kp z
(n)
f ,z
(n)
j
, (3)
where
kmvf,vj�exp −
vf−vj
2
2σ2
m
⎛ ⎜ ⎜
⎝ ⎞⎟⎟⎠exp − xf−xj
2
2σ2
dm
⎛ ⎜ ⎜
⎝ ⎞⎟⎟⎠,
(4)
is the kernel derived from the MR image and
kp z(fn),z
(n)
j
�exp − z
(n)
f −z
(n)
j
2
2σ2
p
⎛ ⎜ ⎜
⎝ ⎞⎟⎟⎠exp − xf−xj
2
2σ2
dp
⎛ ⎜ ⎜
⎝ ⎞⎟⎟⎠,
(5)
is the kernel component derived from the updated PET image. The Gaussian kernel functions have been modulated by the distance between voxels in the image space. The quantity xj is the coordinate of the jth voxel, n is the
subiteration number,z(jn)andvjare the feature vectors that
are calculated from thenthupdated PET image and the MR
image, respectively, andσm,σp,σdm, andσdpare the scaling
parameters for the distances in (4) and (5). Note that the HKEM uses a voxel-wise kernel. This means that the feature vector assigned for each voxel contains only one nonzero element with the same voxel value.
The kernel parameters were chosen in order to obtain the minimum RMSE in the aorta. The values of the kernel parameters were set as follows: N�27,σm � 1,σdm �3,
σp�1, andσdp �3 (the last two are only used by HKEM).
For comparison, the same datasets have been recon-structed also with 21 subsets and 10 iterations of OSEM with and without 3 mm FWHM Gaussian postfilter. These methods are denoted as OSEM+G and OSEM, respectively, in this study. The selected number of subsets and the ap-plication of the Gaussian post-filter are considered as standard settings in clinical routine. All datasets were reconstructed using span 1.
Scatter correction was performed with the method de-scribed by Tsoumpas et al. [47] and Polycarpou et al. [48]. Randoms were estimated from singles, which were calcu-lated from delayed events [49]. The procedures for these evaluations, including attenuation and normalisation cor-rections [50], make use of STIR.
2.4. Image Analysis. The comparison was carried out in
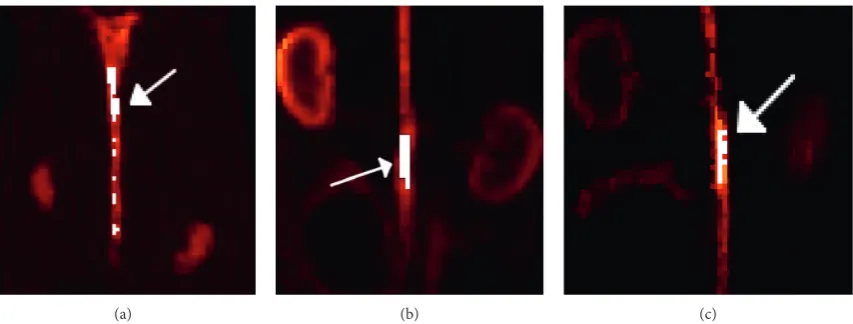
terms of the mean value for all of the short frames and datasets, and the bias was estimated for the simulation to assess the accuracy of the proposed method. The ROI was obtained using the HKEM-reconstructed image and the MR image as follows (Figure 1):
(i) The aorta was segmented from the MR image using the semiautomatic segmentation method in ITK-SNAP based on thresholding [51]
(iii) The ROI,A, is obtained by taking into account only the voxels with a value bigger than 75% of the maximum in order to optimize those affected by PVE
Ai� 1, A
s
i≥0.75·A s max,
0, otherwise,
(6)
where Iis the index of the voxel. Quantitative comparison between algorithms was performed using the following figures of merit:
meank �tk�
V j�1tjk
V ,
(7)
biask �
tk−ATk
AT k
·100, (8)
CoVk�
��������������������
1/(V−1)V
j�1tjk−tk
2
tk ×100,
(9)
wheretkis the mean value of the target ROI at framek,tjkis the value of voxeljwithin the ROI at framek, andVis the number of voxels within the ROI. The ROIs obtained with the proposed method are shown for each dataset in Figure 2.
3. Results
3.1. Simulation. The IDIF estimates for the simulated rabbit
data and the early and late frames for the IDIF are illustrated
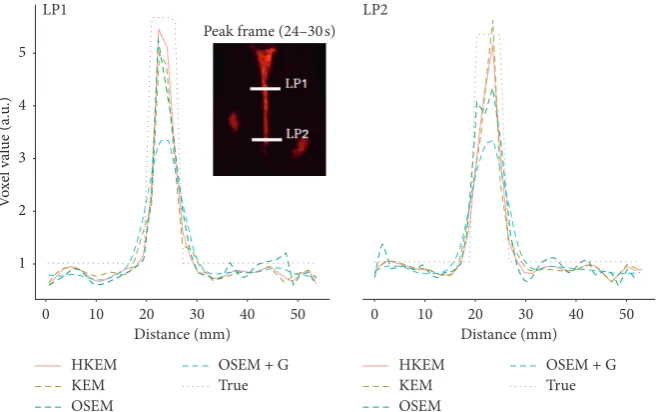
in Figure 3. In the same figure, the reconstructed images with OSEM, OSEM+G, KEM, and HKEM, at the peak frame (24–30 s), are shown. Figure 4 presents the line profile of the aorta estimated for the images, as reconstructed with all investigated methods, at two different positions (LP1 and LP2), while Figure 5 reports the median IDIF estimated over the ten noise realisations using the HKEM. The shaded region is the range of possible values over the 10 simulated datasets, and the dashed line is the true IDIF. Finally, Table 1 reports the percentage value of the mean, maximum, and minimum absolute bias over the frames and the noise realisations.
A voxel-wise analysis example is reported in Figure 6, where the 10 peak frame images were combined to extract the bias and the SD images for each algorithm.
3.2. NaF Study. Figure 7 shows the comparison, on the
bottom row, between the initial 200 s of the input function on the left, and the later section of the IDIF on the right. Moreover, to give an idea of the image quality, the recon-structed [18F]-NaF images for the peak time are shown on the top. Figure 8 reports the line profile of the aorta in two different positions (LP1 and LP2) for the [18F]-NaF peak images reconstructed with the investigated methods to il-lustrate in detail the differences between the images reconstructed with different techniques. Figure 9 gives an example of fused PET/MR image quality for all the re-construction techniques.
3.3. FDG Study. The IDIF was estimated for a [18F]-FDG
study in order to assess the method on a different tracer. Ai=
1, s
0, otherwise.
Ai≥ 0.75·Amaxs ,
HKEM PET
ROI: A
MR
MR segmentation
PET segmentation
ROI extraction
Figure 10 shows a comparison among the different algo-rithms in terms of image quality at the [18F]-FDG peak activity frame, input function values. On the bottom row, we can see the initial 200 s of the input function on the left and the remaining part of the IDIF on the right, while on the top, the reconstructed images for the peak frame are shown. Figure 11 reports the line profile of the aorta in two different positions (LP1 and LP2) for the [18F]-FDG peak images reconstructed with all the investigated methods.
4. Discussion
In this study, we have proposed the use of our recently developed hybrid kernelised reconstruction algorithm HKEM, for the estimation of the IDIF in the aorta artery of rabbits having undergone [18F]-FDG and [18F]-NaF PET/ MR studies using a clinical PET/MR scanner. The study was driven by the fact that many applications, where dynamic PET is used to extract more accurate and precise kinetic
(a) (b) (c)
Figure2: Regions of interest (ROIs) chosen for this study, defined by the white regions. The target ROIs for the (a) aorta in the simulation, (b) [18F]-NaF rabbit study, and (c) [18F]-FDG rabbit study. The target ROIs are indicated by the white arrows.
True OSEM OSEM + G KEM HKEM 6
0
KEM HKEM
OSEM
OSEM + G True KEM
HKEM
OSEM
OSEM + G True Early frames
5
3
M
ea
n (a.u
.)
2
1
0 4
0 50 100
Time (s) 150 200
Late frames 1.8
1.2 1.4 1.6
1.0
0.6 0.8
M
ea
n (a.u
.)
500 1000 1500
Time (s)
2000
[image:5.600.89.516.71.233.2] [image:5.600.131.473.282.602.2]imaging biomarkers, rely on the estimation of the IDIF which is problematic in preclinical studies due to extensive PVE. As a consequence, it is relevant to propose a method which provides accurate estimates of IDIF. The results in Figure 3 show that the proposed reconstruction method and ROI extraction provide accurate results for all time points. The mean, maximum, and minimum bias were also calcu-lated over the frames and the ten noise realisations (Table 1).
We were able to obtain a mean bias of 5% using the HKEM with the maximum value being 16.1%. Note that due to the applied threshold in the definition of the ROI, the OSEM also provided accurate results although the dynamic PET image frames were very noisy, and thus it becomes chal-lenging to accurately delineate the appropriate aortic input function ROI, which is crucial for the IDIF calculation. In addition, a 52% averaged CoV over noise realisations means that there is a probability of about 68% that the repeated measure will have a value within ±52% around the mean. As a consequence, values with high bias are very likely with OSEM. The results suggest that MR information can provide substantial improvement in terms of PVE and noise sup-pression. Nevertheless, the inclusion of the PET functional information allows better accuracy at similarly low noise levels (Table 1), compared to KEM. Figure 4 shows the line profiles in two different points of the carotid for the image corresponding to the peak. Here, we can notice the better delineation of the aorta for both the KEM and HKEM MR-guided techniques, thanks to the broader smoothness ap-plied in the background tissue regions. It is also important to highlight that the extraction of the ROI from the OSEM image in Figure 1 would not be accurate, as the maximum value was very high due to noise. Thus, the 75% thresholding would only extract very few voxels, therefore causing up to 100% bias in the OSEM IDIF values despite being associated with high accuracy estimates. Figure 5 illustrates the median full IDIF estimate over the 10 realisations, and it is possible to notice the accuracy over time compared to the true values. A voxel-wise analysis example is reported in Figure 6, where it can be seen the better image quality of KEM and HKEM, with lower bias in the aorta and low SD overall. The ROI analysis was also performed on this image. The results re-ported in Table 2 are in agreement with the ROI analysis performed with all the frames. Due to the optimized ROI, OSEM gives a similar bias value to HKEM on the peak
M
ea
n (a.u
.)
6
4
2
0
0 500
Time (s)1000 1500
HKEM True
Figure5: Median IDIF estimated over the ten noise realisations using the HKEM. The shaded region is the range of possible values over the 10 simulated datasets, and the dashed line is the true IDIF.
Vo
xe
l val
ue (a.u
.)
5
4
3
2
1
LP1 LP2
0 10 20 30 40
Distance (mm) 50 0 10 Distance (mm)20 30 40 50
Peak frame (24–30s)
HKEM KEM OSEM
OSEM + G
True HKEMKEM
OSEM
OSEM + G True
Figure4: A comparison between the true line profiles, LP1 and LP2, and the ones obtained from the reconstructed image with OSEM, OSEM+G, KEM, and HKEM.
Table 1: Absolute bias (%) and CoV (%) estimation over the 45 frames.
Mean bias
Max. bias
Min. bias
Mean CoV
Max. CoV
Min. CoV
OSEM 6.3 20.8 0.1 52.0 75.6 31.5
OSEM+G 23.32 39.2 4.4 16.2 34.9 10.1
KEM 12.8 30.2 7.7 19.3 30.4 10.9
[image:6.600.137.466.73.279.2] [image:6.600.55.291.329.466.2] [image:6.600.51.290.561.630.2]OSEM
A
bs
olut
e bi
as
OSEM + G KEM HKEM
3
0 (a)
OSEM
SD
OSEM + G KEM HKEM
2
0 (b)
Figure6: Voxel-wise image analysis over the ten noise realisations using the peak frame. The top row shows the average absolute bias, and the bottom row shows the SD over the ten noise realisations.
1.5
0 HKEM
KEM
OSEM OSEM + G
0 50 100
Time (s)
150 200
1.5
M
ea
n (a.u
.) 1.0
0.5
0.0
500 1000 1500
Time (s) 2000
0.6
M
ea
n (a.u
.) 0.4
0.1 0.0 0.5
0.3 0.2
KEM
HKEM OSEM
OSEM + G KEM
HKEM OSEM
OSEM + G
frame; however, the repeatability of the measure is around 3 times worse. When Gaussian filter is applied, the value is extremely biased with similar CoV to HKEM and KEM.
The same analysis was applied to two real PET/MR rabbit datasets acquired with the Biograph mMR scanner, using [18F]-NaF or [18F]-FDG radiotracers. Figure 7 shows con-sistent results for the IDIF plots. The reconstructed images using the real data show regions of high uptake only in some places of the aorta, thereby demonstrating the benefit in contrast and resolution of exploiting a hybrid PET/MR kernel matrix. Figure 8 presents the line profiles obtained with the different methods, showing the good resolution of the aorta when using the HKEM method and the poor quality of the postfiltered OSEM which is highly affected by the PVE. In Figure 9, the fused PET/MR image is illustrated for each technique, confirming the better alignment of the aorta region between the PET and the MR images and the resulting higher PET image resolution and aortic contrast. Moreover, the comparison between the [18F]-FDG and [18F]-NaF PET/MR studies allowed to assess the feasibility and performance of HKEM in estimating the aorta IDIF for
two of the most commonly employed radiotracers in on-cology and cardiology. From the results in Figure 10, the benefit of the synergistic PET/MR information encoded in the kernel matrix is visible especially in the IDIF plot. These results are also supported by the line profiles in Figure 11 showing a clear definition of the aorta for the proposed method and minimum spill-out of activity from the aorta. It is worth noticing that, for the real data, there are two peaks in the early frames IDIF; this is probably due to the fact that the injection was not continuous during the scan but there was a sudden stop making the uptake rate drop down in that specific time frame. We could show the IDIF with one peak by summing the frame associated with the first peak and the frame having low uptake; however, we think it is interesting to show the effect of a noncontinuous injection on the IDIF estimation. The input function represents a very crucial data component when estimating kinetic parameters, and its accurate estimation can become extremely challenging for small animal imaging due to the very small sizes of the associated aortic vessels. In this study, we proposed the use of PET/MR synergistic information for the more accurate
40 50 60
Distance (mm)
LP1 Peak frame (30–36s) LP2
LP1
LP2
70 80 40 50 60
Distance (mm)70 80
1.0
0.5
Vo
xe
l val
ue (a.u
.)
0.0
1.0
0.5
0.0 2.0
1.5
OSEM OSEM + G KEM
HKEM OSEM
OSEM + G KEM
HKEM
Figure8: Comparison between the line profiles, LP1 and LP2, for the [18F]-NaF study, after reconstructing with HKEM, KEM, OSEM, and OSEM+G methods.
OSEM
(a)
OSEM + G
(b)
KEM
(c)
HKEM
(d)
and precise extraction of the aortic ROI and IDIF estimation in the framework of the HKEM method. We demonstrated that, despite the small size of the rabbit aorta, it is feasible and promising to employ the HKEM method for the ex-traction of an aorta IDIF estimate of improved accuracy and reduced PVE even when using a clinical PET/MR scanner. In addition, the method described to extract the ROI is easy to use and implement as it only involves trivial mathematics
LP1 LP2
3
2
1
0
3 4
2
1
0
Vo
xe
l val
ue (a.u
.)
20 30 40 50
Distance (mm) 20 Distance (mm)30 40 50
HKEM
KEM OSEMOSEM + G HKEMKEM OSEMOSEM + G
Peak frame (30–36s)
Figure11: Comparison between the line profiles, LP1 and LP2, after reconstructing with OSEM, OSEM+G, KEM, and HKEM methods for the [18F]-FDG rabbit data.
Table 2: Bias (%) and CoV (%) estimation over the 10 noise realisations at the peak frame.
Bias Mean CoV
OSEM 19.3 15.4
OSEM+G 40.4 3.5
KEM 20.2 4.3
HKEM 19.3 4.6
4.2
0
0.6
0.4
0.2
0.0
500 1000 1500
Time (s) 2000
KEM
HKEM OSEM
OSEM + G KEM
HKEM OSEM
OSEM + G
M
ea
n (a.u
.)
4
3
M
ea
n (a.u
.)
2
1
0
0 50 100
Time (s) 150 200
OSEM OSEM + G KEM HKEM
between matrices. It is worth mentioning that, although this study was performed with PET/MR data, it could also work with PET-CT data especially if the CT image to use as an-atomical information is a CT angiography image.
5. Conclusion
In this investigation, we demonstrated that the HKEM method allows the more accurate extraction of the aortic ROI for improved IDIF estimation even when using a hu-man hybrid scanner, compared to conventional OSEM or anatomically guided KEM reconstruction. Our findings were validated with both 10 simulated [18F]-NaF PET/MR datasets as well as 2 real rabbit PET/MR studies. Further, the methodology can be applied to most of the available radiotracers and with PET-CT without any major modifi-cation. This technique can enhance the use of dynamic PET in the context of imaging biomarkers with direct pharma-cokinetic information.
Data Availability
A demonstrative code for the creation of the simulated study, reconstruction, and ROI extraction is available in CODE OCEAN at https://doi.org/10.24433/CO.bde84e0c-4c73-47fa-8ba5-81fb8bd2af77. The real rabbit data used to support the findings of this study, however, have not been made available because the Translational and Molecular Imaging Institute Group, who provided the data, retains the right to publish the data before making them generally available.
Conflicts of Interest
The authors declare that there are no conflicts of interest regarding the publication of this paper.
Acknowledgments
This work was undertaken on MARC1, part of the High Performance Computing and Leeds Institute for Data An-alytics (LIDA) facilities at the University of Leeds, UK. The authors thank the Collaborative Computational Project in PET-MR Imaging (CCP-PET-MR), funded with EP/ M022587/1 grant, for enabling PET-MR reconstruction and for funding Daniel Deidda’s participation in an ex-change programme at the University College of London (UCL). Part of this research was funded by the EPSRC Collaborative Computational Flagship Project (EP/P022200/ 1). This work was supported by the University Research Scholarship, University of Leeds, and the research grant NIH/NHLBI R01HL071021. Dr. Tsoumpas was sponsored by a Royal Society Industry Fellowship (IF170011).
References
[1] W. Raynor, S. Houshmand, S. Gholami et al., “Evolving role of molecular imaging with 18f-sodium fluoride PET as a bio-marker for calcium metabolism,” Current Osteoporosis Re-ports, vol. 14, no. 4, pp. 115–125, 2016.
[2] Y. Li, G. R. Berenji, W. F. Shaba, B. Tafti, E. Yevdayev, and S. Dadparvar, “Association of vascular fluoride uptake with vascular calcification and coronary artery disease,” Nuclear Medicine Communications, vol. 33, no. 1, pp. 14–20, 2012. [3] Y. Wang, A. J. Yee, C. Sirard, S. Landau, N. Raje, and
U. Mahmood, “Sodium fluoride PET imaging as a quantitative pharmacodynamic biomarker for bone homeostasis during anti-DKK1 therapy for multiple myeloma,” Blood Cancer Journal, vol. 7, no. 10, p. e615, 2017.
[4] G. J. R. Cook, G. M. Blake, P. K. Marsden, B. Cronin, and I. Fogelman, “Quantification of skeletal kinetic indices in paget’s disease using Dynamic18F-fluoride positron emission tomography,”Journal of Bone and Mineral Research, vol. 17, no. 5, pp. 854–859, 2002.
[5] M. L. Frost, A. E. Moore, M. Siddique et al., “18f-fluoride PET as a noninvasive imaging biomarker for determining treat-ment efficacy of bone active agents at the hip: a prospective, randomized, controlled clinical study,”Journal of Bone and Mineral Research, vol. 28, no. 6, pp. 1337–1347, 2013. [6] U. Simoncic, S. Perlman, G. Liu, M. J. Staab, J. E. Straus, and
R. Jeraj, “Comparison of NaF and FDG PET/CT for assess-ment of treatassess-ment response in castration-resistant prostate cancers with osseous metastases,” Clinical Genitourinary Cancer, vol. 13, no. 1, pp. e7–e17, 2015.
[7] C. Wu, F. Li, G. Niu, and X. Chen, “PET imaging of in-flammation biomarkers,” Theranostics, vol. 3, no. 7, pp. 448–466, 2013.
[8] J. P. O’connor, E. O. Aboagye, J. E. Adams et al., “Imaging biomarker roadmap for cancer studies,” Nature Reviews Clinical Oncology, vol. 14, no. 3, p. 169, 2017.
[9] A. R. Seyal, K. Parekh, Y. S. Velichko, R. Salem, and V. Yaghmai, “Tumor growth kinetics versus RECIST to assess response to locoregional therapy in breast cancer liver me-tastases,” Academic Radiology, vol. 21, no. 8, pp. 950–957, 2014.
[10] A. R. Seyal, K. Parekh, A. Arslanoglu et al., “Performance of tumor growth kinetics as an imaging biomarker for response assessment in colorectal liver metastases: correlation with FDG PET,”Abdominal Imaging, vol. 40, no. 8, pp. 3043–3051, 2015.
[11] M. Alenezi, M. Bentourkia, F. A. A. Slimani, and A. Khalil, “Segmentation and kinetic modeling of human arteries in PET/CT imaging,” in Proceedings of 2016 IEEE NSS/MIC/ RTSD, pp. 1–3, Sydney, Australia, November 2016. [12] L. Jødal, S. B. Jensen, O. L. Nielsen et al., “Kinetic modelling of
infection tracers [18F] FDG,[68Ga] ga-citrate,[11C]
methio-nine, and [11C] donepezil in a porcine osteomyelitis model,”
Contrast Media and Molecular Imaging, vol. 2017, pp. 2017–18.
[13] F. A. Kotasidis, C. Tsoumpas, and A. Rahmim, “Advanced kinetic modelling strategies: towards adoption in clinical PET imaging,”Clinical and Translational Imaging, vol. 2, no. 3, pp. 219–237, 2014.
[14] M. H. Bentourkia, “Determination of the input function at the entry of the tissue of interest and its impact on PET kinetic modeling parameters,” Molecular Imaging and Biology, vol. 17, no. 6, pp. 748–756, 2015.
[15] E. K. Fung and R. E. Carson, “Cerebral blood flow with [15O] water PET studies using an image-derived input function and MR-defined carotid centerlines,” Physics in Medicine and Biology, vol. 58, no. 6, pp. 1903–1923, 2013.
Cerebral Blood Flow and Metabolism, vol. 31, no. 10, pp. 1986–1998, 2011.
[17] R. Boellaard, N. C. Krak, O. S. Hoekstra, and A. A. Lammertsma, “Effects of noise, image resolution, and ROI definition on the accuracy of standard uptake values: a simulation study,”Journal of Nuclear Medicine, vol. 45, no. 9, pp. 1519–1527, 2004.
[18] M. Sattarivand, C. Caldwell, I. Poon, H. Soliman, and K. Mah, “Effects of ROI placement on PET-based assessment of tumor response to therapy,” International Journal of Molecular Imaging, vol. 2013, Article ID 132804, 9 pages, 2013. [19] H. M. Hudson and R. S. Larkin, “Accelerated image
re-construction using ordered subsets of projection data,”IEEE Transactions on Medical Imaging, vol. 13, no. 4, pp. 601–609, 1994.
[20] R. Boellaard, A. Van Lingen, and A. A. Lammertsma, “Ex-perimental and clinical evaluation of iterative reconstruction (OSEM) in dynamic PET: quantitative characteristics and effects on kinetic modeling,” Journal of Nuclear Medicine, vol. 42, no. 5, pp. 808–817, 2001.
[21] C. Tsoumpas, D. Visvikis, and G. Loudos, “Innovations in small-animal PET/MR imaging instrumentation,”PET clinics, vol. 11, no. 2, pp. 105–118, 2016.
[22] G. Germano, B. C. Chen, S.-C. Huang, S. S. Gambhir, E. J. Hoffman, and M. E. Phelps, “Use of the abdominal aorta for arterial input function determination in hepatic and renal PET studies,” Journal of Nuclear Medicine, vol. 33, no. 4, pp. 613–620, 1992.
[23] R. Laforest, T. L. Sharp, J. A. Engelbach et al., “Measurement of input functions in rodents: challenges and solutions,”
Nuclear Medicine and Biology, vol. 32, no. 7, pp. 679–685, 2005.
[24] K.-P. Lin, S.-C. Huang, Y. Choi, R. C. Brunken, H. R. Schelbert, and M. E. Phelps, “Correction of spillover radioactivities for estimation of the blood time-activity curve from the imaged LV chamber in cardiac dynamic FDG PET studies,” Physics in Medicine and Biology, vol. 40, no. 4, pp. 629–642, 1999.
[25] J.-E. Litton, “Technical note. Input function in PET brain studies using MR-defined arteries,” Journal of Computer Assisted Tomography, vol. 21, no. 6, pp. 907–909, 1997. [26] P. Zanotti-Fregonara, J.-S. Liow, M. Fujita et al.,
“Image-derived input function for human brain using high resolution PET imaging with [11C](R)-rolipram and [11C] PBR28,”PLoS One, vol. 6, no. 2, Article ID e17056, 2011.
[27] D. Deidda, , N. Karakatsanis, N. Karakatsanis et al., “Effect of PET-MR inconsistency in the kernel image reconstruction method,”IEEE Transactions on Radiation and Plasma Medical Sciences, pp. 1–13, 2018.
[28] “Hybrid PET-MR list-mode kernelized expectation maximi-zation reconstruction for quantitative PET images of the carotid arteries,” inProceedings of 2017 NSS/MIC,Atlanta, GA, USA, September 2017.
[29] T. Hoffman, B. Scholkopf, and A. Smola, “Kernel methods in machine learning,”Annals of Statistics, vol. 36, pp. 1171–1220, 2008.
[30] G. Wang and J. Qi, “PET image reconstruction using kernel method,” IEEE Transactions on Medical Imaging, vol. 34, pp. 61–71, 2015.
[31] W. Hutchcroft, G. Wang, and J. Qi, “Anatomical-image aided PET reconstruction by the kernel method,”Journal of Nuclear Medicine, vol. 55, no. 1, 2014.
[32] W. Hutchcroft, G. Wang, K. T. Chen, C. Catana, and J. Qi, “Anatomically-aided PET reconstruction using the kernel
method,” Physics in Medicine and Biology, vol. 61, no. 18, pp. 6668–6683, 2016.
[33] P. Novosad and A. J. Reader, “MR-guided dynamic PET reconstruction with the kernel method and spectral temporal basis functions,” Physics in Medicine and Biology, vol. 61, no. 12, pp. 4624–4644, 2016.
[34] S. Ellis and A. Reader, “Kernelised EM image reconstruction for dual-dataset PET studies,”in Proceedings of NSS/MIC, pp. 1–3, Strasburg, France, October 2016.
[35] K. Gong, J. Cheng-Liao, G. Wang, K. T. Chen, C. Catana, and J. Qi, “Direct patlak reconstruction from dynamic PET data using the kernel method with MRI information based on structural similarity,”IEEE Transactions on Medical Imaging, vol. 37, no. 4, pp. 955–965, 2018.
[36] J. Bland, A. Mehranian, M. A. Belzunce et al., “MR-guided kernel em reconstruction for reduced dose PET imaging,”
IEEE Transactions on Radiation and Plasma Medical Sciences, vol. 2, no. 3, pp. 235–243, 2017.
[37] B. Spencer and G. Wang, “Statistical image reconstruction for shortened dynamic PET using a dual kernel method,” in
Proceedings of NSS/MICAtlanta, GA, USA, September 2017. [38] A. Mehranian, M. A. Belzunce, C. J. McGinnity et al.,
“Multi-modal synergistic pet and mr reconstruction using mutually weighted quadratic priors,”Magnetic Resonance in Medicine, 2018, in press.
[39] J. Bland, M. Belzunce, S. Ellis, C. McGinnity, A. Hammers, and A. Reader, “Spatially-compact MR-Guided kernel EM for PET image reconstruction,”IEEE Transactions on Radiation and Plasma Medical Sciences, vol. 2, no. 5, pp. 470–482, 2018. [40] K. Thielemans, C. Tsoumpas, S. Mustafovic et al., “STIR: software for tomographic image reconstruction release 2,”
Physics in Medicine and Biology, vol. 57, no. 4, pp. 867–883, 2012.
[41] C. Calcagno, E. Vucic, V. Mani, G. Goldschlager, and Z. A. Fayad, “Reproducibility of black blood dynamic contrast-enhanced magnetic resonance imaging in aortic plaques of atherosclerotic rabbits,”Journal of Magnetic Res-onance Imaging, vol. 32, no. 1, pp. 191–198, 2010.
[42] N. A. Karakatsanis, R. Abgral, G. Boeykens et al., “18F-FDG: 18F-NaF PET/MR multi-parametric imaging with kinetics-based bone segmentation for enhanced dual-tracer PET quantification,” in Proceedings of IEEE NSS/MIC/RTSD, pp. 1–5, 2016.
[43] A. Salavati, S. Houshmand, T. Werner, and A. Alavi, “Impact of methodological factors on assessment of atherosclerotic plaques using 18F-FDG and 18F-NaF PET/CT,” Journal of
Nuclear Medicine, vol. 55, no. 1, p. 1321, 2014.
[44] X. Li, D. Heber, W. Wadsak, M. Mitterhauser, and M. Hacker, “Combined 18F-FDG PET/CT and 18F-NaF PET/CT imaging in assessing vascular inflammation and osteogenesis in cal-cified atherosclerotic lesions,”Journal of Nuclear Medicine, vol. 57, no. 2, p. 68, 2016.
[45] N. Karakatsanis, M. Trivieri, M. Dweck et al., “Simultaneous assessment of carotid plaque inflammation and micro-calcification with dual-tracer 18F-FDG: 18F-NaF PET-MR imaging: a clinical feasibility study,” Journal of Nuclear Medicine, vol. 58, no. 1, p. 446, 2017.
[46] C. C. Watson, D. Newport, and M. E. Casey,A Single Scatter Simulation Technique for Scatter Correction in 3D PET, Springer, Berlin, Germany, 1996.
[48] I. Polycarpou, K. Thielemans, R. Manjeshwar, P. Aguiar, P. K. Marsden, and C. Tsoumpas, “Comparative evaluation of scatter correction in 3D PET using different scatter-level approximations,” Annals of Nuclear Medicine, vol. 25, no. 9, pp. 643–649, 2011.
[49] M. W. Jacobson and K. Thielemans, “Optimizability of loglikelihoods for the estimation of detector efficiencies and singles rates in PET,” inProceedings of IEEE NSS/MIC/RTSD, pp. 4580–4586, Dresden, Germany, October 2008.
[50] D. Hogg, K. Thielemans, T. Spinks, and N. Spyrou, “Maximum-likelihood estimation of normalisation factors for PET,” inProceedings of IEEE NSS/MIC, pp. 2065–2069, San Diego, CA, October 2001.
Stem Cells
International
Hindawi
www.hindawi.com Volume 2018
Hindawi
www.hindawi.com Volume 2018
INFLAMMATION
Endocrinology
International Journal of Hindawiwww.hindawi.com Volume 2018
Hindawi
www.hindawi.com Volume 2018
Disease Markers
Hindawi
www.hindawi.com Volume 2018 BioMed
Research International
Oncology
Journal ofHindawi
www.hindawi.com Volume 2013
Hindawi
www.hindawi.com Volume 2018
Oxidative Medicine and Cellular Longevity
Hindawi
www.hindawi.com Volume 2018
PPAR Research
Hindawi Publishing Corporation
http://www.hindawi.com Volume 2013
Hindawi www.hindawi.com
The Scientific
World Journal
Volume 2018
Immunology Research Hindawi
www.hindawi.com Volume 2018
Journal of
Obesity
Journal ofHindawi
www.hindawi.com Volume 2018
Hindawi
www.hindawi.com Volume 2018
Computational and Mathematical Methods in Medicine
Hindawi
www.hindawi.com Volume 2018
Behavioural
Neurology
Ophthalmology
Journal of Hindawiwww.hindawi.com Volume 2018
Diabetes Research
Journal ofHindawi
www.hindawi.com Volume 2018
Hindawi
www.hindawi.com Volume 2018
Research and Treatment
AIDS
Hindawiwww.hindawi.com Volume 2018 Gastroenterology Research and Practice
Hindawi
www.hindawi.com Volume 2018
Parkinson’s
Disease
Evidence-Based Complementary and Alternative Medicine Volume 2018 Hindawi
www.hindawi.com