Int. J. Electrochem. Sci., 12 (2017) 9958 – 9971, doi: 10.20964/2017.11.39
International Journal of
ELECTROCHEMICAL
SCIENCE
www.electrochemsci.org
Electrochemical Determination of Amsacrine at a ds-DNA
Modified Graphene Carbon Paste Electrode and its Application
as a Label-free Electrochemical Biosensor
Hadi Mahmoudi Moghaddam1* , Hadi Beitollahi2,Gholamreza Dehghannoudeh1,3*and Hamid Forootanfar1,4
1
Pharmaceutics Research Center, Institute of Neuropharmacology, Kerman University of Medical Sciences, Kerman, Iran
2
Environment Department, Institute of Science and High Technology and Environmental Sciences, Graduate University of Advanced Technology, Kerman, Iran
3
Department of Pharmaceutics, School of Pharmacy, Kerman University of Medical Sciences, Kerman, Iran
4
Department of Pharmaceutical Biotechnology, Faculty of Pharmacy, Kerman University of Medical Sciences, Kerman, Iran
*
E-mail: [email protected], [email protected], [email protected]
Received: 11 February 2017 / Accepted: 4 september 2017 / Published: 12 October 2017
The interaction between amsacrine and double stranded deoxyribonucleic acid (ds-DNA) was studied by a graphene paste electrode (GPE) and incubation solution using differential pulse voltammetry (DPV). A simple and sensitive biosensor was made using the mentioned interaction for determining amsacrine. DPV shows a linear dynamic range from 7.0 × 10⁻⁷ to1.0 × 10−4 M for amsacrine. The use of this screening method for analyzing real sample was studied with applying the proposed method to determine amsacrine in urine and blood serum. Generally, the findings indicated a DNA sensor with the ability to analyze the amsacrine in real samples effectively.
Keywords: Amsacrine; ds-DNA; Graphene; Carbon paste electrode
1. INTRODUCTION
DNA has a key role in the process of life as heritage data are carried with it and it is responsible for replicating and transcribing genetic data in living cells. DNA is an important target for smaller molecules such as medicines, metals, and carcinogens [1].
Various kind of the mechanisms of binding include intercalation, groove binding, covalent binding/cross linking, DNA cleaving, and nucleoside-analog incorporation. The structural variations of both the DNA and the medicine molecules for accommodating the formation of complex are caused by these binding interactions [4, 5].
The interaction between several anticancer medicines with DNA has been investigated using different methods such as fluorescence [6, 7], UV [8], luminescence [9], circular dichroism spectroscopy [8], electrophoresis [10], NMR [11], IR [12], and molecular modeling techniques [13]. Although, these approaches are time-consuming and expensive and need more materials, moreover, several of them have low sensitivity [14].
Recently, the electrochemical investigation of interaction between anticancer drugs and DNA has been increased [15-22]. Among these methods, DNA electrochemical biosensors are one of the main groups. Electrochemical DNA biosensors include a nucleic acid recognition layer immobilized over an electrochemical transducer. The signal transducer must measure the variation happened at the recognition layer because of the binding molecules, converting this into an electronic signal which then can be displayed to the operator [23-25]. These biosensors are beneficial tools to demonstrate interactions between nucleic acid and cell membranes, to detect possible environmental carcinogenic chemicals and to clarify the mechanisms of interaction of chemotherapeutic agents. Therefore, they possibly suggest quick and cheap alternative to traditional approaches of determining interactions between analyte and DNA [26].
Amongst the electrochemical transducers, carbon-based electrodes including pencil lead electrode, glassy carbon electrode (GCE), carbon paste electrodes, carbon composite electrodes, carbon nanoparticle-modified electrodes or chemically modified carbon electrodes, show some unique features [27-36].
Carbon paste electrodes (CPEs) are extensively applied for electrochemical determinations of a various species relating to their low residual current and noise, simplicity of construction, broad potential window, rapid surface renewal, and low cost [37-50].
Therefore, much attention has been done to prepare the electrochemical biosensors with great selectivity and sensitivity with modified carbon paste for analysis of medicines, biological compounds in biological and pharmaceutical samples [51-59].
Among carbon material, a new promising group is graphene, which has been interested greatly. It shows excellent electrical conductivity and optical features and it is lightweight with a great specific surface area and chemical stability. Moreover, graphene offers the benefits of more cost effective and lower concentrations of metallic pollution comparing to carbon nanotubes (CNTs) [60-62].
Amsacrine (N-{4-[(acridin-9-yl)amino]-3-methoxyphenyl}methanesulfonamide, m-AMSA), which is traditionally known as the first medicine with the function as a topoisomerase II poison, is a well-known anticancer agent with a good activity against refractory acute leukemias as well as Hodgkin’s and non-Hodgkin’s lymphomas [63].
In previous studies, limited approaches have been reported to determine m-AMSA in bulk solutions with HPLC and GC [64, 65].
knowledge, no research has been reported on electrochemical DNA biosensors for m-AMSA determination until now.
2. EXPERIMENTAL
2.1. Apparatus and chemicals
To acquire the data and a potential control, all the voltammetric experiments (cyclic voltammetry or differential pulse voltammetry) were conducted by a personal computer interfaced to a Metrohm model 797 VA Computrace, (Herisau, Switzerland). A three-electrode system consisted of a platinum wire, Ag/AgCl/KCl (saturated), and graphene paste electrode (GPE) was used as the auxiliary, reference, and working electrodes, respectively. All the pH measurements were carried out using a Metrohm 827 pH meter (Herisau, Switzerland) supplied with a combination glass-reference electrode.
Amsacrine hydrochloride and salmon sperm double-stranded DNA (ds-DNA) and graphene were purchased from Sigma (St. Louis, USA). Amsacrine stock solution (1 mM) was prepared with ultrapure water and kept in a refrigerator. 1.0 mg/mL of the DNA stock solution was prepared in Tris– HCl (TE) buffer (pH 7.4) and kept frozen. Finally, the buffer solutions were prepared from orthophosphoric acid and its salts in the pH range of 2.0–9.0. Extra pure graphite powders were purchased from Merck (Darmstadt, Germany). All other reagents were of analytical grades and purchased from Sigma.
2.2 Real Sample Preparation
Immediately after collection, the urine samples of healthy people were stored in a refrigerator. 10 mL of the samples was centrifuged at 2000 rpm for 15 min. Then, using a 0.45µm filter, the supernatant was filtered out. Afterwards, a different volume of the solution was diluted to the mark with 0.05 M phosphate buffer (pH 7.0) followed by its transfer into a 25 mL volumetric flask. Different amounts of amsacrine were spiked to the diluted urine sample.
The serum samples of healthy people were obtained from a local laboratory. After centrifugation and filtering, it was diluted with 0.05 M phosphate buffer (pH 7.0) with no further treatment. Different amounts of amsacrine were spiked to the diluted serum samples.
2.3 GPE Preparation
Before use, the surface of the electrode was rubbed and gently smoothed on a piece of filter paper. When it was necessary, a bit of the paste was pushed out of the tube to prepare a new surface. Without adding graphene, a bare electrode was prepared in a similar way.
2.4 ds-DNA Immobilization on the GPE Surface
By applying 10 mL of 0.50 M acetate buffer solution (pH 4.8) containing 10 mg/L of the ds-DNA at a potential of 0.50 V, the ds-DNA was immobilized on the GPE by stirring it for 250 s as described in the literature [57]. The obtained electrode rinsed with acetate buffer solution was named as ds-DNA-GPE.
2.5 K4 [Fe (CN)6] Electrochemical Behavior at the Surfaces of Different Electrodes
The cyclic voltammogram of 2.5 mM K4Fe(CN)6 in 0.01 M PBS and 0.50 M KNO3 was
recorded from -195 to 620 mV using a scan rate of 50 mV/s.
2.6 Adsorptive Stripping Differential Pulse Voltammetry at ds-DNA-GPE
Different concentrations of amsacrine mixed with 10 mL of 0.05 M phosphate buffer at pH 7.0 were applied to dip the ds-DNA-GPE. At different times, the solution was stirred in an open circuit system for accumulation. Then, the electrode was placed in 10 mL phosphate buffer (0.30 M, pH 7.5) after being rinsed with distilled water. Using a differential pulse mode, the potential ranging from +150 to +400 mV was scanned towards the positive direction and the subsequent voltammograms were recorded.
3. RESULTS AND DISCUSSION
3.1 Cyclic Voltammetric Study on DNA Immobilization onto GPE
To study DNA immobilization on the GPE surface, cyclic voltammetry (CV) of Fe(CN)6
4-/Fe(CN)63- redox couple was used as an indicator whose function depended the negatively charged
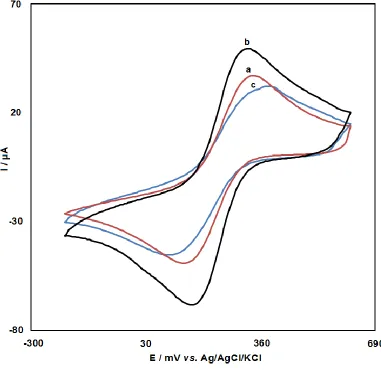
DNA phosphate backbone and the electrostatic repulsion of the redox couple [61]. The typical cyclic voltammograms of the immobilization process are shown in Figure 1. The characteristics of voltammogram of K4[Fe(CN)6] at the bare CPE included a pair of well-defined peaks with a cathodic
peak potential (Epc) of 136 mV and an anodic peak potential (Epa) of 332 mV as well as the
peak-to-peak potential separation (ΔEp) of 196 mV as shown in curve a in Figure 1. Using GPE, both peaks
demonstrated a rise in the currents. Additionally, in the presence of graphene, ΔEp reduced to 167 mV,
Figure 1. Cyclic voltammograms of (a) bare CPE, (b) GPE and (c) ds-DNA-GPE in 0.01M PBS containing 0.50 M KNO3 and 2.5 mM K4Fe(CN)6. Conditions: potential range - 195 to 620 mV
at a scan rate of 50 mV/s.
A rise of 309 mV in the ΔEp was seen after the ds-DNA immobilization on the GPE surface,
which indicated a reduction in the electrochemical reversibility of the Fe(CN)64-/Fe (CN)63- redox
couple at the electrode coated with DNA (Curve c in Figure 1). Simultaneously, both the peak anodic and cathodic currents declined. This reduction can be explained as follows:
Due to electrostatic repulsion, Fe(CN)64- /Fe(CN)63- redox couple access to the electrode
surface is resisted by the phosphate groups negatively charged on ds-DNA after ds-DNA immobilization on the GPE [63]. As a result, the ds-DNA immobilization on the surfaces of the electrodes can be detected by the difference between the CV profiles of the electrodes.
3.2 Amsacrine Interaction with ds-DNA in the Solution
[image:5.596.109.490.71.442.2]
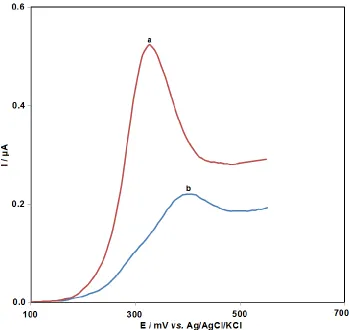
min. One of the following two factors is responsible for such results: (i) blocking of the electron transfer between amsacrine and electrode surface by the non-conducting DNA; (ii) electrochemical inactivity of the formed DNA– amsacrine complex. In the former case, the current relative to that of the clean electrode must have reduced, while no peak shift was expected.
Figure 2. Differential pulse voltammograms of 2.0×10⁻⁵ M amsacrine at GPE in 0.05 M phosphate buffer of pH 7.0 in the absence of the ds-DNA (a) and in the presence of 20 mg/mL of the ds-DNA (b). Incubation time, 5 min.
[image:6.596.124.473.154.484.2]
3.3 Amsacrine Electrochemical Behavior at ds-DNA-GPE Surface
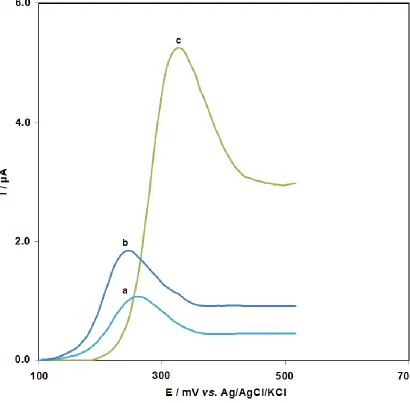
[image:7.596.93.503.192.595.2]Fig. 3 shows DPVs obtained after accumulation of amsacrine at bare CPE (curve a), GPE (curve b) and ds-DNA-GPE (curve c) from a stirring 5.0×10⁻⁵ M amsacrine in 0.05 M phosphate buffer (pH 7. 0) for 5 min at open circuit condition, followed by washing the electrode with distilled water and transferring it in to blank 0.30 M phosphate buffer (pH 7.5) as the supporting electrolyte.
Figure 3. DP voltammograms obtained after accumulation of amsacrine at bare CPE (a), GPE (b) and ds-DNA-GPE (c). Conditions: amsacrine concentration 5.0 ×10⁻⁵ M, accumulation medium 0.05 M phosphate buffer pH 7.0, accumulation time 5 min, stripping medium 0.30 M phosphate buffer pH 7.50.
Relative to bare CPE and GPE, a positive shift at the ds-DNA-coated electrode was represented by Epa as can be seen from Fig. 3. Additionally, amsacrine interaction with the DNA layer immobilized
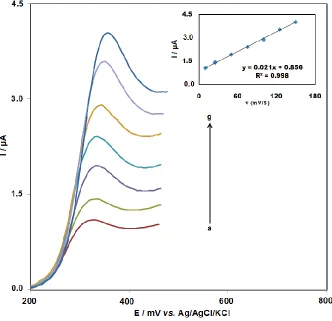
Figure 4. Linear sweep voltammograms of 1.5×10⁻⁵ M amsacrine at ds-DNA- GPE employing varying scan rates (a-g): 10, 25, 50, 75, 100, 125 and 150 mV/s, respectively. Inset: Linear relationship between scan rates and peak currents in the linear sweep voltammograms. Conditions were the same as Figure 3
Amsacrine linear sweep voltammetry of 1.5×10⁻⁵ M was performed at different scan rates (ν) (Fig. 4). Amsacrine molecule oxidation associated with the immobilized DNA was represented by the obtainment of a linear plot of Ipa versus ν (Fig. 4. inset) within the range of 10–150 mV/s at the
ds-DNA-coated GPE. Furthermore, as expected for an irreversible electrode process, a positive change in Epa was observed to be caused by the increasing scan rate [65].
3.4 Optimization of Experimental and Operational Parameters
To use the ds-DNA-GPE for amsacrine determination in real samples, the main experimental parameters affecting the biosensor response were optimized.
3.4.1 Immobilization Time
Using DPV, it was investigated how ds-DNA immobilization time affected Ipa of the
[image:8.596.134.466.93.414.2]
DNA amount enhanced and began to saturate at nearly 250 s. Accordingly, further research was conducted to study the immobilization time of 250 s.
3.4.2 Accumulation pH
pH impact on amsacrine accumulation on the electrode surface, on which the ds-DNA immobilization and amsacrine had an interaction, was investigated within a range of 2.0–10.0. Based on the results, amsacrine anodic signal begins to decline when pH enhances to more than 7.0, while the optimal pH value is around 7.0. Amsacrine changes into a negatively charged form at higher pHs. Amsacrine oxidation signal decrease is resulted from amsacrine reduced concentration near the electrode surface caused by the electrostatic repulsion between the amsacrine and DNA negative charges. Accumulation pH was adjusted to the optimal value of 7.0 in the subsequent experiments.
3.4.3 Accumulation Time Effect
The accumulation time determines amsacrine interaction with the ds-DNA. The dependence of Ipa of amsacrine on the accumulation time was investigated in an phosphate buffer of pH 7.0 at a
ds-DNA-GPE. An increase was observed for the first 5 min of the accumulation time while a leveling-off occurred at longer times. Thus, only 5 min of accumulation was considered for all the experiments.
3.4.4 Stripping pH
Ipa was greatly affected by the solution pH value since proton took part in amsacrine oxidation.
Accordingly, evaluation of the stripping pH effect on the biosensor response was done in phosphate buffer 0.3 M with pH values of 2.0 to 10.0.
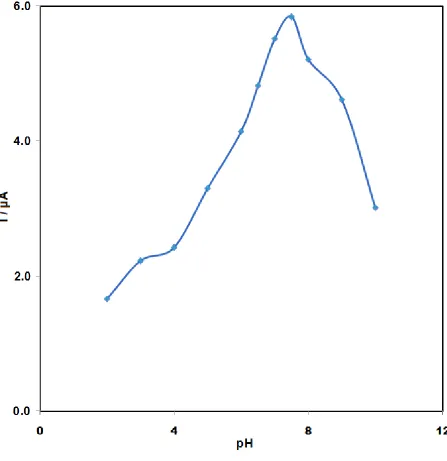
As shown in Fig. 5, at the buffer solution pH of 7.5, maximum Ipa was observed in the results.
Therefore, the stripping was performed in 0.30 M phosphate buffer with a pH of 7.5 in the subsequent experiments.
3.4.5 Stripping Medium Concentration
To reach the highest amsacrine oxidation signal, the effect of phosphate buffer concentration (pH 7.5) in the stripping medium was studied. An increased Ipa was obtained by enhancing the buffer
Figure 5. Effect of stripping pH on the DP voltammograms of amsacrine accumulated at ds-DNA- GPE. Conditions: amsacrine concentration 7.0×10⁻⁵ M, other conditions were the same as given in Figure 3, except second phosphate buffer pH.
3.5 Analytical Performance
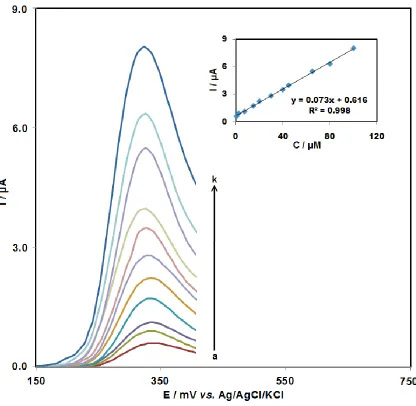
Based on linearity, accuracy, limit of detection (LOD), and limit of quantification (LOQ), the proposed DNA biosensor was validated. The DPV response of ds-DNA-GPE to various amsacrine concentrations, as well as a calibration curve for amsacrine detection with the help of the proposed biosensor under the optimal experimental conditions is shown in Fig. 6.
[image:10.596.52.499.71.532.2]
limit was obtained 3.0×10⁻⁷ M. These values are comparable with other values obtained by other research groups as are shown in Table 1.
[image:11.596.91.507.116.522.2]Figure 6. DP voltammograms obtained at ds-DNA-GPE for amsacrine at different concentrations (a– k) 7.0×10⁻⁷, 2.5×10⁻⁶, 7.5×10⁻⁶, 1.5×10⁻⁵, 2.0×10⁻⁵, 3.0×10⁻⁵, 4.0×10⁻⁵, 4.5×10⁻⁵, 6.5×10⁻⁵, 8.0×10⁻⁵ and 1.0×10⁻⁴ M respectively. Other conditions were the same as given in Figure 3 Table 1. Comparison of the efficiency of some methods used in detection of amsacrine.
Method LOD LDR Ref.
Gas-chromatography 50 ng/ml - 66
High-performance liquid chromatography - 2.0-2000.0 ng/ml 67 High-performance liquid chromatography 50.0 μM 0.1-10.0 μM 68
[image:11.596.59.534.621.763.2]
3.6 Real Sample Analysis
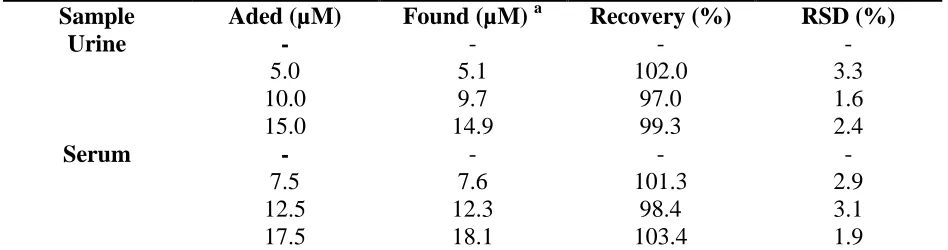
[image:12.596.62.536.177.302.2]The proposed method was applied to amsacrine determination in human blood serum and urine samples, the results of which are presented in table 2.
Table 2. Analytical results of spiked human serum and urine analysis (n=5).
Sample Aded (µM) Found (µM) a Recovery (%) RSD (%)
Urine - - - -
5.0 5.1 102.0 3.3
10.0 9.7 97.0 1.6
15.0 14.9 99.3 2.4
Serum - - - -
7.5 7.6 101.3 2.9
12.5 12.3 98.4 3.1
17.5 18.1 103.4 1.9
Amsacrine was discovered to be associated with the satisfactory recoveries of the experimental findings. The mean Relative Standard Deviation (R.S.D.) could demonstrate the method's reproducibility.
The satisfactory spiked recoveries corroborated the proposed biosensor applicability for amsacrine determination in biological samples.
4. CONCLUSIONS
Based on the interaction between ds-DNA and amsacrine, amsacrine was determined by a simple, fast, reliable, and sensitive DNA biosensor. After optimizing the main experimental parameters, this DNA-coated GPE was fabricated to evaluate its performance analytically. A linear dynamic range of 7.0 × 10⁻⁷ to 1.0 × 10⁻⁴ M was obtained for amsacrine. Ultimately, the proposed biosensor was found to be capable of successfully analyzing human serum and urine samples.
ACKNOWLEDGEMENTS
The Authors acknowledge the financial support provided for this project (grant No. 93/513) by the Kerman University of Medical Sciences, Kerman, Iran.
References
1. R. R. Sinden, DNA Structure and Function, (1994) Academic Press.
2. J. Dickenson, F. Freeman, C. L. Mills, C. Thode, and S. Sivasubramaniam, Molecular Pharmacology: From DNA to Drug Discovery, (2012) Wiley.
3. K. Nakamoto, M. Tsuboi, and G. D. Strahan, Drug-DNA Interactions: Structures and Spectra, (2008) John Wiley & Sons.
4. F. Kuralay, and A. Erdem, Analyst, 140 (2015) 2876.
6. M. Ramana, R. Betkar, A. Nimkar, P. Ranade, B. Mundhe, and S. Pardeshi, J. Photochem. Photobiol. B., 151 (2015) 194.
7. F. Chen, J. Tu, C. Liang, B. Yang, C. Chen, X. Chen, and C. Cai, Microchim. Acta, 183 (2016) 1571.
8. N. A. Panat, B. G. Singh, D. K. Maurya, S. K. Sandur, and S. S. Ghaskadbi, Chem. Biol. Interact., 251 (2016) 34.
9. M. R. Arkin, E. D. A. Stemp, C. Turro, N. J. Turro, and J. K. Barton, J. Am. Chem. Soc., 118 (1996) 2267.
10. I. C. Lopes, S. C. B. Oliveira, and A. M. Oliveira-Brett, Anal. Bioanal. Chem., 405 (2013) 3783. 11. S. M. V. de Almeida, E. A. Lafayette, W. L. Silva, V. de Lima Serafim, T. M. Menezes, J. L.
Neves, A. L. T. G. Ruiz, J. E. de Carvalho, R. O. de Moura, and E. I. C. Beltrao, Int. J. Biol. Macromol., 92 (2016) 467.
12. B. Rafique, A. M. Khalid, K. Akhtar, and A. Jabbar, Biosens. Bioelectron., 44 (2013) 21.
13. M. Anjomshoa, H. Hadadzadeh, M. Torkzadeh-Mahani, S. J. Fatemi, M. Adeli-Sardou, H. A. Rudbari, and V. M. Nardo, Eur. J. Med. Chem., 96 (2015) 66.
14. G. Y. Ciftci, E. Senkuytu, S. E. İncir, F. Yuksel, Z. Olcer, T. Yildirim, A. Kilic, and Y. Uludag, Biosens. Bioelectron., 80 (2016) 331.
15. V. C. Diculescu, and A. M. Oliveira-Brett, Bioelectrochemistry, 107 (2016) 50. 16. S. Tajik, M.A. Taher and H. Beitollahi, J. Electroanal Chem., 720-721 (2014) 134.
17. H. Ilkhani, T. Hughes, J. Li, C. J. Zhong, and M. Hepel, Biosens. Bioelectron., 80 (2016) 257. 18. S. Tajik, M. A. Taher, H. Beitollahi, and M. Torkzadeh-Mahani, Talanta, 134 (2015) 60. 19. Y. Temerk, M. Ibrahim, H. Ibrahim, and M. Kotb, J. Electroanal. Chem., 769 (2016) 62. 20. A.A. Ensafi, E. Heydari-Bafrooei and B. Rezaei, Biosens. Bioelectron., 41 (2013) 627. 21. X. Ma, M. Chen, Y. Wu, X. Li, and S. Zhang, Int. J. Electrochem. Sci., 11 (2016) 8499.
22. S. Kurbanoglu, B. Dogan-Topal, L. Hlavata, J. Labuda, S. A. Ozkan, and B. Uslu, Electrochim. Acta, 169 (2015) 233.
23. M. Chen, C. Hou, D. Huo, M. Yang, and H. Fa, Anal. Methods, 7 (2015) 9466.
24. Z. Zheng, J. Jiang, M. Zheng, C. Zhao, K. Peng, X. Lin, and S. Weng, Int. J. Electrochem. Sci., 11 (2016) 8354.
25. V. C. Diculescu, A.-M. Chiorcea-Paquim, and A. M. Oliveira-Brett, TrAC, Trends Anal. Chem., 79 (2016) 23.
26. Y. Shao, J. Wang, H. Wu, J. Liu, I. A. Aksay, and Y. Lin, Electroanalysis, 22 (2010) 1027.
27. M. Baghayeri, H. Veisi, H. Veisi, B. Maleki, H. Karimi- Maleh and H. Beitollahi, RSC Adv., 4 (2014) 49595
28. T. Alizadeh, R. E. Sabzi, and H. Alizadeh, Talanta, 147 (2016) 90.
29. H. Beitollahi, M.A. Taher, M. Ahmadipour, and R. Hosseinzadeh, Measurement, 47 (2014) 770. 30. S. Azodi-Deilami, E. Asadi, M. Abdouss, F. Ahmadi, A. H. Najafabadi, and S. Farzaneh, Anal.
Methods, 7 (2015) 1280.
31. H. KarimiMaleh, M. Keyvanfard, K. Alizad, M. Fouladgar, H. Beitollahi, A. Mokhtari, and F. Gholami-Orimi, Int. J. Electrochem. Sci., 6 (2011) 6141.
32. H. H. Beitollahi, J.B. Raoof and R. Hosseinzadeh, Anal. Sci. 27(2011) 991.
33. M. Mazloum-Ardakani, B. Ganjipour, H. Beitollahi, M. K. Amini, F. Mirkhalaf, H. Naeimi, M. Nejati-Barzoki, Electrochim. Acta, 56 (2011) 9113.
34. M. Kazemipour, M. Ansari, A. Mohammadi, H. Beitollahi, and R. Ahmadi, J. Anal. Chem., 64 (2009) 6570.
35. R. Sadeghi, H. Karimi-Maleh, A. Bahari, and M. Taghavi, Phys. Chem. Liq., 51 (2013) 704. 36. M.M. Foroughi, H. Beitollahi, S. Tajik, M. Hamzavi, and H. Parvan, Int. J. Electrochem. Sci., 9
(2014) 2955.
38. M. A. Khalilzadeh, H. Karimi-Maleh, A. Amiri, and F. Gholami, Chin. Chem. Lett., 21 (2010) 1467.
39. M. Mazloum-Ardakani, Z. Taleat, A. Khoshroo, H. Beitollahi and H. Dehghani, Biosens. Bioelectron., 35 (2012) 75.
40. M. Arshadi, M. Ghiaci, A. A. Ensafi, H. Karimi-Maleh, and S. L. Suib, J. Mol. Catal. A, 338 (2011) 71.
41. Z. Taleat, M. Mazloum Ardakani, H. Naeimi, H. Beitollahi, M. Nejati and H.R. Zare, Anal. Sci., 24 (2008) 1039.
42. H. Beitollahi, J.B. Raoof, H. Karimi-Maleh and R. Hosseinzadeh, J. Solid State Electrochem., 16(2012) 1701.
43. H. KarimiMaleh, M. Moazampour, H. Ahmar, H. Beitollahi, and A. A. Ensafi, Measurement, 51 (2014) 9199.
44. S. Mohammadi, H. Beitollahi, and A. Mohadesi, Sens. Lett., 11 (2014) 388.
45. H. Beitollahi, M.A. Taher, M. Ahmadipour, and R. Hosseinzadeh, Measurement, 47 (2014) 770. 46. M.R. Akhgar, H. Beitollahi, M. Salari, H. Karimi-Maleh and H. Zamani, Anal. Methods 4 (2012)
259.
47. S. Wu, Q. He, C. Tan, Y. Wang, and H. Zhang, Small, 9 (2013) 1160. 48. H. Beitollahi, and H. Salimi, J. Electrochem. Soc., 163 (2016) H1157. 49. J. Peng, Y. Feng, X. X. Han, and Z. N. Gao, Anal. Methods, 8 (2016) 2526.
50. M. Mazloum-Ardakani, H. Beitollahi, B. Ganjipour and H. Naeimi, Int. J. Electrochem. Sci., 5(2010) 531
51. A. C. Ketron, W. A. Denny, D. E. Graves, and N. Osheroff, Biochemistry, 51 (2012) 1730.
52. H. Karimi-Maleh, A.A. Ensafi, H. Beitollahi, V. Nasiri, M.A. Khalilzadeh, and P. Biparva, Ionics, 18 (2012) 687.
53. M. L. Devi, K. Chandrasekhar, K. Surendranath, B. Rao, and M. Narayana, J. Chromatogr. Sci., 49 (2011) 489.
54. H. Beitollahi, S. Tajik and P.Biparva, Measurement, 56(2014) 170.
55. A. Emonds, O. Driessen, E. Bruijn, and A. Oosterom, Fresenius. J. Anal. Chem., 307 (1981) 286. 56. H. Beitollahi and I. Sheikhshoaie, Int. J. Electrochem. Sci., 7 (2012) 7684.
57. P. Kara, K. Kerman, D. Ozkan, B. Meric, A. Erdem, P. E. Nielsen, and M. Ozsoz, Electroanalysis, 14 (2002) 1685.
58. S. Tajik, M.A. Taher and H. Beitollahi, Electroanalysis, 26(2014) 796.
59. M. Mazloum-Ardakani, H. Beitollahi, M. K. Amini, F. Mirkhalaf, B.B.F. Mirjalili and A.Akbari, Analyst, 136 (2011) 1965.
60. S. Tajik, M.A. Taher and H. Beitollahi, Sens. Actuators B, 197 (2014) 228.
61. S.N. Ding, J.F. Chen, J. Xia, Y.H. Wang, and S. Cosnier, Electrochem. Commun., 34 (2013) 339. 62. H. Beitollahi, and F. Garkani-Nejad, Electroanalysis, 28 (2016) 2237.
63. Y. Lei, F. Yang, L. Tang, K. Chen, and G. J. Zhang, Sensors, 15 (2015) 29882. 64. R. P. Talemi, and M. H. Mashhadizadeh, Talanta, 131 (2015) 460.
65. E. Er, H. Çelikkan, N. Erk, and M. L. Aksu, Electrochim. Acta, 157 (2015) 252.
66. A. Emonds, O. Driessen, E. A. de Bruijn, and A. T. van Oosterom, Fresenius J. Anal. Chem., 307 (1981) 286.
67. P. P. T. Brons, J. M. C. Wessels, P. C. M. Linssen, and C. Haanen, J. Choromatogr. B, 422 (1987) 175.