SB 95/2012 10 October 2012
Young people not in education, employment or training (NEET)
(Year to 30 June 2012)
This Bulletin summarises the available statistics on young people not in education, employment or training (NEET) in Wales. This provides policy makers and those working with young people with data to monitor trends by age and gender and assess the impact of education and labour market interventions on young people, towards the Welsh Government’s strategic approach to reducing the proportion of young people who are NEET as set out in the 2011-2015 Youth Engagement and Employment Action Plan
(currently under revision).
The definitive source for estimates of the proportion of young people who are NEET in Wales is the annual Statistical First Release (SFR), published on 25 July 2012 Participation of young people in education and the labour market. The latest SFR provided final data for 2010 and provisional estimates for 2011, which are also included within this Bulletin.
Additionally, this quarterly Bulletin provides users with more timely, but less statistically robust, statistics between SFRs and includes analysis by gender, age and region, not possible with the annual data. The statistics from the Annual Population Survey are based on relatively small sample sizes of 16-18 year olds and are statistically less robust than those published in the SFR. Care also needs to be taken when comparing estimates from the different sources due to differences in definitions.
The main focus of this Bulletin is the 16-18 year old age group. For completeness equivalent statistics for the 19-24 year old age group are also given in the tables.
The statistics included in this bulletin are taken from the following sources:
• Statistical First Release ‘Participation of young people in education and the labour market’ using education data sources and the Annual Population Survey (APS);
• Annual Population Survey (ONS); and
• Careers Wales Pupil Destinations from Schools in Wales survey. New data are highlighted.
Most recent results from these sources:
• SFR basis - As at end 2011(p), 12.0 per cent of 16-18 year olds were NEET (13,600) compared with 11.1 per cent (12,800) at end 2010;
• APS basis - New data For the year ending Quarter 2 2012, 12.9 per cent of 16-18 year olds were estimated to be NEET, unchanged from the previous year (year ending Q2 2011).
• Pupil Destinations basis - As at Oct 2011, 4.4 per cent of Year 11 leavers were NEET compared with 5.4 per cent in 2010.
Statistician: Rachel Lloyd Tel: 029 2082 3357 E-mail: post16ed.stats@wales.gsi.gov.uk
Next update: January 2013
When to use each source of data
Statistical First Release (SFR) series
The number and proportion of young people who are NEET in Wales is published annually in the Statistical First Release (SFR) Participation of young people in education and the labour market. The SFR series should be used:-
• as the definitive headline measures for young people who are NEET in Wales.
However, these data are only available annually and can only be disaggregated by gender, therefore we need to supplement this series with other data sources.
Annual Population Survey (APS) series
The Annual Population Survey (APS) provides more regular and timely data on young people who are NEET. However, these in-year estimates, based solely on survey data, are much less robust than the annual SFR measure. The APS series can be used:-
• where a more recent indication of data is required, between publication of SFRs;
• to provide analysis by region or single year of age (although it is necessary to use estimates based on 3 year averages for this purpose).
Careers Wales Survey
The only source of data in respect of local areas available to us is the Careers Wales pupil destinations survey. This provides estimates of young people who are NEET in the October after completing Year 11 and is available at a local authority level. However the Careers Wales survey uses slightly different definitions for NEET than those used in the SFR. The Careers Wales series can be used:-
• to consider relative levels of young people who are NEET by local authority.
SFR series (last updated – July 2012)
Link to SFR
For this series the data presented covers 16-18 year olds on an academic age basis (ie age as at 31 August prior to the start of the academic year).
The estimates published in the SFR are a measure of the proportion of young people who are NEET as at the end of the calendar year. It is based on population estimates as at the end of the calendar year, education enrolment counts in December for work-based learning, further and higher education and in the following January for schools. The Annual Population Survey is used to estimate the proportion of those not in education or training who are unemployed or inactive and relates to the whole of the reference year.
As at end 2011(p), 12.0 per cent of 16-18 year olds were NEET (13,600) compared with 11.1 per cent (12,800) at end 2010. Chart 1 shows the published SFR time series of NEET rates for 16-18 year olds. The series shows that the proportion of young people who are NEET has ranged between 10-12 per cent over the years 1996 to 2011 accounting for around 12,000-15,000 young people. Due to the use of survey data within the calculations there will be some element of sampling variability in the estimates. The chart also shows an estimate of NEET rate based on the Annual Population Survey1 only. These estimates are for
the calendar year. Both series show similar trends.
Chart 1: Young people not in education, employment or training in Wales, age 16-18:
Comparison of estimates in the Statistical First Release and using the Annual
Population Survey (calendar year)
0 2 4 6 8 10 12 14 16
1996 1997 1998 1999 2000 2001 2002 2003 2004 2005 2006 2007 2008 2009 2010
2011 (
p)
Year end
P
er cen
t
SFR APS
(p) SFR: Year end 2011 is provisional
1
APS rolling year series (last updated – October 2012)
New data
The data presented covers 16-18 year olds on an academic age basis (ie age as at 31 August prior to the start of the academic year).
The Annual Population Survey (APS) is published on a rolling year basis every quarter. The most recent published year covers the period July 2011 to June 2012. Estimates based on the APS are less robust than the annual series, given the sample sizes involved, particularly for the 16 to 18 cohort. They can be used to give an indication, only, of trends in NEET rates between publications of the annual SFR.
The reference period for these estimates is the whole year and there is a large overlap in the responses included in consecutive rolling years. Therefore the overall trend of the series should be considered with comparisons to the same point a year previous and not changes between consecutive rolling year
estimates. As these estimates are based on survey data there will be some variability in estimates due to sampling variation.
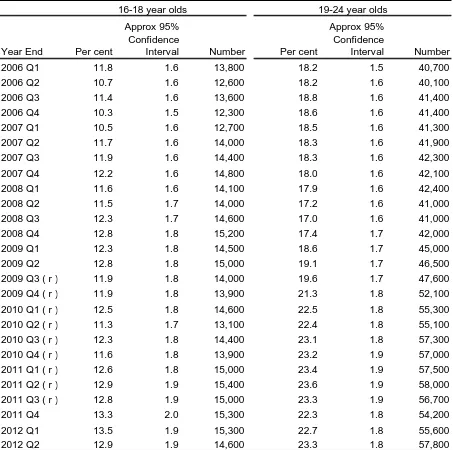
Chart 2 shows the APS rolling year series for the years (April 2005-March 2006) to (July 2011 to June 2012) along with a four-point moving average of the series. Over this period the estimate of the proportion of young people who are NEET has fluctuated between 10-13.5 per cent, with an upward trend over the last year. Table 2 includes approximate 95 per cent confidence intervals for these estimates which for all periods is around ±2 per cent.
The latest data show, for the year ending Quarter 2 2012, 12.9 per cent of 16-18 year olds were estimated to be NEET, unchanged from the previous year (year ending Q2 2011)
Chart 2: Young people not in education, employment or training in Wales, age 16-18:
Annual Population Survey (rolling year ending) and 4 point moving average
0 2 4 6 8 10 12 14 16 2006 Q 1 2006 Q 2 2006 Q 3 2006 Q 4 2007 Q 1 2007 Q 2 2007 Q 3 2007 Q 4 2008 Q 1 2008 Q 2 2008 Q 3 2008 Q 4 2009 Q 1 2009 Q 2 2009 Q 3 2009 Q 4 2010 Q 1 2010 Q 2 2010 Q 3 2010 Q 4 2011 Q 1 2011 Q 2 2011 Q 3 2011 Q 4 2012 Q 1 2012 Q 2 Year end Pe r c e n t
The APS can also be used to provide analysis of NEET rates by characteristics not available via the SFR series. Due to small sample sizes when looking at sub-groups it has been necessary to use estimates based on three year averages and therefore should be used to compare groups or regions only. Chart 3 shows analysis by gender and single year of age and Chart 4 provides regional data2.
Chart 3: Young people not in education, employment or training in Wales:
by age and gender (average of years ending 2010Q2, 2011Q2, 2012Q2)
0 2 4 6 8 10 12 14 16 18 20
Male 16-18 Female 16-18 16 17 18
Age and gender
P
er cen
t
Chart 4: Young people not in education, employment or training in Wales, age 16-18:
by region (average of years ending 2010Q2, 2011Q2, 2012Q2)
0 2 4 6 8 10 12 14 16
North Wales Mid Wales (!!) South West Wales
South East Wales
Wales
P
er cen
t
(!!) The data item is based on between approx. 10 and 25 responses and is categorised as being of low quality
2
Comparisons with the rest of the UK
The Department for Education (DFE) publish estimates of 16-18 year old NEET rates for England using similar methodology to our SFR on an annual basis. The most recent published data are 2011 provisional figures. Chart 5 shows a comparison of the English and Welsh estimates.
Chart 5: Young people not in education, employment or training in Wales, age 16-18:
Wales and England
0 2 4 6 8 10 12 14
1996 1997 1998 1999 2000 2001 2002 2003 2004 2005 2006 2007 2008 2009 2010 2011 (p)
Per c
e
n
t
Wales England
The DFE also publish a quarterly brief on young people who are NEET which includes NEET rates estimates based on the Quarterly Labour Force Survey (LFS). These quarterly estimates are not seasonally adjusted. The quarterly estimates are not comparable with the Welsh APS only estimates published in this bulletin. The sample size for 16-18 year olds in Wales in the Quarterly LFS is not sufficiently large to produce quarterly estimates for Wales.
Pupil destinations from schools in Wales (last updated – March 2012)
Link to Pupil Destinations Headline
Careers Wales undertakes an annual survey of all leavers from maintained schools2 in Wales to obtain
their destinations as at end of October. The results from this survey can be used to provide estimates of NEET rates by UA for 16 year olds. Chart 6 shows the proportion of 2011 Year 11 leavers who were NEET. The survey also includes information on whether those recorded as NEET were able to enter employment. Leavers may be unable to enter employment due to sickness, pregnancy, custodial sentence etc.
Chart 6: Year 11 leavers who are NEET by Unitary Authority of school, 2011
0 2 4 6 8 10
Isle of Anglesey Flintshire Carmarthenshire Powys Swansea Ceredigion Wrexham Gwynedd Denbighshire Pembrokeshire Monmouthshire Rhondda, Cynon, Taff Conwy The Vale of Glamorgan Bridgend Wales Caerphilly Neath Port Talbot Merthyr Tydfil Blaenau Gwent Torfaen Newport Cardiff
Per cent
12
Chart 7: Year 11 leavers who are NEET and employment entry status, 2011
56.7% 29.1%
14.1%
Able to enter employment etc, registered with Careers Wales Able to enter employment etc, NOT registered with Careers Wales
Unable to enter employment etc
2
Tables
Table 1: Young people not in education, employment or training in Wales, Calendar Year
Per cent Number Per cent Number Per cent Number Per cent Number
End 1996 12.1 12,800 .. .. 19.7 40,900 .. ..
End 1997 10.6 11,700 .. .. 18.5 36,800 .. ..
End 1998 11.9 13,200 .. .. 19.3 37,600 .. ..
End 1999 11.6 12,800 .. .. 18.6 37,100 .. ..
End 2000 10.7 11,700 .. .. 17.9 36,500 .. ..
End 2001 11.7 13,100 11.8 13,000 18.9 38,900 19.9 39,700 End 2002 11.8 13,700 11.1 12,500 18.0 38,000 19.1 39,300 End 2003 12.6 14,900 11.9 13,700 16.7 36,700 17.6 36,800 End 2004 11.6 13,900 11.8 13,900 16.1 36,600 16.4 35,400 End 2005 10.3 12,400 12.1 13,900 17.5 40,600 18.2 40,800 End 2006 10.0 12,000 10.3 12,300 18.0 43,200 18.6 41,400 End 2007 11.8 14,300 12.2 14,800 17.6 43,400 18.0 42,100 End 2008 12.4 15,000 12.8 15,200 17.6 44,300 17.4 42,000 End 2009 12.2 14,400 11.9 13,900 22.0 56,300 21.3 52,100 End 2010 11.1 12,800 11.6 13,900 23.0 59,300 23.2 57,000 End 2011 (p) 12.0 13,600 13.3 15,300 22.2 57,400 22.3 54,200
Source: WG Statistical First Release (SDR 111/2012) Participation of Young People in Education and the Labour Market;
Annual Local Labour Force Survey for Wales 2001-2003; Annual Population Survey 2004-2011
16-18 year olds 19-24 year olds
Year End Per cent
Approx 95% Confidence
Interval Number Per cent
Approx 95% Confidence
Interval Number
2006 Q1 11.8 1.6 13,800 18.2 1.5 40,700
2006 Q2 10.7 1.6 12,600 18.2 1.6 40,100
2006 Q3 11.4 1.6 13,600 18.8 1.6 41,400
2006 Q4 10.3 1.5 12,300 18.6 1.6 41,400
2007 Q1 10.5 1.6 12,700 18.5 1.6 41,300
2007 Q2 11.7 1.6 14,000 18.3 1.6 41,900
2007 Q3 11.9 1.6 14,400 18.3 1.6 42,300
2007 Q4 12.2 1.6 14,800 18.0 1.6 42,100
2008 Q1 11.6 1.6 14,100 17.9 1.6 42,400
2008 Q2 11.5 1.7 14,000 17.2 1.6 41,000
2008 Q3 12.3 1.7 14,600 17.0 1.6 41,000
2008 Q4 12.8 1.8 15,200 17.4 1.7 42,000
2009 Q1 12.3 1.8 14,500 18.6 1.7 45,000
2009 Q2 12.8 1.8 15,000 19.1 1.7 46,500
2009 Q3 ( r ) 11.9 1.8 14,000 19.6 1.7 47,600 2009 Q4 ( r ) 11.9 1.8 13,900 21.3 1.8 52,100 2010 Q1 ( r ) 12.5 1.8 14,600 22.5 1.8 55,300 2010 Q2 ( r ) 11.3 1.7 13,100 22.4 1.8 55,100 2010 Q3 ( r ) 12.3 1.8 14,400 23.1 1.8 57,300 2010 Q4 ( r ) 11.6 1.8 13,900 23.2 1.9 57,000 2011 Q1 ( r ) 12.6 1.8 15,000 23.4 1.9 57,500 2011 Q2 ( r ) 12.9 1.9 15,400 23.6 1.9 58,000 2011 Q3 ( r ) 12.8 1.9 15,000 23.3 1.9 56,700
2011 Q4 13.3 2.0 15,300 22.3 1.8 54,200
2012 Q1 13.5 1.9 15,300 22.7 1.8 55,600
[image:9.595.44.497.95.545.2]2012 Q2 12.9 1.9 14,600 23.3 1.8 57,800
Table 2: Young people not in education, employment or training in Wales,
16-18 year olds 19-24 year olds
Source: Annual Population Survey 2006-2012
Table 3: Year 11 Leavers for Schools in Wales known to be not in education, employment or training by Unitary Authority
2007 2008 2009 2010 2011
Wales 6.9 7.1 5.7 5.4 4.4
Isle of Anglesey 6.7 8.1 5.2 5.3 2.7
Gwynedd 4.4 5.7 4.2 3.6 3.6
Conwy 5.5 5.7 4.8 3.7 4.0
Denbighshire 4.9 6.2 4.4 4.4 3.6
Flintshire 4.6 7.2 3.7 2.8 2.7
Wrexham 8.9 9.6 5.0 4.2 3.4
Powys 5.3 3.0 2.1 2.9 3.0
Ceredigion 2.6 3.8 2.3 2.3 3.3
Pembrokeshire 4.7 6.4 4.8 4.8 3.8
Carmarthenshire 5.5 4.4 4.0 2.9 2.8
Swansea 5.8 5.8 6.4 4.2 3.1
Neath Port Talbot 9.0 7.7 7.1 6.6 4.6
Bridgend 7.3 8.0 7.6 7.1 4.4
The Vale of Glamorgan 6.8 6.2 5.6 4.6 4.3
Cardiff 8.5 10.6 8.9 8.8 7.7
Rhondda, Cynon, Taff 7.5 6.1 4.9 5.7 3.9
Merthyr Tydfil 7.9 7.8 4.6 7.6 5.6
Caerphilly 7.1 7.1 5.0 6.0 4.5
Blaenau Gwent 10.4 9.7 6.6 8.7 6.6
Torfaen 10.5 10.1 8.2 7.0 6.7
Monmouthshire 5.6 5.3 5.0 3.9 3.8
Newport 9.3 10.4 9.1 7.5 6.7
NOTES
Policy/Operational context
This Bulletin summarises the available statistics on young people not in education, employment
or training (NEET) in Wales. It is updated quarterly with latest estimates from the Annual
Population Survey, and annually with the headline SFR series (July) and the Careers Wales
destinations survey data (April). The statistics are used within the Welsh Government to
monitor trends in the level and proportion of young people who are NEET. It is one of the
measures included within the Programme for Government in the context of Tackling Poverty.
The 2011-2015 Youth Engagement and Employment Action Plan was published in January 2011. It
outlines the Welsh Government’s approach to preventing children and young people from
disengaging from learning and supporting them with entry to the labour market. An action
contained in the plan is to strengthen data management, statistical information, and sharing of
information on young people who are not in education, employment or training between
organisations to ensure a more joined up service is provided for the young person, including
the development of a robust tracking system. The Youth Engagement and Employment
Division are now working to establish a revised Youth Engagement and Employment Action
Plan, in light of the Programme for Government and the need to further reduce the numbers of
young people who are, or who are at risk of becoming, NEET.
1. Summary of data sources
a. NEET SFR series
Description This data is the definitive measure for NEET rates in Wales.
Uses This series is the key statistical source for estimates of the number and
proportion of young people who are NEET in Wales. The SFR series provides policy makers and those working with young people with data to monitor trends by age and gender and the impact of education and labour market interventions on young people. The Welsh
Government is committed to reducing the proportion of young people who are NEET in Wales as outlined in the 2011-2015 Youth Engagement and Employment Action Plan (currently under revision). This series is used in the measure of young people who are NEET in Wales within the Programme for Government
Published source WG Statistical First Release Participation of young people in education and the labour market
Primary sources Pupil Level Annual Schools’ Census (WG)
Lifelong Learning Wales Record (WG) Student Record (HESA)
Open University
Annual Population Survey (ONS)
Mid- year estimates of resident population and population projections(ONS)
Last period covered End 2011 (p)
Last published July 2012
b. NEET APS series
Description This series is a rolling year annual estimate of the proportion of
young people who are NEET from the Annual Population Survey.
Uses This series provides more timely data than the annual SFR and is
used to provide an indication of trends in the proportion of young people who are NEET between SFRs. It is not directly comparable with the SFR series and estimates are less robust. The APS estimates, published quarterly, are based on survey data and therefore there is variability due to sampling error. For each 12 month period less than 1,500 young people aged 16-18 responded to the survey. Also given the structure of the APS there is a large overlap between consecutive rolling years. Trends should be considered and not changes between consecutive rolling year estimates. Comparisons are made with the same point a year previous. For sub-groups the sample sizes are relatively small and subject to relatively large sampling error so three year averages are generally used.
Published source Annual Population Survey (ONS)
Primary sources Annual Population Survey (ONS)
Last period covered Year ending 2012 Q2
Last published APS published September 2012, NEET APS series published October
2012
Next published APS published December 2012, NEET APS series published January
2013
c. NEET Pupil Destinations Survey
Description This series is an annual estimate of the Year 11 leavers (aged 16) who
are NEET as at October following the end of the academic year.
Uses Neither the SFR nor the APS series can be used to provide estimates
at a Unitary Authority level due to small sample sizes in the APS and methodology used to derive the SFR estimates. This series provides an indication of the level of young people who are NEET at a Unitary Authority level. It should only be used for 16 year olds. It is not directly comparable with the SFR series or the APS series due to differences in definitions.
Published source Destinations of leavers from schools in Wales (Careers Wales)
Primary sources Destinations of leavers from schools in Wales (Careers Wales)
Last period covered October 2011
Last published April 2012
Next published April 2013
2. Definitions
Education and training
Employment
The APS is used to estimate the proportion in employment for both the SFR and APS based estimates. In addition employment status from Post-16 enrolment data is used in the SFR.
From the APS respondents are in employment if they are either:
• Employed; or
• Self-employed; or
• On government employment or training programmes; or
• An unpaid family worker.
Key Quality Information
3. Annual Population Survey (APS): Quality
The Annual Population Survey (APS) is a household survey carried out by the ONS. The survey seeks information on respondents' personal circumstances, including their labour market status and their education and training activity.The APS combines the boosted samples of the Labour Force Survey (LFS) and provides rolling four quarter data. The APS datasets are derived from a sample of
approximately 23,000 people of working age across Wales, with a minimum of around 800 people of working age in most local authorities in Wales. However, for 16-18 year olds there are less than 1,500 respondents in the sample across Wales.
As the data come from a survey, the results are sample-based estimates and are therefore subject to differing degrees of sampling variability, i.e. the true value for any measure lies in a differing range about the estimated value. Approximate 95 per cent confidence intervals have been calculated for the APS estimates of the proportion of young people aged 16-18 who are NEET. These have been calculated assuming a simple weighted random sample and do not take into account the design of the sample and thus only provide an indication of the confidence interval. The sampling variability increases as the detail in the data increases and therefore for the 16-18 age group, of interest in this bulletin, estimates for sub-groups and regions are based on three year averages.
Further information about the quality of the Annual Population Survey can be accessed via the following link http://www.ons.gov.uk/ons/guide-method/method-quality/quality/quality-information/social-statistics/index.html
Chart 1 demonstrates, from 2006 onwards, the similar levels and trend in young people who are NEET shown between the SFR and APS series, with a difference at most of 1 percentage point.
4. Timeliness
The latest SFR provides new data for 2010 and provisional data for 2011. The provisional estimates use the best data for 2011 currently available for each aspect of participation; this includes some final data, some provisional data and some modelling.
5. Estimates below Wales level
It is not possible to disaggregate the SFR NEET estimate down to UA level. This is due to the way the data is put together using enrolment data and because the employment status is estimated using the APS. For 16-18 year olds the number of respondents to the APS is relatively small in each UA; less than 100 respondents.
three years. The regional breakdown was changed as at the beginning of the 2010. The regions in use are as follows:
North Wales: Isle of Anglesey, Gwynedd, Conwy, Denbighshire, Flintshire, Wrexham
Mid Wales: Powys, Ceredigion
South West Wales: Pembrokeshire, Carmarthenshire, Swansea, Neath Port Talbot
South East Wales: Bridgend, Vale of Glamorgan, Rhondda Cynon Taf, Merthyr Tydfil, Caerphilly, Blaenau Gwent, Torfaen, Monmouthshire, Newport, Cardiff
The Pupil Destinations survey provides an estimate of 16 year olds who are NEET by UA. However, there are some differences in the NEET definitions compared with the SFR and APS based estimates.
6. Revisions
SFR series: Provisional 2011 figures will be finalised in the next SFR publication, due for release in July 2013. For the proportion of 16-18 year olds estimated to be NEET in 2010, the difference between the provisional estimate published in the previous release and the final published estimate was 0.1 percentage point.
APS series: These estimates of young people who are NEET are revised when the Office for National Statistics (ONS) releases revised Annual Population Survey datasets. Within this bulletin there are revisions to data between Q3 2009 and Q3 2011 due to reweighting of these datasets by ONS. The following table indicates that in most cases the percentage who are NEET is unchanged, but changes at most by 0.1 percentage point, however there are larger increases to the numbers who are NEET
reflecting the change to the underlying population base.
Change in estimates from previous bulletin following reweighting
Year End Per cent Number Per cent Number
2009 Q3 0.0 0 0.0 -100
2009 Q4 0.0 0 0.0 0
2010 Q1 0.0 100 0.0 200
2010 Q2 0.0 100 0.0 500
2010 Q3 0.0 100 0.0 700
2010 Q4 0.1 100 0.0 900
2011 Q1 0.1 200 0.0 700
2011 Q2 0.1 100 0.0 400
2011 Q3 0.0 100 -0.1 200
16-18 year olds 19-24 year olds
7. Missing value symbols
Missing value symbols used in this Bulletin are as outlined below. .. The data item is not available
. The data item is not applicable
- The data item is not exactly zero, but estimated as zero or less than half the final digit shown