Estimating the prevalence of the
‘toxic trio’
Evidence from the Adult Psychiatric Morbidity Survey
Vulnerability Technical Report 2
1
Written by Haroon Chowdry, Head of Analysis, Children’s Commissioner’s Office
Address for correspondence: [email protected]
Acknowledgements
2
Contents
1. Introduction ... 3
2. Aims of this report ... 3
3. Data and limitations ... 3
4. Methods ... 5
5. Results ... 6
5.1. Directly estimated results ... 6
5.2. Assumed results for other age groups ... 8
6. Conclusions and next steps ... 10
References ... 12
Appendix A: Additional information on derived measures ... 13
DV&A measures ... 13
Substance misuse measures ... 13
Mental ill-health measures ... 14
Appendix B: Additional results ... 15
Prevalence estimates for the individual variables used for each indicator ... 15
3
1.
Introduction
This report contains new quantitative analysis by the Children’s Commissioner’s Office (CCO) on the potential numbers of children in England living in households where the ‘toxic trio’ of factors affecting adults may be present. The ‘toxic trio’ is the interaction of:
Domestic violence and abuse (DV&A) within the household Parental substance misuse (alcohol or drugs)
Parental mental health issues
There is a wide literature showing that each of these issues can have damaging consequences for the wellbeing and outcomes of children; see, for example, Wolfe et al. (2003), Manning and Gregoire (2009), Stanley and Cox (2009), Cleaver et al. (2011), Guy et al. (2014), Harold et al. (2016), and Hedges and Kenny (2018). The ‘toxic trio’ issues – and associated responses of frontline practitioners – have been cited as a major driver of the increases on children’s services caseloads and the numbers of children being taken into care (ADCS, 2016), and have also been frequently cited as a factor in serious case reviews (Sidebotham et al., 2016). Despite this, there is very little recent and representative empirical evidence on the prevalence of these factors, especially their co-occurrence within the same household.
2.
Aims of this report
This report summarises the approach and results of new analysis to provide prevalence figures for these issues, and their co-occurrence, for children in England. This analysis also feeds into the Children’s Commissioner’s ongoing study of childhood vulnerability,1 first launched in 2017 and updated in July 2018. The framework attempts to map out the total numbers of children experiencing different types of vulnerability and shed light on specific groups that are priorities for further research and policy attention. Children in households where the above issues are present are key vulnerable groups where better evidence on the numbers, needs, experiences, outcomes and voices of these children is required.
This analysis also aims to shed light on the extent of double-counting that arises when individual prevalence for each of the above issues are added together. Existing available statistics tend to only provide indicators of the prevalence of each issue separately. These statistics on their own cannot be used to assess the prevalence of combinations of these issues or the ‘toxic trio’, without making some kind of adjustment to account for potential double-counting. This analysis provides an empirical basis for that adjustment where previously there was none.
3.
Data and limitations
This analysis is based on the 2014 Adult Psychiatric Morbidity Survey (APMS), a sample of around 7,500 adults in living in private households in England.2 This is the fourth such survey of psychiatric morbidity, having previously been carried out in 1993, 2000 and 2007. The 2007 survey has previously been used for obtaining population estimates of the adult prevalence of mental health issues and inter-personal
1 See https://www.childrenscommissioner.gov.uk/publication/childrens-commissioners-report-on-vulnerability/.
2 For more information on this data, see
4 violence and abuse; see Scott et al. (2015) and Scott and McManus (2016). The 2014 survey has been used to estimate the adult-level prevalence of mental ill-health and substance misuse (McManus et al., 2016), and more recently been used to estimate the prevalence of alcohol dependence and the numbers of children affected (Pryce et al., 2017).
In this survey the respondents were asked a range of questions about their physical health, mental health and wellbeing (including psychiatric disorders), usage of alcohol and drugs, and experiences of inter-personal and sexual violence. Respondents were also asked to state how many children were resident in the household, along with their ages. In principle, this information allows one to estimate the proportions and numbers of children living in households where any or several of these issues are present – and therefore allows the prevalence of the ‘toxic trio’ to be assessed.
A major limitation of this analysis is that the APMS only surveys one adult in a household, rather than all of the adults. While the data can provide a reliable estimate of the national prevalence of adults experiencing these issues, it cannot provide a complete picture of household-level vulnerability, i.e. the proportion of households (or children in households) where these issues are present. The results obtained from this analysis will be valid estimates of the number of children living in a household where a randomly-selected adult is affected by a given issue, which is not the same as the numbers of children living in a household where any adult is affected by that issue. As the former is generally lower than the latter, the estimates will be downward-biased: that is, they will underestimate the numbers of children living in households where the issues of interest are present.3 We therefore frame our resulting estimates as conservative lower bounds.
While all the figures produced in this analysis are underestimates, the estimates of ‘toxic trio’ prevalence may be particularly significantly underestimated. Using the APMS data, one would categorise an adult as experiencing the ‘toxic trio’ only if it was that individual who experienced DV&A, had a substance misuse issue, and had a mental health issue. Survey respondents were not asked whether these issues applied to a partner or another adult in the household. In reality, it may be that in some or even many ‘toxic trio’ households, these issues are actually split across different adults in the household (e.g. one partner is a problematic drinker and abuses the other partner who has mental health problems). If these households were included in the APMS sample, they would – falsely – be categorised as not having the ‘toxic trio’ present.
It is also worth mentioning some additional but less significant limitations:
With the available data, it was not possible to establish whether or how the children in the household were related to the survey respondent. For this reason, we describe our results as the estimated prevalence of children living in a household where an adult (randomly selected) reports a given issue, rather than the prevalence of children whose parent reports a given issue.4
Adults, including the responding adult, were defined in the APMS as individuals aged 16 or over. Therefore a survey respondent could, in a small number of cases, themselves be a child in
3 In the absence of additional data that asks the same questions of all adults in a household, the scale of this bias cannot be determined.
5 the sense of being below the age of 18.5
Children were defined in the APMS as individuals aged 15 or under. Furthermore, the data available for this analysis only indicated how many 0-5 year olds and 6-15 year olds were resident in the household. This therefore misses out children aged 16 and 17. In our analysis we attempt to produce prevalence figures for the whole 0-17 population, but these are based on pro rata assumptions rather than directly estimated from the data at hand.
The measures constructed for this analysis are limited to the nature of the questions asked in the APMS. Some issues – such as alcohol use or certain psychiatric disorders – are well captured through the use of recognised and standardised measures with thresholds that indicate clinical significance or need for further intervention. For DV&A, we combine many different survey questions to create a proxy for the construct of interest, although these are questions that have been previously used to identify the presence of DV&A.
The figures presented in this analysis are central estimates derived from a finite-sample survey. While confidence intervals have not been presented (this was complicated by the survey design), there is a statistical margin of error around all results which should be borne in mind. The APMS fieldwork was carried out between May 2014 and September 2015. Underlying
prevalence rates may have changed since then, but this is unlikely to be a source of large bias. Despite these limitations, the dataset permits analysis that provides considerable added value over the existing available evidence. Our results should not be considered as the gold standard of evidence on the prevalence of the ‘toxic trio’ and related issues within households, but instead as significant improvements over the very little that is currently known.
4.
Methods
The estimated prevalence of the ‘toxic trio’ and the related issues will depend crucially on whether the severity of those issues is high enough to cross a given threshold. In order to illustrate this we define two indicators of the ‘toxic trio’ – a broad measure based on moderate severity and a narrow measure based on high severity – and produce prevalence estimates for both. To facilitate this we derive moderate and high severity indicators of experiencing DV&A, having substance misuse issues, and having mental health issues.
From the APMS questions we derive two indicators of the survey respondent’s experiences of DV&A: Whether they have ever experienced DV&A (moderate severity)
Whether they have experienced DV&A within the last year (high severity)
For substance misuse, we derive the following indicators:
Whether the survey respondent engages in substance misuse (moderate severity) Whether the survey respondent is dependent on alcohol or drugs (high severity)
For mental ill-health, we derive the following measures:
Whether the survey respondent reports moderate or higher symptoms of mental or psychiatric
6 disorders (moderate severity)
Whether the survey respondent reports severe symptoms of mental or psychiatric disorders (high severity)
The full details of how these indicators were derived is in Appendix A. We strive to be as consistent as possible with the mental health and substance misuse measures previously reported from this data by McManus et al. (2016).
[image:7.595.56.496.252.316.2]For each indicator, the high-severity version is a subset of the moderate-severity version. The two are not mutually exclusive: individuals meeting the high-severity criteria are categorised as also meeting the moderate-severity criteria. Table 1, below, summarises the ‘toxic trio’ indicators reported in the analysis.
Table 1. Adult indicators used to define presence of the ‘toxic trio’
Broad measure Narrow measure
DV&A Ever experienced DV&A Experienced DV&A within last year
Substance misuse Reported substance misuse Reported alcohol or drug dependency
Mental ill-health Moderate or higher symptoms of
mental or psychiatric disorders
Severe symptoms of mental or psychiatric disorders
As all the indicators are binary variables, we report estimated population means (proportions), taking full account of the APMS sample weights and cluster design. The analysis is carried out on a child-level dataset6 so that all figures relate to estimated proportions of children, rather than proportions of adults. Our child-level dataset contains 3,079 observations, each one corresponding to a child aged 0-15. We also calculate corresponding headcount totals of children in England affected by these issues, by combining our estimated proportions with the latest available (mid-2016) population estimates from the Office for National Statistics (ONS).7
As mentioned above, the dataset defines a child as aged under 16, and provides information on the number of children aged 0-5 and 6-15 within each household. In the next section we present the directly estimated results for these two age groups, including estimated population totals for England, as well as generalised results for other age groups such as 0-1s and 0-17s.
5.
Results
5.1.
Directly estimated results
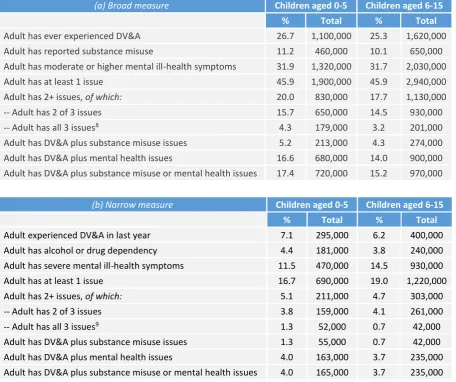
Tables 2 and 3, below, set out the main results for the two child age groups observed in the APMS data: 0-5 year olds and 6-15 year olds. Table 2 shows the estimated prevalences for the indicators listed in Table 1 above, while Tables 3(a) and 3(b) provide the estimated prevalences for the broad and narrow ‘toxic trio’ measures respectively.
Table 2 shows that significant numbers of children in England are in a household where a randomly-selected adult reports an indicator of interest. We estimate that roughly 25-27% of children live with an
6 We turn the dataset from adult-level to child-level by creating observations for each child in the household and removing the observation for the adult.
7 See
7 adult (randomly-selected) who has ever experienced DV&A, including 6-7% where that adult has experienced it within the last year. Over 10% of children aged 0-15 live in a household where a randomly-selected adult reports substance misuse, including roughly 4% where that adult is dependent on alcohol or drugs. Around 32% of children aged 0-15 live in a household where a randomly-selected adult has moderate or severe symptoms of mental ill-health, including 11.5% of 0-5 year olds and 14.5% of 6-15 year olds where that adult has severe symptoms.
Table 2. Estimated child-level prevalence in England of adult indicators listed in Table 1
Children aged 0-5 Children aged 6-15
% Total % Total
Adult has ever experienced DV&A 26.7 1,100,000 25.3 1,620,000 Adult experienced DV&A in last year 7.1 295,000 6.2 400,000 Adult has reported substance misuse 11.2 460,000 10.1 650,000 Adult has alcohol or drug dependency 4.4 181,000 3.8 240,000 Adult has moderate or higher mental ill-health symptoms 31.9 1,320,000 31.7 2,030,000 Adult has severe mental ill-health symptoms 11.5 470,000 14.5 930,000
Table 3. Estimated child-level prevalence in England for the ‘toxic trio’
(a) Broad measure Children aged 0-5 Children aged 6-15
% Total % Total
Adult has ever experienced DV&A 26.7 1,100,000 25.3 1,620,000 Adult has reported substance misuse 11.2 460,000 10.1 650,000 Adult has moderate or higher mental ill-health symptoms 31.9 1,320,000 31.7 2,030,000 Adult has at least 1 issue 45.9 1,900,000 45.9 2,940,000 Adult has 2+ issues, of which: 20.0 830,000 17.7 1,130,000
-- Adult has 2 of 3 issues 15.7 650,000 14.5 930,000
-- Adult has all 3 issues8 4.3 179,000 3.2 201,000
Adult has DV&A plus substance misuse issues 5.2 213,000 4.3 274,000 Adult has DV&A plus mental health issues 16.6 680,000 14.0 900,000 Adult has DV&A plus substance misuse or mental health issues 17.4 720,000 15.2 970,000
(b) Narrow measure Children aged 0-5 Children aged 6-15
% Total % Total
Adult experienced DV&A in last year 7.1 295,000 6.2 400,000
Adult has alcohol or drug dependency 4.4 181,000 3.8 240,000
Adult has severe mental ill-health symptoms 11.5 470,000 14.5 930,000
Adult has at least 1 issue 16.7 690,000 19.0 1,220,000
Adult has 2+ issues, of which: 5.1 211,000 4.7 303,000
-- Adult has 2 of 3 issues 3.8 159,000 4.1 261,000
-- Adult has all 3 issues9 1.3 52,000 0.7 42,000
Adult has DV&A plus substance misuse issues 1.3 55,000 0.7 42,000 Adult has DV&A plus mental health issues 4.0 163,000 3.7 235,000 Adult has DV&A plus substance misuse or mental health issues 4.0 165,000 3.7 235,000
[image:8.595.59.516.332.714.2]
8
5.2.
Assumed results for other age groups
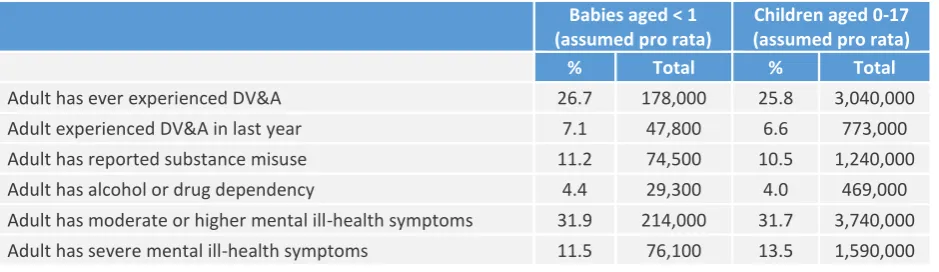
We generalise these results to provide additional results for babies aged under 1 or all children (aged 0-17). The results for babies are obtained pro rata, by taking the directly estimated prevalence rates for children aged 0-5 and applying them to the relevant ONS population estimates for children aged under 1. In order to produce an estimated prevalence rate and England total for 0-17 year olds, we also apply our estimated prevalence rates for 6-15 year olds to ONS population figures for 6-17 year olds pro rata, and add the result to our previously estimated England totals for 0-5 year olds.
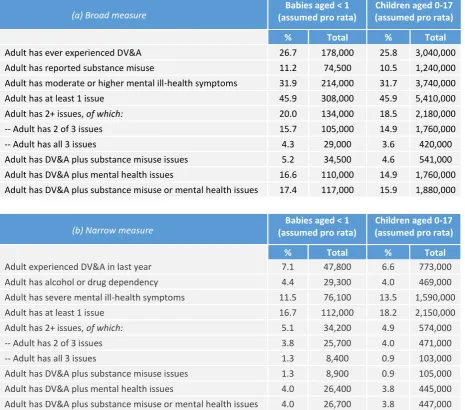
Table 4 shows, for these age groups, the estimated prevalences for the indicators listed in Table 1, while Tables 5(a) and 5(b) provide the estimated prevalences for the broad and narrow ‘toxic trio’ measures respectively. For brevity, we only describe the results for 0-17 year olds.
[image:9.595.59.529.417.553.2]Once we weight using ONS population estimates, we find that 25.8% of children aged 0-17 live in a household where a randomly-selected adult has ever experienced DV&A – around 3 million children. This includes 773,000 children aged 0-17 where the adult has experienced DV&A within the last year. We estimate that over 1.2 million children aged 0-17 live in a household where a randomly-selected adult reports substance misuse, including 469,000 children where that adult is dependent on alcohol or drugs. Finally, we estimate that 3.7 million children aged 0-17 are in a household where a randomly-selected adult has moderate or higher mental ill-health symptoms, including 1.6 million children where that adult has severe mental ill-health symptoms.
Table 4. Estimated child-level prevalence in England of adult indicators listed in Table 1, generalised to other age groups
Babies aged < 1 (assumed pro rata)
Children aged 0-17 (assumed pro rata)
% Total % Total
Adult has ever experienced DV&A 26.7 178,000 25.8 3,040,000 Adult experienced DV&A in last year 7.1 47,800 6.6 773,000 Adult has reported substance misuse 11.2 74,500 10.5 1,240,000 Adult has alcohol or drug dependency 4.4 29,300 4.0 469,000 Adult has moderate or higher mental ill-health symptoms 31.9 214,000 31.7 3,740,000 Adult has severe mental ill-health symptoms 11.5 76,100 13.5 1,590,000
Table 5(a) shows, on the broad ‘toxic trio’ measure, that around 5.4 million children aged 0-17 are in a household where a randomly-selected adult reports at least one of the moderate severity ‘toxic trio’ issues. Around 15% of children – 1.76 million – live in a household where a randomly-selected adult reports two of these issues, and a further 3.6% of children (420,000) live in a household where all three issues affect a randomly-selected adult.
9
Table 5. Estimated child-level prevalence in England for the ‘toxic trio’, generalised to other age groups
(a) Broad measure (assumed pro rata) Babies aged < 1 (assumed pro rata) Children aged 0-17
% Total % Total
Adult has ever experienced DV&A 26.7 178,000 25.8 3,040,000
Adult has reported substance misuse 11.2 74,500 10.5 1,240,000
Adult has moderate or higher mental ill-health symptoms 31.9 214,000 31.7 3,740,000
Adult has at least 1 issue 45.9 308,000 45.9 5,410,000
Adult has 2+ issues, of which: 20.0 134,000 18.5 2,180,000
-- Adult has 2 of 3 issues 15.7 105,000 14.9 1,760,000
-- Adult has all 3 issues 4.3 29,000 3.6 420,000
Adult has DV&A plus substance misuse issues 5.2 34,500 4.6 541,000 Adult has DV&A plus mental health issues 16.6 110,000 14.9 1,760,000 Adult has DV&A plus substance misuse or mental health issues 17.4 117,000 15.9 1,880,000
(b) Narrow measure (assumed pro rata) Babies aged < 1 (assumed pro rata) Children aged 0-17
% Total % Total
Adult experienced DV&A in last year 7.1 47,800 6.6 773,000 Adult has alcohol or drug dependency 4.4 29,300 4.0 469,000 Adult has severe mental ill-health symptoms 11.5 76,100 13.5 1,590,000
Adult has at least 1 issue 16.7 112,000 18.2 2,150,000
Adult has 2+ issues, of which: 5.1 34,200 4.9 574,000
-- Adult has 2 of 3 issues 3.8 25,700 4.0 471,000
-- Adult has all 3 issues 1.3 8,400 0.9 103,000
Adult has DV&A plus substance misuse issues 1.3 8,900 0.9 105,000 Adult has DV&A plus mental health issues 4.0 26,400 3.8 445,000 Adult has DV&A plus substance misuse or mental health issues 4.0 26,700 3.8 447,000
In Appendix B, we provide some additional results that may be of interest. First, we provide prevalence estimates for each component variable that feeds into the DV&A, substance misuse and mental health indicators. Second, we also provide prevalence estimates for the ‘toxic trio’ issues alongside low income – defined as the bottom quintile of equivalised household income – in order to include a focus on household deprivation as another potential risk factor.
10
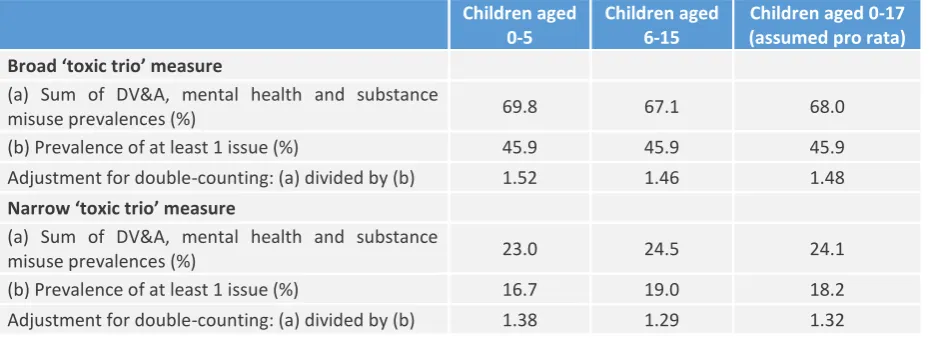
Table 4. Estimated adjustments for double-counting if only univariate data available
Children aged 0-5
Children aged 6-15
Children aged 0-17 (assumed pro rata)
Broad ‘toxic trio’ measure
(a) Sum of DV&A, mental health and substance
misuse prevalences (%) 69.8 67.1 68.0
(b) Prevalence of at least 1 issue (%) 45.9 45.9 45.9 Adjustment for double-counting: (a) divided by (b) 1.52 1.46 1.48
Narrow ‘toxic trio’ measure
(a) Sum of DV&A, mental health and substance
misuse prevalences (%) 23.0 24.5 24.1
(b) Prevalence of at least 1 issue (%) 16.7 19.0 18.2 Adjustment for double-counting: (a) divided by (b) 1.38 1.29 1.32
6.
Conclusions and next steps
This report provides new estimates of the prevalence, at a child level, of the adult-level vulnerabilities that together constitute the so-called ‘toxic trio’. We find that 100,000 children in England (0.9% of all children in England) are in a household where a randomly-selected adult faces all three ‘toxic trio’ issues to a severe extent, while 420,000 children (3.6% of all children in England) are in a household where a randomly-selected adult faces all three ‘toxic trio’ issues to a moderate/severe extent.
The principal limitation of these findings is that they only relate to one adult in the household, and therefore do not capture any issues affecting other adults in the household. We emphasise that this makes the estimates conservative – the ‘true’ household-level prevalence of the ‘toxic trio’ will be higher than has been estimated here. Without data on the self-reports of all adults in the household, there is no empirical basis for quantifying the scale of this bias in our estimates of the actual household-level prevalence. Nevertheless, these estimates are likely to offer the best available evidence on the scale of the ‘toxic trio’ in England.
We further caution that the figures presented in this report are all central estimates derived from a finite-sample survey, and which have an underlying sampling distribution. Different estimates would have been obtained if the APMS had interviewed a different sample of adults. Normally the use of confidence intervals would be a simple way of conveying this uncertainty, however in this analysis it was not possible to produce clustered, bootstrapped or jackknife standard errors that took into account the survey design, because the final child-level dataset contained some strata with only one primary sampling unit (another limitation of attempting to compute child-level prevalences from an adult-level survey design). This methodological shortcoming does nothing to change the fact that there is clearly a statistical margin of uncertainty around all of the estimates presented here.
11 values of the DV&A, substance misuse and mental health indicators for the other household members, based on the information present for the responding household member. A simple imputation process might predict these values based on covariates such as age, ethnicity, gender and socio-economic deprivation. This would essentially assume that the probability of experiencing any of the ‘toxic trio’ issues is independent across household members, conditional on socio-demographic factors. A more sophisticated approach could either model or estimate an assumed intra-household correlation in the risks of being affected by any of the ‘toxic trio’ issues – if a justifiable correlation parameter can be settled on. The resulting estimates of simulated household-level prevalence would be highly sensitive to that assumption.
12
References
ADCS (2016). Safeguarding Pressures Phase 5. Manchester: The Association of Directors of Children’s Services Ltd.
Cleaver, H., Unell, I., and Aldgate, J. (2011). Children’s Needs – Parenting Capacity Child abuse: Parental
mental illness, learning disability, substance misuse, and domestic violence (2nd edition). London: The
Stationery Office.
Guy, J., Feinstein, L., and Griffiths, A. (2014). Early Intervention in Domestic Violence and Abuse. Early Intervention Foundation.
Harold, G., Acquah, D., Sellers, R., and Chowdry, H. (2016). What Works to Enhance Inter-Parental
Relationships and Improve Outcomes for Children. DWP ad hoc research report no. 32. Early Intervention
Foundation.
Hedges, S. and Kenny, C. (2018). Parental Alcohol Misuse and Children. POSTNOTE 570, Feb 2018. London: Parliamentary Office of Science and Technology.
Manning, C. and Gregoire, A. (2009). Effects of parental mental illness on children. Psychiatry, Volume 8, Issue 1, pp. 7-9.
McManus, S., Bebbington, P., Jenkins, R., and Brugha, T. (eds.) (2016). Mental health and wellbeing in
England: Adult Psychiatric Morbidity Survey 2014. Leeds: NHS Digital.
Pryce, R., Buykx, P., Gray, L., Stone, T., Drummond, C., and Brennan, A. (2017). Estimates of Alcohol
Dependence in England based on APMS 2014, including Estimates of Children Living in a Household with an Adult with Alcohol Dependence.
Scott, S. and McManus, S. (2016). Hidden Hurt: Violence, abuse and disadvantage in the lives of women. London: Agenda.
Scott, S., Williams, J., McNaughton Nicholls, C., McManus, S., Brown, A., Harvey, S., Kelly, L., and Lovett, J. (2015). Violence, abuse and mental health in England: Population patterns. Responding Effectively to Violence and Abuse (REVA project) Briefing 1.
Sidebotham, P., Brandon, M., Bailey, S., Belderson, P., Dodsworth, J., Garstang, J., Harrison, E., Retzer, A., and Sorensen, P. (2016). Pathways to harm, pathways to protection: a triennial analysis of serious case reviews,
2011 to 2014. London: Department for Education.
Stanley, N. and Cox, P. (2009). Parental mental health and child welfare: reviews of policy and professional
education. Social Care Institute for Excellence.
13
Appendix A: Additional information on derived measures
DV&A measures
The moderate-severity measure (whether the adult has ever experienced DV&A) is derived from affirmative responses to any of the following survey questions:
(a) Has a partner or ex-partner ever prevented you from having your fair share of the household money?
(b) Has a partner or ex-partner ever pushed you, held or pinned you down or slapped you? (c) Has a current or ex-partner ever kicked you, bit you, or hit you with a fist or something else, or
threw something at you that hurt you?
(d) Has a partner or ex-partner ever repeatedly belittled you to the extent that you felt worthless? (e) Has a partner or ex-partner ever sent you more than one unwanted letter, email, text message
or card that was either obscene or threatening and which caused you fear, alarm or distress? (f) Have you ever been injured (even if only slightly) as a result of the force used on you?
(g) Since the age of 16, has anyone talked you in a sexual way that made you feel uncomfortable?
Only if carried out by current/previous partner
(h) Since the age of 16, has anyone touched you, or got you to touch them, in a sexual way without your consent? Only if carried out by current/previous partner
(i) Since the age of 16, has anyone had sexual intercourse with you without your consent? Only if
carried out by current/previous partner
A positive indication for any of these variables was sufficient. Many of these questions draw upon the Conflict Tactics Scale.10
The high-severity measure (whether the adult has experienced DV&A within the last year) is derived from the same questions, along with responses to follow-up questions indicating that the type of abuse in question had occurred within the last 12 months. Question (f) above was excluded from the high-severity measure as there was no follow-up question about when the injury occurred.
Substance misuse measures
The moderate-severity measure (reported substance misuse) is derived from the following survey variables:
(a) Whether the adult has used any drug in the last year (derived variable)
(b) Whether the adult has a level of drinking that is harmful or dependent, based on an Alcohol Use Disorders Identification Test (AUDIT) score11 of 16 or higher.
A positive indication for either of these variables was sufficient.
The high-severity measure (alcohol or drug dependence) is derived from the following survey variables: (a) Whether the adult has a level of drinking that is dependent, based on an AUDIT score of 20 or
10 See https://en.wikipedia.org/wiki/Conflict_tactics_scale for more information on this scale. 11 See McManus et al. (2016), and
14 higher
(b) Whether the adult is dependent on any drug, derived from questions about the frequency of drug use, sense of need or dependence, inability to abstain, increased tolerance or withdrawal symptoms.12
A positive indication for either of these variables was sufficient.
Mental ill-health measures
The moderate-severity measure (moderate or higher symptoms of mental ill-health) is derived from the following survey variables:
(a) Whether the adult has moderate or higher symptoms of Common Mental Disorders (CMD),13 such an anxiety or depression, based on a Clinical Interview Schedule – Revised (CIS-R) score of 12 or higher
(b) Whether the adult meets at least one of the two Post-Traumatic Stress Disorder (PTSD) screening criteria in McManus et al. (2016)
(c) Whether the adult screened positive for probable psychotic disorder (derived variable) (d) Whether the adult screened positive for a general personality disorder, based on a
Standardised Assessment of Personality: Abbreviated Scale (SAPAS) score of 4 or higher (e) Whether the adult met one of the first of three bipolar disorder assessment criteria in
McManus et al. (2016) – scoring 7 or higher on the Mood Disorder Questionnaire (MDQ) (f) Whether the adult had thought about suicide in the last year (derived variable)
(g) Whether the adult has ever self-harmed
A positive indication for any of these variables was sufficient.
The high-severity measure (severe symptoms of mental ill-health) is derived from the following survey variables:
(a) Whether the adult has severe symptoms of CMD, based on a CIS-R score of 18 or higher (b) Whether the adult meets both of the PTSD screening criteria in McManus et al. (2016) (c) Whether the adult screened positive for psychotic disorder in the last year (derived variable) (d) Whether the adult screened positive for antisocial or borderline personality disorder based on
the Structured Clinical Interview for DSM-IV Personality Disorders (SCID-II)
(e) Whether the adult met all three bipolar disorder assessment criteria in McManus et al. (2016) (f) Whether the adult had attempted suicide in the last year (derived variable)
(g) Whether the adult has self-harmed in the last year A positive indication for any of these variables was sufficient.
12See McManus et al. (2016) for more information.
13 See
15
Appendix B: Additional results
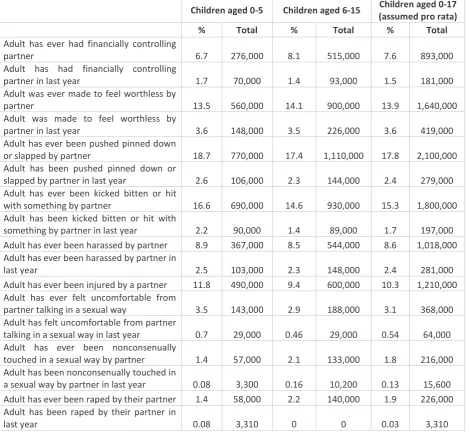
[image:16.595.59.531.148.587.2]Prevalence estimates for the individual variables used for each indicator
Table A1. Estimated child-level prevalence in England of variables used for DV&A indicator
Children aged 0-5 Children aged 6-15 Children aged 0-17 (assumed pro rata) % Total % Total % Total
Adult has ever had financially controlling
partner 6.7 276,000 8.1 515,000 7.6 893,000
Adult has had financially controlling
partner in last year 1.7 70,000 1.4 93,000 1.5 181,000 Adult was ever made to feel worthless by
partner 13.5 560,000 14.1 900,000 13.9 1,640,000
Adult was made to feel worthless by
partner in last year 3.6 148,000 3.5 226,000 3.6 419,000 Adult has ever been pushed pinned down
or slapped by partner 18.7 770,000 17.4 1,110,000 17.8 2,100,000 Adult has been pushed pinned down or
slapped by partner in last year 2.6 106,000 2.3 144,000 2.4 279,000 Adult has ever been kicked bitten or hit
with something by partner 16.6 690,000 14.6 930,000 15.3 1,800,000 Adult has been kicked bitten or hit with
something by partner in last year 2.2 90,000 1.4 89,000 1.7 197,000 Adult has ever been harassed by partner 8.9 367,000 8.5 544,000 8.6 1,018,000 Adult has ever been harassed by partner in
last year 2.5 103,000 2.3 148,000 2.4 281,000
Adult has ever been injured by a partner 11.8 490,000 9.4 600,000 10.3 1,210,000 Adult has ever felt uncomfortable from
partner talking in a sexual way 3.5 143,000 2.9 188,000 3.1 368,000 Adult has felt uncomfortable from partner
talking in a sexual way in last year 0.7 29,000 0.46 29,000 0.54 64,000 Adult has ever been nonconsenually
touched in a sexual way by partner 1.4 57,000 2.1 133,000 1.8 216,000 Adult has been nonconsenually touched in
a sexual way by partner in last year 0.08 3,300 0.16 10,200 0.13 15,600 Adult has ever been raped by their partner 1.4 58,000 2.2 140,000 1.9 226,000 Adult has been raped by their partner in
last year 0.08 3,310 0 0 0.03 3,310
Table A2. Estimated child-level prevalence in England of variables used for substance misuse indicator
Children aged 0-5 Children aged 6-15 Children aged 0-17 (assumed pro rata) % Total % Total % Total
[image:16.595.60.526.627.726.2]16
Table A3. Estimated child-level prevalence in England of variables used for mental ill-health indicator
Children aged 0-5 Children aged 6-15 Children aged 0-17 (assumed pro rata) % Total % Total % Total
Adult shows moderate or higher symptoms
of CMD 16.1 660,000 18.1 1,160,000 17.4 2,050,000
Adult shows severe symptoms of CMD 7.3 303,000 9.7 621,000 8.9 1,046,000 Adult has potential for positive PTSD
screen 7.7 320,000 9.1 582,000 8.6 1,017,000
Adult has positive PTSD screen 4.9 203,000 5.7 367,000 5.5 643,000 Adult has probable psychotic disorder 0.9 38,000 0.8 53,000 0.9 102,000 Adult had psychotic disorder in last year 0.42 17,200 0.13 8,400 0.23 27,300 Adult has any general personality disorder 15.7 650,000 13.7 880,000 14.4 1,700,000 Adult has antisocial/borderline personality
disorder 5.00 206,000 4.5 286,000 4.7 549,000
Adult has potential for positive bipolar
screen 8.5 351,000 9.6 616,000 9.2 1,088,000
Adult has positive bipolar screen 1.6 68,000 1.7 110,000 1.7 199,000 Adult has thought about suicide in last year 3.8 156,000 5 323,000 4.6 542,000 Adult has attempted suicide in last year 0.75 31,000 1.2 77,000 1.04 123,000 Adult has ever self-harmed 9.4 390,000 7.7 491,000 8.3 977,000 Adult has self-harmed in last year 1.4 56,000 1.5 96,000 1.5 171,000
[image:17.595.61.530.426.562.2]Prevalence estimates for the ‘toxic trio’ combined with low income
Table A4. Estimated child-level prevalence in England of ‘toxic trio’ (broad measure) alongside low income Children aged 0-5 Children aged 6-15 Children aged 0-17
(assumed pro rata) % Total % Total % Total
Adult has all 3 ‘toxic trio’ issues + low
income 1.5 63,000 0.99 64,000 1.2 139,000
Adult has at least 1 ‘toxic trio’ issue + low
income 12.7 520,000 13.1 840,000 13 1,530,000
Adult has 2 ‘toxic trio’ issues + low income 5.2 215,000 4.7 300,000 4.9 573,000 Adult has any 2 of these 4 combined issues 17.7 730,000 18.7 1,200,000 18.3 2,160,000 Adult has any 3 of these 4 combined issues 8.6 354,000 6.9 440,000 7.5 881,000
Table A5. Estimated child-level prevalence in England of ‘toxic trio’ (narrow measure) alongside low income Children aged 0-5 Children aged 6-15 Children aged 0-17
(assumed pro rata) % Total % Total % Total
Adult has all 3 ‘toxic trio’ issues + low
income 0.8 32,200 0.2 14,300 0.4 49,400
Adult has at least 1 ‘toxic trio’ issue + low
income 6.5 267,000 5.9 377,000 6.1 718,000
[image:17.595.57.531.603.738.2]17
Children’s Commissioner for England
Sanctuary Buildings 20 Great Smith Street London
SW1P 3BT
Tel: 020 7783 8330
Email: [email protected] Visit: www.childrenscommissioner.gov.uk