Research Report DFE-RR082
Evaluation of the
generations
together
programme –
learning so far
Kathryn Crowther and Kerry Merrill
This research report was commissioned before the new UK Government took office on 11 May 2010. As a result the content may not reflect current Government policy
and may make reference to the Department for Children, Schools and Families (DCSF) which has now been replaced by the Department for Education (DFE).
CONTENTS
Page
EXECUTIVE SUMMARY i
1 INTRODUCTION ... 1
2 RECORD OF GENERATIONS TOGETHER DELIVERY ... 6
3 DESIGN, SET-UP AND DELIVERY OF PROJECT ACTIVITY... 33
4 DELIVERY, EFFECTIVE PRACTICE AND ISSUES... 52
5 OUTCOMES AND IMPACTS ... 71
6 CONCLUSIONS AND AREAS FOR DEVELOPMENT ... 83
ANNEXES
ANNEX A: METHOD AND STUDY ISSUES ANNEX B: LA PROJECT DESCRIPTIONS
EXECUTIVE SUMMARY
Introduction
1. This report presents the findings from the evaluation of the Generations Together Demonstrator programme. This study was undertaken by York Consulting LLP on behalf of the then Department for Children, Schools and Families (DCSF); this is now the Department for Education (DfE).
2. The evaluation was due to finish in March 2011. However, due to budgetary constraints within the Department for Education the evaluation was brought to a close in September 2010. This report draws on all evaluation activity that was completed to that point.
3. The overarching aims of the evaluation were to:
• undertake a robust assessment of the effectiveness of intergenerational practice in improving individual’s attitudes and behaviours towards other generations;
• provide a greater understanding of the key challenges and critical success factors for the effective implementation and delivery of intergenerational practice, particularly in terms of partnership working;
• undertake a cost effectiveness assessment of each of the projects.
4. It should be noted that the early closure of the evaluation has affected the extent to which it was possible to meet these aims.
Context
5. In July 2009, the Department for Education (formerly the DCSF), the Department of Health (DoH), the Department for Communities and Local Government (DCLG), Department for Work and Pensions (DWP) and the Office of Civil Society (OCS) launched ‘Generations Together’ demonstrator projects of intergenerational practice across 12 local authorities in England.
6. The purpose of the Generations Together programme across the 12 local authorities was to:
• generate wider interest in and thinking about intergenerational work;
• increase the number of volunteers working on intergenerational activity by 20,000 by the end of the programme;
• encourage a more strategic and sustainable approach to undertaking intergenerational work;
• provide robust evidence of the effectiveness of intergenerational initiatives; and
7. For local authorities that were shortlisted for Generations Together funding, but were not successful, further support was provided by the Beth Johnson Foundation1 in encouraging these areas to develop effective intergenerational projects.
Methodology
8. The evaluation was conducted in four stages which have informed this report:
• Management Information data collection and analysis: output and outcome data on volunteers and recipients is collected by each LA through an online management information tool;
• Consultations with all 12 Generations Together local authorities: undertaken between October 2009 and January 2010 to gather views on programme design, implementation and progress;
• Baseline and follow-up telephone surveys of volunteers and recipients: gathering volunteers and recipients perceptions and attitudes across a number of areas including local community, anti-social behaviour and generational views; and
• In-depth case studies: visits to six local authority areas focusing on three projects in each, including consultations with strategic, operational and delivery stakeholders.
Record of Generations Together Delivery
9. Nationally, the programme was aiming to involve a total of 24,263 volunteers and recipients across the 12 local authorities (based on a total of actual targets provided by LAs via the online management information (MI) tool). It was anticipated that 11,335 of these would be volunteers and 12,928 would be recipients. The definition of volunteers, recipients and wider participants provided to local authorities was:
• Volunteers: A volunteer is an individual who undertakes any activity that will benefit others and gives their time freely. Examples might include an older person volunteering at a sports club on a project for young people, a younger person volunteering to teach dance to older people and/ or older people organising an event together, which benefits either the other party or the wider community;
• Recipients: A recipient is an individual who will benefit from the knowledge/skills imparted to them by a volunteer through active engagement. For example, if a young person is supporting an older person in developing their IT skills the older person would be classed as a ‘recipient’. A recipient could be described in simple terms as on the ‘receiving’ end of a volunteer relationship;
• Wider participants: These are individuals who may attend an event, concert or other type of Generations Together activity, which volunteers/recipients have been responsible for organising e.g. a local arts exhibition, community event. They are not directly involved in the volunteer-recipient relationship but are a wider beneficiary of the Generations Together activities.
been more challenging, with less than a third of the cumulative target (32%; n= 2,791) for recipients having been met.
11. To date, LAs have been successful in engaging 8,743 wider participants in Generations Together activities. These individuals are typically audiences or participants at events.
Description of Intergenerational Activity
12. Projects were most likely to have an education and learning theme2 (50%; n= 119). Other common themes included health and well-being (27%; n=64) and community and democracy3 (25%; n=60). The least common project theme was sport and leisure (applicable to 42 projects).
13. The data on the MI tool suggests that projects were most commonly reported to last between 13-18 months (33%; n=51) and nearly a quarter of projects were reported to last over a year (23%; n=54).
14. In contrast, the intensity of volunteers and recipients involvement is generally low. The total hours of involvement was most commonly between 4-8 hours (n=26, 29%) and for a third of projects involvement was 3.5 hours or less (n=30). This may be a result of LAs using the first 6-12 months of the programme to gain “quick wins” and it is possible that the profile will change over the next six months.
Profile of Volunteers and Recipients
15. The majority of volunteers and recipients were involved in one project (95%; n=9,087), with 5% (n=432) involved in two projects. There were 77 volunteers and recipients who were involved in three or more projects.
16. There are a greater number of females (61%) and younger people (56%) taking part in Generations Together activities. Additionally, for the participants for whom information was available, over four-fifths were of White ethnicity.
17. A key focus for Generations Together was to engage individuals who had not volunteered previously. According to the MI tool, the Generations Together projects have been successful at engaging at least 2,613 new volunteers into volunteering opportunities; 37% of the total number of volunteers that had been engaged in Generations Together activity to date.
2
This relates to the 237 projects that have been set-up on the online Management Information tool. It should be noted that there may be other projects that areas will be delivering for which details have not yet been entered on the MI tool.
3
Perceptions and Attitudes of Participants (Baseline)
18. The perceptions and views of older and younger people about their local area were generally positive at the start of their involvement in Generations Together:
• both older and younger people reported high levels of satisfaction with their area as a place to live;
• the majority of older and younger people reported feeling safe in their local area during the day (94% of younger and 99% of older people); although feelings of safety at night were lower for both generations (69% of younger and 65% of older people).
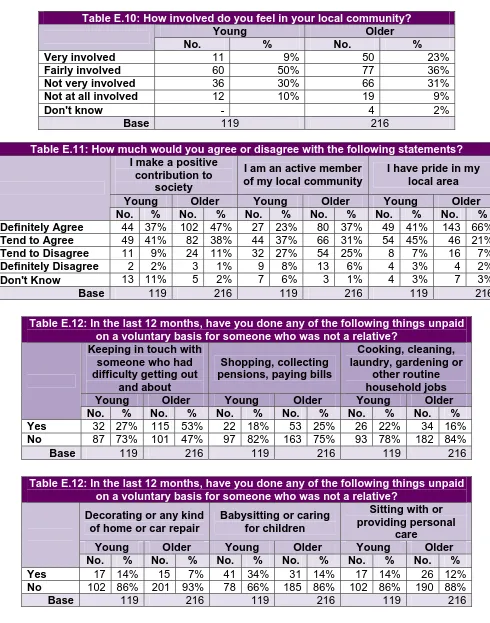
19. Perceptions of involvement in the local community were generally positive. Nearly three-fifths of both older and younger people reported feeling at least ‘fairly’ involved in their local community. Older people were more likely to report that they make a positive contribution to society and are active members of the community, compared to younger people.
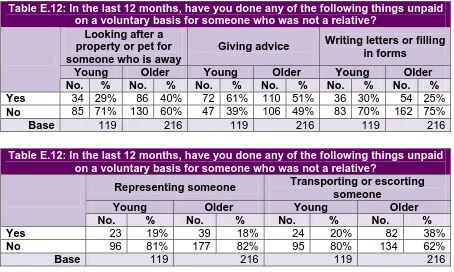
20. Engagement in informal volunteering was generally low across the survey sample. However, a reasonable proportion of both young people (61%) and older people (51) reported that they had given advice. Also, over half (53%) of older people had kept in touch with someone who had difficulty getting out.
21. Engagement in formal volunteering was fairly low, with respondents most likely to indicate that they had raised funds for charity (57% of younger and 52% of older people).
22. Young people were generally positive in their views of older people; with nearly three-quarters (72%) reporting that they felt older people have respect for young people, compared to nearly three-fifths (59%) of respondents to the omnibus survey. Almost three-quarters (72%) of young people reported that the views of older people are not listened to enough.
23. Older people were more mixed in their views of younger people, but were still generally positive. Similarly, the views of the survey respondents appeared to be more positive than the omnibus survey respondents. Over half (53%) agreed that the behaviour of young people today is no worse than it was in the past and almost three-quarters agreed that most young people are responsible and well behaved (72%). However, nearly three-fifths (57%) did not feel that older people are admired and respected by young people, compared to just over three-fifths (61%) of survey respondents.
25. Younger people’s expectations for the Generations Together programme were higher than older people’s. Over nine-tenths (91%) of young people hoped that involvement would provide them with the opportunity to get involved in community/social activities, compared to four-fifths (79%) of older people.
26. Other benefits that respondents hoped to gain included involvement in positive activities (82% of older people and 91% of younger people); supporting others’ skills (79% of older people and 85% of younger people); personal development skills (64% of older people and 86% of younger people) and practical skills (72% of older people and 87% of younger people).
Local Authority Models of Delivery
27. The design of the Generations Together programme across the 12 LAs was varied, as a result of differing local and strategic priorities. For example, key strategic drivers at a local level included aligning Generations Together activity to local strategic priorities (e.g. community cohesion, increasing volunteering opportunities) and/or a commitment to developing and embedding intergenerational practice locally.
28. In the majority of LAs, Generations Together has been designed as a LA-wide programme (eight), rather than targeting specific geographical areas or neighbourhoods. Although this is not to say that individual projects may not be focusing on particular localities or target groups.
29. The strategic and operational factors affecting model design, include:
• differences in strategic buy-in and perceived potential for the programme to contribute to strategies, local issues or priorities;
• a strategic commitment to developing and embedding intergenerational practice locally or innovating in intergenerational practice;
• clarity of vision, or the availability of any existing operational method/structures that could easily be used for programme delivery;
• perceived benefits of a grassroots led programme; • keeness to build on existing activity and networks; and • interest in establishing a particular delivery theme.
Partnership Structure and Governance
30. Management and co-ordination of the programme was either LA led or Civil Society (CSO) led. Management or co-ordination of the programme was led by the LA in seven of the twelve areas. In the remaining five LAs, management had been devolved to one or more CSO.
31. Governance arrangements were generally underpinned by the formation of steering groups to oversee programme delivery. These varied in terms of the stakeholders involved and their size and remit. However, they predominately included stakeholders from the LA and the CSOs, with at least representation from departments within Children’s and Adult services.
32. Some steering groups had a strategic focus to drive and share learning about intergenerational practice, whereas others were operationally focused on monitoring overall programme and project progress.
involvement was generally linked to how involved services were in project delivery and who was driving the programme at a local level. For example, in one case-study LA, one of the projects was led by Adult services and therefore they were automatically involved in the steering group for the programme. Where the programme was primarily Adult or Children’s services driven, there was often less involvement from the other service.
34. The recruitment of volunteers and recipients had predominately been led at a project level. Evidence of areas establishing programme-level approaches to recruitment, i.e. the lead organisation taking an overall approach to recruitment, was more limited.
35. Local approaches to the evaluation and monitoring of Generations Together activity have been diverse. Some areas have consistent formal monitoring processes to measure progress against targets, including regular meetings and the completion of quarterly monitoring forms. Other areas were using more informal and ad-hoc approaches.
36. The establishment of programme-level approaches to evaluation were evident in some areas, although in most others responsibility lay with individual projects. The use of pre-and post- questionnaires to measure impact were evident in a number of areas, in addition to the use of more qualitative or creative approaches to the collection of outcomes data.
Project Set-up and Design
37. The process for identification and development of individual Generations Together projects varied across areas. Some areas had clearly defined projects on submitting their bids, whilst others had identified broad themes of activity which were then further scoped and refined in the first months of the programme.
38. A formal commissioning process had been employed in some areas providing the opportunity for LAs to identify projects on the basis of their potential effectiveness. For LAs that had not employed a formal commissioning process, agreeing project activity generally involved LAs bringing together a range of statutory and voluntary organisations to agree and scope out the activities that would be delivered.
39. Common considerations and rationale in the design of project activity included the opportunity to build on, develop or extend existing provision; the opportunity to test innovative and new delivery approaches and allowing Generations Together activity to be aligned with existing organisational priorities.
41. Evidence of LAs and delivery partners building on known success factors and challenges associated with intergenerational activity were minimal, with projects generally provided with the autonomy to develop an intergenerational approach which they felt suited their context and delivery focus.
42. Multiple strategies were employed by projects to recruit volunteers and recipients. Commonly used strategies included:
• using existing and new links with networks and organisations to support recruitment;
• use of schools, extended services and other public sector services as referral routes;
• drawing on existing volunteer bases;
• universal marketing and promotional approaches.
43. The expertise of projects often lay with a particular age group (i.e. younger or older people), presenting some challenges in engaging the other generation.
44. Projects were predominately focused on utilising existing staff. Funding constraints, and the short term nature of some projects, meant that it was not always feasible to recruit new staff to support delivery. Staff’s experience of managing similar projects; existing knowledge and experience of the lead project organisation; previous experience of working with a similar client group and specific skills and expertise were all considered to be important.
45. Preparation support and training was most commonly provided to volunteers, either directly by projects, or through linking into wider LA training opportunities. Training was generally focused on ensuring that volunteers were equipped to work with specific volunteer/recipient groups or were supported in developing skills that would support their project role.
Effective Practice and Learning: Programme Level
46. Model design: The benefits reported by areas that had established a LA-led model were related to their ability to draw on existing wider knowledge and partnership links to support programme management and delivery. However, providing sufficient staff capacity at a LA level to manage Generations Together activity was a key challenge for areas. This was critical in ensuring that the programme remained high on the LA agenda and ensuring that it was being effectively driven at a LA level.
47. The key benefits of the CSO led model were local knowledge and existing networks with other CSOs, which were perceived to enhance the scope and reach of delivery. This supported the development of grassroots provision and provided the opportunity to engage smaller CSOs, with the expertise to engage individuals and groups that may be considered harder to reach.
49. Building an Understanding of Intergenerational Practice: Evidence that LAs had started to build an understanding of effective intergenerational practice was limited. The significant focus on delivery and progress had limited the capacity of areas to consider more widely the potential effectiveness of intergenerational activity in terms of successes, challenges and the implications for future intergenerational activity.
50. Programme Management: The development of clear governance and reporting structures were vital in supporting the overall management of the programme. The establishment of proactive steering groups and additional governance structures including project boards and working groups provided momentum to the programme. Regular meetings; the engagement of the right stakeholders and ensuring there was a clear remit and lines of accountability were found to be particularly effective.
51. Engagement of Adults and Children’s Services: Securing the strategic commitment of both Adult and Children’s Services in Generations Together has been challenging for areas, with involvement generally being piecemeal or project related. Although in some areas Generations Together has encouraged partnership working between the two services, more strategic consideration of how the two services can contribute to the vision and delivery of activity is required.
52. Staff Capacity: Providing dedicated and adequate resource to manage the programme supports effective operational delivery and ensures that delivery is focused on the overarching aims of the programme. Where this was not evident, it was challenging for areas to provide an appropriate level of accountability, particularly in terms of monitoring progress against targets; understanding the effectiveness of project delivery; using learning to inform ongoing practice; consideration of sustainability and developing robust evaluation and monitoring processes.
Effective Practice and Learning: Project Level
53. Effective operational planning: Involving projects in the design of the programme suggests that they are clear on how their individual project activity contributes to the intended LA and national aims of the programme.
54. Extending existing practice or projects has allowed organisations to use established referral mechanisms and links with organisations and services to support delivery. However, adopting this approach is challenging for some to sufficiently change or adapt activity to work within the remit of Generations Together. Projects sometimes struggled to incorporate the intergenerational aspect fully within delivery.
55. Project Design: Delivery was felt to be particularly effective where projects had: • planned activities directly to meet specific outcomes;
• adapted the intensity of project delivery to suit participants, whilst ensuring this did not dilute the outcomes;
• understood the importance of evaluation and had integrated this into delivery; • recognised and embraced the need to be flexible in delivery and adapt to
ongoing learning.
57. Staff capacity and skills: Staff were generally enthusiastic and committed to developing intergenerational practice. However, some projects were affected by staff turnover, which impacted on their momentum.
58. Volunteer recruitment: This was found to be particularly efficient and effective where projects had used existing structures to recruit volunteers, and where projects linked into existing activity.
59. However, there has not always been sufficient consideration of how to target the types of volunteers and recipients that projects are aiming to engage, which has meant that projects are not necessarily engaging those who would most benefit from involvement in intergenerational activity.
60. Support and Training: Effective practice arising from case studies includes the development of training packs and more informal support that was provided by project deliverers.
Outcomes and Impacts
61. We provide examples of the types of benefits and outcomes that have been achieved by LAs, organisations and individuals. However, we are unable to reliably quantify the benefits and outcomes to date, or indicate current or likely impact at a local or national level at the time of this report. Due to the early closure of the evaluation, data sources are not yet comprehensive or robust enough for detailed analysis. Minimal survey responses, LA delivery progress and reliability issues with the outcomes data on the MI tool are all key limitations in being able to evidence outcomes and impact at this time.
Benefits and Outcomes for Local Authorities
62. The key benefits and outcomes for LAs relate primarily to strengthening external and internal relationships which has built their capacity for future partnership working.
Benefits and Outcomes for Partner Organisations
63. The key organisational benefits reported by partner organisations were: • enabling organisational goals/plans to be furthered;
Benefits and Outcomes to Participants
64. As a result of involvement in Generations Together, participants report a range of improvements in their:
• personal development – including increased self esteem, ability to make a positive contribution to their community and improved personal development skills;
• practical skills – individuals have learnt a range of skills including mentoring, cooking, dance, presentation and work related skills;
• attitudes/behaviour – including improved understanding, perception and engagement with other generations, greater satisfaction with home and neighbourhood and developing healthier lifestyles. A very small number of individuals reported reductions in fear of crime and risky behaviour.
Wider Impact
65. It is clear that Generations Together had been beneficial and achieved outcomes at a number of levels. However, it is less clear how these outcomes come together to create significant impact across areas and communities.
66. For the majority of areas, it was too early to report on whether Generations Together activity would have a significant impact on wider policy outcomes. Indeed some of the barriers and issues raised in this report would suggest that in some cases the activities are not of a large enough scale, coherently linked together or focused strongly enough to have a considerable impact at a national level.
Areas for Development
67. We present below some suggested areas for development and key learning based on the evaluation findings to date. These should be considered for the remainder of the Generations Together programme and in the development of future similar initiatives.
68. At LA and project level, the following are key areas for development:
• consideration of how the outcomes of Generations Together activity will be evidenced at LA and project level, through the development of more robust evaluation methods;
• focus on capturing learning from Generations Together projects to inform the development of future intergenerational practice;
• strengthening of recruitment and targeting approaches for volunteers/recipients to engage those who would most benefit from intergenerational activity;
• ensure there remains a strong focus on the intergenerational aspect of delivery and that projects have considered how they are best delivering meaningful intergenerational activity, with a focus on maximising outcomes for participants.
1 INTRODUCTION
1.1 This report presents the findings from the evaluation of the Generations Together Demonstrator programme. This study was undertaken by York Consulting LLP on behalf of the then Department for Children, Schools and Families (DCSF); this is now the Department for Education (DfE).
1.2 The overarching aims of the evaluation were to:
• undertake a robust assessment of the effectiveness of intergenerational practice in improving individual’s attitudes and behaviours towards other generations;
• provide a greater understanding of the key challenges and critical success factors for the effective implementation and delivery of intergenerational practice, particularly in terms of partnership working;
• undertake a cost effectiveness assessment of each of the projects.
1.3 The evaluation was due to be completed in March 2011. Due to budgetary constraints within the Department for Education, the evaluation was brought to a close in September 2010. This report draws on all evaluation activity that was completed to this point.
Context
1.4 In July 2009, the Department for Education (formerly the DCSF), the Department for Health (DH), Department for Communities and Local Government (DCLG), Department for Work and Pensions (DWP) and Office of Civil Society (OCS) launched ‘Generations Together’ demonstrator projects of intergenerational practice across 12 Local Authorities (LAs) in England.
1.5 The purpose of the Generations Together programme across the 12 local authorities was to:
• generate wider interest in, and thinking about, intergenerational work;
• increase the number of volunteers working on intergenerational activity by 20,000 by the end of the programme;
• encourage a more strategic and sustainable approach to undertaking intergenerational work;
• provide robust evidence of the effectiveness of intergenerational initiatives; and
1.6 For local authorities that were shortlisted for Generations Together funding, but were not successful, further support was provided by the Beth Johnson Foundation4 in encouraging the development of effective intergenerational projects.
Methodology
1.7 The research was designed as a multi-method approach in order to capture both quantitative and qualitative data on the implementation, effectiveness and impact of the Generations Together demonstrator programmes. The full methodology is set out in Annex A: Method and Study Issues and comprised:
• Management Information Data Collection and Analysis – output and outcome data is collected by each demonstrator site through an online management information (MI) tool;
• Consultations with all 12 local authorities – to gather views on programme design, implementation and progress;
• Baseline and Follow-up Telephone Surveys – gathering volunteers’ and recipients’ perceptions and attitudes across a number of areas, including local community, anti-social behaviour and generational views; and
• In-depth case-studies – in six demonstrator LAs, involving visits to three projects in each area and consultations with strategic, operational and delivery stakeholders.
Management Information Data Collection and Analysis
1.8 An online Management Information (MI) tool was specifically designed and established as part of the evaluation, to provide a consistent way of collating programme information across the 12 LAs delivering Generations Together. As a project management tool, it was intended to streamline reporting arrangements between local projects, Local Authorities (LAs), York Consulting LLP (YCL) and the Department for Education (DfE).
1.9 Access to the MI tool was provided to the Generations Together leads in LAs, and local Generations Together projects. The MI tool collected data at the following levels:
• Local authority level: overarching local authority outputs and outcomes; progress reports and practice sharing site;
• Project level: delivery characteristics of projects and anticipated outcomes, for example description of project, key activity, number and length of project sessions, target number of volunteers and recipients; and
• Individual level: characteristics of volunteers and recipients involved in Generations Together projects including gender, age, ethnicity, disability, care status.
1.10 The MI tool was the key mechanism for the Department for Education in monitoring the progress of the programme across LAs and it was mandatory that all areas completed the tool.
Consultations with all Generations Together Local Authorities
1.11 Consultations were undertaken with all 12 LAs between October 2009 and January 2010. A range of programme-level and project-level stakeholders were consulted by telephone to explore their progress in implementing Generations Together. Key themes that were explored with each LA included:
• programme design and rationale;
• focus of activity;
• intended outcomes;
• recruitment and targeting approaches;
• evaluation and monitoring mechanisms.
Baseline and Follow-up Telephone Survey
1.12 A baseline and follow-up survey was conducted with volunteers and recipients across the 12 areas. The MI tool was used to collect the contact details of all volunteers and recipients who had provided their consent to participate in the survey. Baseline surveys were completed with individuals prior to, or on starting, their involvement in a Generations Together project. Individuals were then contacted approximately one month after they had finished their involvement to complete a follow-up survey. A copy of the surveys used can be found in Annex D.
1.13 The survey covered the following key areas:
• perceptions of local community e.g. perceptions of anti-social behaviour, feelings of safety, satisfaction with local neighbourhood;
• involvement in local community e.g. volunteering, sporting or creative activities;
• attitudes towards generations;
• quality of life (older people);
• expected and actual benefits to volunteers/recipients from involvement in Generations Together.
1.14 Similar questions were included in both the baseline and follow-up surveys to allow changes in attitudes and perceptions to be captured.
1.15 In total, 335 baseline surveys and 58 follow-up surveys were completed. The response rate for the baseline survey was on average 36% (39% older people and 31% younger people). The response rate for the follow-up survey on average was 31% (33% older people and 28% younger people). There were a number of methodological challenges in undertaking the survey, which are detailed in Annex A: Method and Study Issues.
In-depth Case-Studies
1.17 Detailed fieldwork was undertaken across six case study authorities. In each area three Generations Together projects were visited.
1.18 The case-study authorities were selected to reflect the variation in delivery models established nationally. The geographical spread of the six areas involved included one London Borough and one LA in the South East, the North-East, the North-West, East Midlands and the West Midlands.
1.19 The selection of the three projects in each area specifically took into account the type and focus of Generations Together activity that was been delivered and the stage of delivery reached by projects. A range of projects were selected for involvement in the case studies. These included mentoring projects, skill-sharing projects and education-focused projects.
1.20 The stakeholders consulted with in each case-study area included:
• LA and programme level stakeholders e.g. overall programme manager, steering group representatives;
• Project level stakeholders – project managers, strategic leads and other staff involved in delivery e.g. school staff;
• volunteers and recipients.
1.21 On average, five programme level stakeholders and five project level stakeholders were involved in each of the six case-study authorities. In total, 44 volunteers and seven recipients were consulted.
1.22 The analysis involved detailed assessments for each of the six case-study areas triangulating findings across programme, project and volunteer/recipient consultations.
Issues Influencing the Research
1.23 A number of issues influencing the direction and delivery of the research should be taken into consideration when interpreting the findings (see Annex A: Method and Study Issues for further information).
1.24 The early completion of the evaluation has limited our ability to present evidence against all the intended aims of the evaluation. In particular, this has limited the data and evidence that was available at a local level on the benefits, outcome and impact of Generations Together activity.
Progress of Demonstrator Areas and Projects
Engagement of Volunteers and Recipients in the Evaluation
1.26 The engagement of volunteers and recipients in the evaluation was challenging. Although the case-study fieldwork was delayed in some areas to align with project delivery, due to difficulties with recruitment in some projects, access to volunteers and recipients was often limited.
1.27 The research team used various strategies for engagement, in particular adopting a flexible approach to consultations. Utilising existing project activity for undertaking consultations with volunteers and recipients was found to be particularly successful.
1.28 If the evaluation had continued, it was anticipated that a much greater number of volunteers and recipients would have been available for involvement in the evaluation during the second case-study visits. These were due to be conducted in November 2010.
Completeness and of the Management Information Tool
1.29 Although, completion of the management information tool was mandatory for local authorities, the effectiveness of completing this tool varied considerably across areas. There were particular challenges in projects obtaining consent for participation in the survey through the MI tool.
2
RECORD OF GENERATIONS TOGETHER DELIVERY
2.1 This section provides an overview of the delivery activity across the 12 Generations Together LAs. It presents the type of intergenerational activity that has been delivered across areas and also the profile of volunteers and recipients that have been involved in delivery. LA and project delivery progress to date is also discussed.
2.2 This information is predominately taken from data that has been collected on the MI tool since its launch in November 2009. Data from the baseline telephone survey and obtained through the case-studies is also used where appropriate.
Record of Delivery – Data Constraints
2.3 The MI data used in this section is accurate to the end of Quarter 2 (July-September 2010) and therefore provides a ‘snap shot’ of Generations Together activity and progress as of this date. As outlined in Annex A, there have been some issues with the quality of the MI data which should be considered in the interpretation of the data presented. In particular, although LAs had been encouraged to add participants to the MI tool in ‘real time’, this did not always happen in practice. It is therefore likely that there will be participants who have taken part in Generations Together activity but whose details have not been uploaded onto the MI tool.
Progress to Date
2.4 The MI tool is used by LAs to evidence progress against overall delivery targets. The MI tool allows Generations Together projects to upload details of the number and characteristics of volunteers and recipients that are involved in activity. We provide an overview of the number of volunteers and recipients that have participated in Generations Together activities up to 30th September 2010. This data represents one year of Generations Together activity, including the initial planning and commissioning of delivery partners. The definition of volunteers, recipients and wider participants that was circulated to local authorities was:
• Volunteers: A volunteer is an individual who undertakes any activity that will benefit others and gives their time freely. Examples might include an older person volunteering at a sports club on a project for young people, a younger person volunteering to teach dance to older people and/ or older people organising an event together, which benefits either the other party or the wider community;
• Recipients: A recipient is an individual who will benefit from the knowledge/skills imparted to them by a volunteer through active engagement. For example, if a young person is supporting an older person in developing their IT skills the older person would be classed as a ‘recipient’. A recipient could be described in simple terms as on the ‘receiving’ end of a volunteer relationship;
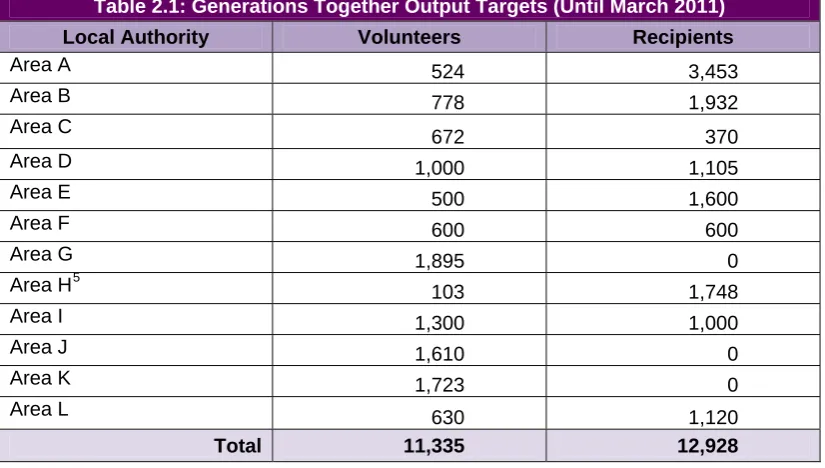
2.5 Table 2.1 provides an overview of the target numbers of volunteers and recipients for each LA. It was intended that the Generations Together programme nationally would involve a total of 24,263 participants. Of these, it was anticipated that 11,335 would be volunteers and 12,928 would be recipients.
Table 2.1: Generations Together Output Targets (Until March 2011)
Local Authority Volunteers Recipients
Area A 524 3,453
Area B 778 1,932
Area C
672 370
Area D 1,000 1,105
Area E 500 1,600
Area F 600 600
Area G 1,895 0
Area H5 103 1,748
Area I 1,300 1,000
Area J 1,610 0
Area K 1,723 0
Area L 630 1,120
Total 11,335 12,928
2.6 The targets set for volunteers and recipients across LAs were extremely diverse. The main focus in three LAs was on the recruitment of volunteers (Areas G,K and J), with there being no specific target set in these areas for the recruitment of recipients. In other areas there was a more even split between the targets set for volunteers and recipients.
2.7 Table 2.2 provides an overview of how LAs were progressing against their cumulative target for the end of Quarter 2 2010 (July-September 2010).
2.8 Local authorities are progressing well with the recruitment of volunteers, with 94% of the cumulative target having been met. At LA level there are five areas that have exceeded their cumulative volunteer target (to the end of September), by between 3% and 98%. However, volunteer recruitment has been less successful in other LAs, for example:
• two LAs had achieved between 75-99% of their cumulative volunteer target (Areas C and K);
• three LAs had achieved between 45-74% of their cumulative volunteer target (Areas B, H and L); and
• two LAs had achieved less than 30% of their cumulative volunteer target (Areas A and D).
2.9 Progress in recruiting recipients has been more challenging for LAs, with less than a third (32%) of the cumulative national target for recipients having currently been met. Only two areas (Areas F and C) had exceeded or were on target to achieve the required recipient numbers. The remaining seven LAs, who had recipient targets, had achieved less than 40% of their cumulative target; with four of these LAs having achieved less than 20% of their cumulative recipient target.
Table 2.2: Progress Against Targets
Target for Entire Programme
Cumulative Target (to end of Sept 10)
Progress Against cumulative Target (to end of Sept 10)
Number of Volunteers
and Recipients involved in more than one project
Number of Wider Participants
Volunteers Recipients Volunteers Recipients Volunteers Recipients
No details given (excluded from
progress) LA
% Nos % Nos Nos Nos Nos
Area A 524 3453 371 2,520 19% 71 16% 406 97 25 1533
Area B 778 1932 507 1,292 46% 233 23% 296 2 167 937
Area C 672 370 402 210 85% 340 194% 408 2 20 3143
Area D6 1000 1105 700 935 27% 192 0% 4 0 88 0
Area E 500 1600 300 960 135% 406 36% 346 6 0 107
Area F 600 600 315 530 198% 625 99% 523 1 48 359
Area G 1895 0 1,224 0 110% 1345 n/a 48 0 20 0
Area H 103 1748 64 748 55% 35 12% 87 20 2 662
Area I 1300 1000 900 600 146% 1317 37% 219 0 33 543
Area J 1610 0 715 0 103% 734 n/a 43 0 24 0
Area K 1723 0 1,080 0 97% 1043 n/a 258 1 66 708
Area L 630 1120 490 865 68% 331 18% 153 3 15 751
TOTALS 11335 12928 7,068 8,660 94% 6672 32% 2791 132 508 8743
Total excluding three areas with no recipient
target
28% 2442
6
Type of Intergenerational Activity
2.11 Annex B provides project descriptions for each LA, based on the information available from the LAs to date. In addition, Annex C provides further details on the projects that were visited as part of the case-study visits. The MI tool can also be used to look at information about the types of projects that currently exist across the 12 Generations Together LAs. Features of the projects are described under the following headings:
• Activity themes;
• Duration of project;
• Number of project sessions;
• Length of project sessions.
Activity Themes
2.12 Table 2.3 outlines the number of projects7 that are focusing on a particular intergenerational theme per LA. The most common theme is education and learning (applicable to 119 projects) and the least common is sport and leisure (applicable to 42 projects).
2.13 In reality, there is more overlap in the project themes, however the LAs have been asked to identify predominant themes for the purposes of the MI tool.
7
Table 2.3: Number of Relevant Activity Themes
Number of Projects
Arts and Crafts
Community & Democracy
Education & Learning
Health & Well Being
Sport and Leisure
Supporting/ Mentoring
Other/Not given8
Area A 21 8 2 9 4 6 0 2
Area B 5 0 1 1 0 0 1 2
Area C 17 4 5 2 4 1 0 9
Area D 13 6 6 12 4 1 13 5
Area E 13 2 4 4 3 0 2 6
Area F 58 14 8 37 22 17 9 13
Area G 12 1 2 4 1 0 3 1
Area H 25 2 2 7 4 7 9 17
Area I 20 14 8 14 3 1 1 1
Area J 9 2 2 7 1 0 5 2
Area K 36 6 16 18 16 6 6 2
Area L 8 2 4 4 2 3 5 1
Total9 237 61 60 119 64 42 54 61
8
Other project examples cited by areas included intergenerational radio projects, reading helpers, reminiscence and social/cultural project. 9
Project Duration
2.14 As shown in Table 2.4 below, the most common duration of projects is 13-18 months (51 projects). Nearly a quarter of projects (23%; n=54) were reported to last over a year. Although this suggests that projects were more likely to be longer in duration, Table 2.7 indicates that the actual duration of the involvement of participants is likely to be much shorter.
Table 2.4: Project Duration (Base=237)
<1 month 47 20%
1-2 months 31 13%
3-5 months 18 8%
6-12 months 36 15%
13-18 months 51 22%
18+ 3 1%
Not answered 51 22%
TOTAL 237 100%
Number of Project Sessions per Cohort
2.15 There was useable data on the MI for 90 of the 237 projects in relation to the number of sessions that were being delivered. For the remaining projects, this information was missing and therefore these projects have been excluded from any analysis.
2.16 It appears that the majority of projects are not involving participants for a sustained period of time and are adopting a rolling programme approach. As shown in Table 2.5, the majority of projects are delivering ten or fewer sessions per cohort (81%; n=73), with each participant on average attending eight sessions.
2.17 Therefore, in contrast to the duration of projects detailed in Table 2.4, the actual number of project sessions that participants are attending seems to be relatively low.
Table 2.5: Number of Sessions per Cohort (Base=90)
1-10 73 81%
11-20 10 11%
21-30 2 2%
30+ 5 6%
Number of Hours per Project Session
2.18 The majority of project sessions last between 2-3.5 hours (see Table 2.6), with three-fifths of projects (60%; n=54) involving sessions of this length. The average session length is 3 hours across the 90 projects.
Table 2.6: Number of Hours per Session (Base=90)
1 hour 16 18%
2 - 3.5 hours 54 60%
4 - 8 hours 17 19%
1 day+ 3 3%
Not answered 0 0%
TOTAL 90 100%
Intensity of Involvement per Cohort
2.19 Table 2.7 provides an illustration of the intensity of participants’ involvement in Generations Together projects (number of sessions x total hours of involvement).
2.20 The intensity of participants’ involvement in projects is generally low. As shown, participants’ total hours of involvement is most commonly between 4-8 hours. For a third of projects (n=31) participants involvement was 3.5 hours or less. This may be as a result of LAs using the first 6-12 months of the programme to gain “quick wins” (two LAs reported this in YCL consultations/contact), and it is possible that the profile will change over the next six months.
Table 2.7: Intensity of Involvement per Cohort (Base=90)
1 hour 6 7%
2 - 3.5 hours 24 27%
4 - 8 hours 26 29%
8.5 - 24 hours 18 20%
25 - 56 hours 9 10%
Over 56 hours 7 8%
Profile of Volunteers and Recipients
2.21 There are details of 9,595 volunteers and recipients on the MI tool who have been involved in Generations Together.
Number of Projects Participants are involved in
2.22 The majority of participants were involved in only one project. As shown in Table 2.8, 95% of participants (n=9,087) are involved in one project, with just less than 5% (n=432) involved in two projects. There were 77 participants who were involved in three or more projects.
Table 2.8: Number of Projects Participants Involved in (Base=9,595)
No %
One 9087 94.7
Two 432 4.5
Three 58 0.6
Four 15 <1
Five or more 4 <1
TOTAL 9,595 100
Gender, Age and Ethnicity
2.23 There appeared to be more females taking part in Generations Together projects. From the 8019 individuals who provided data on the MI tool, over three-fifths were female (61%; n=4,881).
2.24 There are a greater number of younger people taking part in Generations Together activities than older people. Excluding those where details are unknown, over half of participants are aged 25 and under (56%; n=5,116) and over two-fifths (42%; n=3,797) were aged 50 or over. As shown in Table 2.9, 2% (n=163) of the participants with details on the MI tool were outside of the Generations Together target age groups (i.e. between the ages of 26 and 49). This reflects the multigenerational nature of Generations Together activity in some projects.
2.25 The age profile of participants varies across LAs. Eight of the LAs appeared to be working with a greater number of younger people than older people, whereas the remaining four areas were working with a greater number of older people.
2.26 The average age of younger participants is 14 and the average age of the older participants is 68.
Table 2.9: Age of Participants (Base=9,076)
Age No %
Younger (up to 25) 5116 56
Older (26-49) 3797 42
Middle (50 and over) 163 2
TOTAL 9076 100
(Unknown) 519
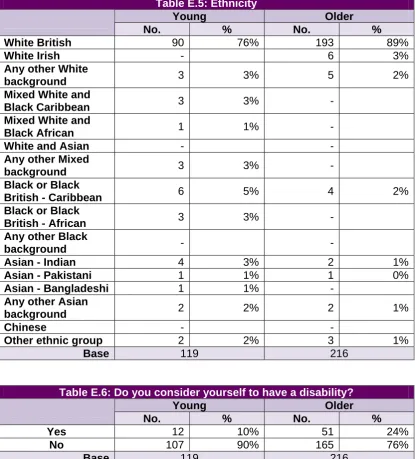
2.28 As shown in Table 2.10, for the participants for whom information is available, over four-fifths (82%; n=2,962) were White, less than one-tenth were Black (9%; n=323) and 6% were Asian (n=200).
Table 2.10: Ethnicity of Participants (Base=3,605)
Status No %
White 2962 82
Black 323 9
Asian 200 6
Mixed 98 3
Chinese 22 1
TOTAL 3,605 100
Other/no detail 5990
2.29 For the participants for whom information was available, 12% were reported to have a disability (n=424). This varied considerably across areas, ranging from 5% (Reading), to 21% (Manchester).
Volunteered Elsewhere in Last 5 Years
2.30 A key focus for Generations Together was to engage individuals who had not volunteered previously. For the 3,755 participants for whom information was available, just less than a third (30%; n=1,142) had volunteered elsewhere in the last 5 years (see Table 2.11). This means that the Generations Together projects had been successful at engaging at least 2,613 new volunteers into volunteering opportunities.
2.31 The engagement of new volunteers in Generations Together activities varied across LAs, ranging from 14% (Reading) to 54% (Worcestershire).
Table 2.11: Previous Volunteering Experience (Base=3755)
Status No %
Previous Experience 1142 30
No Previous Experience 2613 70
TOTAL 3755 100
Not given/ prefer not to say 5840
Care Status
2.32 There are 109 younger participants who are classed as being ‘looked after children’ on the MI tool. This represents 2% of all younger people on the MI tool (5,116).
Education, Employment and Training Status
2.33 As shown in Table 2.12, of the participants for whom information is available, just over four-fifths of young people (81%; n=1,344) are a student or at school and nearly three-quarters of older participants (74%, n=1,098) are retired.
Table 2.12: EET Status of Participants
Status Younger Older Middle Not given/prefer
No % No % No % No %
Employed 119 7% 184 12% 67 55% 31 19%
Looking after 9 1% 25 2% 6 5% 3 2%
Permanently sick or
disabled 2 0% 13 1% 3 2% 0 0%
Retired 12 1% 1098 74% 0% 48 30%
Self Employed 17 1% 26 2% 17 14% 4 2%
Student/School 1314 81% 15 1% 3 2% 56 35%
Unemployed 144 9% 119 8% 25 21% 20 12%
TOTAL (base = total
of age category) 1617 100% 1480 100% 121 100% 162 100%
Not given/prefer not to
say 2317 3499 42 357
Perceptions and Attitudes of Participants (Baseline)
2.34 The baseline survey data is useful for providing an overview of the views, perceptions and attitudes of older and younger people on starting their involvement in Generations Together projects. This is particularly beneficial in providing an insight into the types of participants that were involved in Generations Together activity.
2.35 It should be recognised that there is likely to be some sampling bias within the survey. For example, it is unlikely that it was possible to engage volunteers or recipients in the survey process who may be considered harder to reach or who, due to communication or language issues, were not able to participate in the survey. This potential sampling bias should be taken into consideration in the interpretation of the baseline responses.
2.36 As outlined in the methodology, specific questions from the Generations Together survey were also included in a national omnibus survey for the 11-25 and 50 and over age group. The aim of this was to provide a benchmark with the Generations Together participants. A number of the questions included in the survey have also been included in other national surveys including the Place survey and the British Social Attitudes survey. We therefore include comparisons between the responses provided by the Generations Together participants and the general population (collected through the omnibus survey and other national surveys) where appropriate.
2.37 The data tables for the baseline survey questions can be found in Annex E. A copy of the surveys can be found in Annex D.
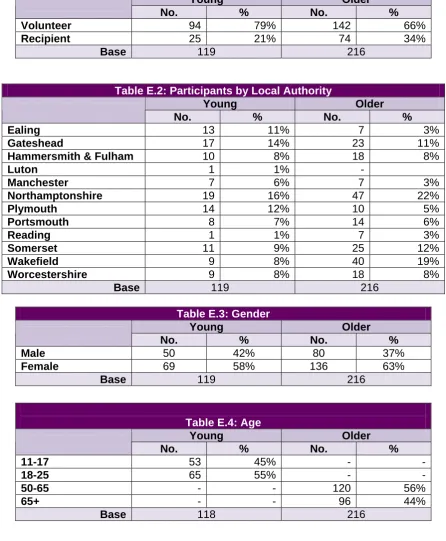
2.38 In order to establish how representative survey respondents were, compared to those involved in Generations Together activity more widely, we compared to the profile of the survey respondents with the profile of individuals on the MI tool. The profile of survey respondents was broadly similar to the participants recorded on the MI tool, although there was some variation across specific variables:
• 82% of participants on the MI tool were of white ethnicity, compared to 89% who were involved in the survey;
• 56% of participants on the MI tool were younger people; compared to 35% of the survey sample;
• the proportion of individuals who considered themselves to have a disability was higher in the survey sample (19%), compared to individuals on the MI tool (12%).
Satisfaction with Local Area
2.39 Both older and younger people reported high levels of satisfaction with their local area as a place to live (see Table 2.13). Over nine-tenths (93%) of older people reported being ‘fairly’ or ‘very’ satisfied with their area, compared to 85% of young people. Less than a tenth of young people (7%) and only 2% of older people reported any dissatisfaction with their local area.
Table 2.13: How satisfied or dissatisfied are you with your local area as a place to live?
Young Older
No. % No. %
Very Satisfied 35 29% 118 55%
Fairly Satisfied 67 56% 81 38%
Neither Satisfied nor
Dissatisfied 9 8% 12 6%
Fairly Dissatisfied 6 5% 5 2%
Very Dissatisfied 2 2% -
Don't Know - - -
Base 119 216
2.40 The Generations Together survey respondents generally appeared more satisfied with their local area as a place to live, when compared with the general population. For example, the Place Survey 2008 found that 80% of the population were satisfied with their local area as a place to live.
Feelings of Safety
2.41 Generally, both younger and older people reported feeling safe in their local area (see Table 2.14). Nearly all reported feeling safe in their local area during the day (94% of younger and 99% of older people). Feelings of safety did decrease, however, at night for both older and younger people; with nearly seven-tenths (69%) of younger people reporting that they felt ‘very’ or ‘fairly’ safe, compared to 65% of older people.
Table 2.14: How safe or unsafe do you feel when outside in your local area?
During the day When it’s dark
Young Older Young Older
No. % No. % No. % No. %
Very safe 71 60% 157 73% 32 27% 70 32%
Fairly safe 41 34% 56 26% 50 42% 71 33%
Neither safe
Fairly unsafe 3 3% - 21 18% 38 18%
Very unsafe - 1 0% 3 3% 8 4%
Don't know - - - 12 6%
Base 119 216 119 216
Perceptions of Anti-Social Behaviour
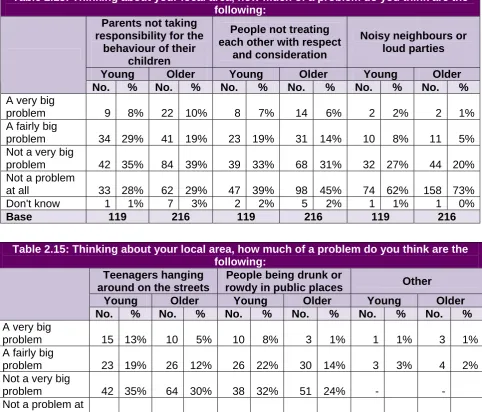
2.42 The existence of anti-social behaviour in local areas was felt to be reasonably low by both younger and older people (see Table 2.15). However, proportionately, younger people had more negative perceptions of the existence of anti-social behaviour in their local area, than older people. In particular:
• over a third (37%) of young people perceive parents not taking responsibility for the behaviour of their children to be a ‘fairly’ or ‘very big’ problem, compared to 29% of older people;
• nearly a third (32%) of young people perceive teenagers hanging around on the streets to be a ‘fairly’ or ‘very big’ problem, compared to nearly one-fifth (17%) of older people;
Table 2.15: Thinking about your local area, how much of a problem do you think are the following:
Parents not taking responsibility for the
behaviour of their children
People not treating each other with respect
and consideration
Noisy neighbours or loud parties
Young Older Young Older Young Older
No. % No. % No. % No. % No. % No. %
A very big
problem 9 8% 22 10% 8 7% 14 6% 2 2% 2 1%
A fairly big
problem 34 29% 41 19% 23 19% 31 14% 10 8% 11 5%
Not a very big
problem 42 35% 84 39% 39 33% 68 31% 32 27% 44 20%
Not a problem
at all 33 28% 62 29% 47 39% 98 45% 74 62% 158 73%
Don't know 1 1% 7 3% 2 2% 5 2% 1 1% 1 0%
Base 119 216 119 216 119 216
Table 2.15: Thinking about your local area, how much of a problem do you think are the following:
Teenagers hanging around on the streets
People being drunk or
rowdy in public places Other
Young Older Young Older Young Older
No. % No. % No. % No. % No. % No. %
A very big
problem 15 13% 10 5% 10 8% 3 1% 1 1% 3 1%
A fairly big
problem 23 19% 26 12% 26 22% 30 14% 3 3% 4 2%
Not a very big
problem 42 35% 64 30% 38 32% 51 24% -
-Not a problem at
all 38 32% 112 52% 45 38% 125 58% 115 97% 209 97%
Don't know 1 1% 4 2% - 7 3% -
-Base 119 216 119 216 119 216
Involvement in Local Community
Table 2.16: How involved do you feel in your local community?
Young Older
No. % No. %
Very involved 11 9% 50 23%
Fairly involved 60 50% 77 36%
Not very involved 36 30% 66 31%
Not at all involved 12 10% 19 9%
Don't know - 4 2%
Base 119 216
2.44 As shown in Table 2.17 older people were more likely to feel that they made a positive contribution to society and were active members of their local community (85% and 68% respectively), compared to younger people (78% and 60% respectively).
Table 2.17: How much would you agree or disagree with the following statements? I make a positive
contribution to society
I am an active member of my local community
I have pride in my local area
Young Older Young Older Young Older
No. % No. % No. % No. % No. % No. %
Definitely Agree 44 37% 102 47% 27 23% 80 37% 49 41% 143 66%
Tend to Agree 49 41% 82 38% 44 37% 66 31% 54 45% 46 21%
Tend to Disagree 11 9% 24 11% 32 27% 54 25% 8 7% 16 7%
Definitely Disagree 2 2% 3 1% 9 8% 13 6% 4 3% 4 2%
Don't Know 13 11% 5 2% 7 6% 3 1% 4 3% 7 3%
Base 119 216 119 216 119 216
2.45 Survey respondents were asked to provide details of any formal or informal volunteering opportunities they had engaged in over the last 12 months, prior to Generations Together (see Table 2.18).
Table 2.18: Engagement in informal volunteering - In the last 12 months, have you done any of the following things unpaid on a voluntary basis for someone who was not a relative?
Young Older
Yes No Yes No
No. % No. % No. % No. %
Keeping in touch with someone who had difficulty getting out and
about 32 27% 87 73% 226 53% 101 47%
Shopping, collecting pensions, paying bills 22 18% 97 82% 53 25% 163 75% Cooking, cleaning, laundry, gardening or other routine household
jobs 26 22% 93 78% 34 16% 182 84%
Decorating or any kind of home or car repair 17 14% 102 86% 15 7% 201 93% Babysitting or caring for children 41 34% 78 66% 31 14% 185 86% Sitting with or providing personal care 17 14% 102 86% 26 12% 190 88% Looking after a property or pet for someone who is away 34 29% 85 71% 86 40% 130 60%
Giving advice 72 61% 47 39% 110 51% 106 49%
Writing letters or filling in forms 36 30% 83 70% 54 25% 162 75%
2.47 Engagement in formal volunteering was generally minimal (see Table 2.19). Although, respondents were most likely to indicate that they had raised funds for charity, which over half of young people (57%) and older people (52%) had done. Other engagement in formal volunteering opportunities included:
• hobbies (45% of both older and younger people);
• helping the local community (44% of older people and 35% of younger people);
• supporting children’s education and activities (41% of younger and 26% of older people).
Table 2.19: Engagement in formal volunteering - In the last 12 months, have you done any of the following things unpaid on a voluntary basis for someone who was
not a relative?
Young Older
Yes No Yes No
No. % No. % No. % No. %
Supporting children’s education and activities
49 41% 70 59% 56 26% 160 74%
Raising funds
for charity 68 57% 51 43% 113 52% 103 48%
Volunteering with
organisations that support people
32 27% 87 73% 57 26% 159 74%
Helping your local
community
42 35% 77 65% 96 44% 120 56%
Coaching or
teaching 31 26% 88 74% 27 13% 189 88%
Supporting faith
groups 22 18% 97 82% 47 22% 169 78%
Hobbies 53 45% 66 55% 98 45% 118 55%
Promoting
social justices 11 9% 108 91% 21 10% 195 90%
Political
activities 6 5% 113 95% 17 8% 199 92%
Trade union
activities - - 119 100% 4 2% 212 98%
Something else 4 3% 115 97% 10 5% 206 95%
Engagement with and Attitudes Towards Own and Other Generation
2.48 Young people were mainly positive in their views of older people (see Table 2.20), and these tended to be more positive than the views of the omnibus survey respondents. For example:
• nearly three quarters (72%) of participant young people reported that they ‘definitely agree’ or ‘tend to agree’ that older people have respect for young people, compared to nearly six-tenths (59%) of respondents to the omnibus survey;
• nearly three quarters (72%) reported that they ‘definitely agree’ or ‘tend to agree’ that the views of older people are not listened to enough;
• just over seven-tenths of young people (71%) definitely agreed or tended to agree that society does not recognise the contribution that older people are still able to make;
• all but one young person definitely agreed or tended to agree that they could learn from the experiences of older people (99%), slightly above the 93% of omnibus survey respondents who agreed with this statement.
Table 2.20: Young People’s Perceptions of Older People Definitely
agree
Tend to Agree
Tend to Disagree
Definitely Disagree
Don’t know
No. % No. % No. % No. % No. %
Older people have respect for young people 23 19% 63 53% 21 18% 5 4% 7 6% The views of older people are not listened to enough 28 24% 69 58% 13 11% 5 4% 4 3% Society does not recognise the contribution that older people are still
able to make 27 23% 57 48% 17 14% 7 6% 11 9%
Older people are too set in their ways and ideas 10 8% 46 39% 37 31% 14 12% 12 10% There are skills that older people could teach me 62 52% 50 42% 3 3% 1 1% 3 3% I feel comfortable speaking to older people 64 54% 51 43% 4 3% - - - - I have nothing in common with older people 2 2% 20 17% 47 39% 48 40% 2 2% I believe I can learn from the experiences of older people 66 55% 52 44% 1 1% - - - -
2.50 Older people were more mixed on their views of younger people, but these were still generally positive (see Table 2.21) and were more positive than the omnibus survey respondents and when benchmarked against other national surveys. For example:
• just over half (53%) agreed that the behaviour of young people today is no worse than it was in the past. In comparison just a quarter (25%) of older respondents10 from the 2008 British Social Attitudes Survey either strongly agreed or agreed that this was the case;
• however over seven-tenths (72%) agreed that most young people are responsible and well behaved;
• nearly three-fifths (57%) of older people disagreed that older people are admired and respected by young people, compared to just over three-fifths (61%) of omnibus survey respondents.
2.51 Over four-fifths (82%) of survey respondents reported that they ‘definitely’ or ‘tend to’ agree that most young people are responsible and well-behaved. This compares to 63% of older respondents11 from the 2008 British Social Attitudes Survey, who either ‘strongly agreed’ or ‘agreed’ that most young people are responsible and well-behaved.
2.52 Older people were positive about the potential for skill-sharing with young people, with nearly nine-tenths (89%) reporting that there were skills that young people could teach them. Furthermore, nine-tenths (90%) of older people believed they could learn from the experiences of young people, compared to nearly seven-tenths of the omnibus survey respondents (68%). Similarly, nearly all (96%) respondents indicated that they felt comfortable speaking to young people.
10
respondents who were aged between 45-97. 11
Table 2.21: Older People’s Perceptions of Young People Definitely
agree
Tend to Agree
Tend to Disagree
Definitely Disagree
Don’t know
No. % No. % No. % No. % No. %
The behaviour of young people today is no worse than it was in
the past 52 24% 59 27% 60 28% 38 18% 7 3%
Older people are admired and respected by young people 14 6% 65 30% 89 41% 35 16% 13 6% The views of young people aren’t listened to enough 46 21% 97 45% 45 21% 11 5% 17 8% Most young people are responsible and well-behaved 51 24% 125 58% 25 12% 5 2% 10 5% There are skills that young people could teach me 111 51% 81 38% 13 6% 7 3% 4 2% I feel comfortable speaking to young people 127 59% 79 37% 9 4% 1 0% - - I have nothing in common with young people 6 3% 30 14% 81 38% 95 44% 4 2% I believe I can learn from the experiences of young people 106 49% 88 41% 13 6% 4 2% 5 2%