i
A
SSESSMENT OF PULMONARY
F
UNCTION BY
SPIROMETRY IN ANTENATAL CASES
Dissertation Submitted to
THE TAMILNADU Dr. M.G.R MEDICAL UNIVERSITY
CHENNAI – 600 032
In partial fulfillment of the requirements for the award of the degree of DOCTOR OF MEDICINE
IN
PHYSIOLOGY
BRANCH –V Reg. No. 201415601
DEPARTMENT OF PHYSIOLOGY
KARPAGA VINAYAGA INSTITUTE OF MEDICAL SCIENCES AND RESEARCH CENTRE
CHINNAKOLAMBAKKAM MADHURANTHAGAM – 603408
ii
CERTIFICATE
This is to certify that this dissertation titled
“A
SSESSMENT OF PULMONARYF
UNCTION BY SPIROMETRY IN ANTENATAL CASES”
is a bonafide work ofDR. M.C. ARUMUGAM, during the period of his post graduate study from 2014 to 2017 under guidance and supervision of the Department of Physiology, Karpaga
Vinayaga Institute of Medical Sciences and Research Centre, Madhuranthagam
-603408 in partial fulfillment of the requirements for MD PHYSIOLOGY (Branch V) degree examination of The Tamil Nadu Dr. MGR Medical University to be held in
April 2017.
Dr. S. Vadivel, MD
Signature of the Guide Professor & HOD
Department of Physiology Department of Physiology
Karpaga Vinayaga Institute of Medical Karpaga Vinayaga Institute of Medical
Sciences and Research Centre Sciences and Research Centre
Madhuranthagam Madhuranthagam
Principal
Karpaga Vinayaga Institute of Medical
Sciences and Research Centre
iii
DECLARATION
I Dr. M.C. Arumugam hereby declare that this dissertation entitled
“
A
SSESSMENT OF PULMONARYF
UNCTION BY SPIROMETRY INANTENATAL CASES
”
submitted by me for the degree of M.D. is the record workcarried by me during the period APRIL 2015 to January 2016 under the guidance of
Dr. S. Vadivel, MD , Prof & Head of the Department of Physiology, Karpaga
Vinayaga Institute of Medical Sciences and Research Centre, Madhuranthagam. This
dissertation is submitted to the Tamilnadu Dr.M.G.R. Medical University, Chennai, in
partial fullfillment of the University regulations for the award of degree of M.D.
Physiology (Branch V) examinations to be held in April 2017.
Place: Madhuranthagam Signature of candidate:
Date: (M.C.ARUMUGAM)
In the capacity as the guide for the candidate’s dissertation work, I certify that the
above statements are true to the best of my knowledge.
Dr. S. Vadivel, MD
Professor & HOD
Department of Physiology
Karpaga Vinayaga Institute of Medical Sciences
and Research Centre
iv
ACKNOWLEDGEMENT
I render my heartfelt thanks to Almighty for the blessings showered upon me and my
family. I express my sincere thanks to our respected Managing Director Professor Dr. R. Annamalai M.S, for permitting and extending his valuable support in conducting this study.
I humbly respect and thank our principal Dr. Sufala Sunil Vishwasrao MD for permitting and supporting me to conduct this study.
I express my deep, heartfelt and sincere thanks to my guide Professor, Dr. S. Vadivel M.D, for his guidance in every process of this study.
I extend my sincere gratitude to Prof. Dr.Navin Rajaratnam, Dr.Vijaya Malathi and Dr.Jaya, Department of Physiology for their constant support and valuable suggestions.
I express my wholehearted gratitude to Dr.S.Sumithra, department of Physiology for valuable suggestions and erudite guidance in my study.
I express my heartfelt thanks to Dr.A.Anitha, M.D., Dch., Professor and HOD, Department of Physiology, Chengalpattu Medical College, Chengalpattu for her
valuable suggestions.
I express my sincere thanks to Ms. H.Gladius Jennifer, Assistant Professor (Biostatistics), Department of Community Medicine for helping me in every process
of this study.
v I express my sincere thanks to other faculty members and supporting staffs in
department of Physiology.
I would like to thank the Institutional Ethical Committee for approving my study.
I am grateful to my beloved wife Dr.A.M. Indira and my daughter A.Kiruthika and other family members who supported me throughout this postgraduate period.
Last but not the least I am very grateful to all the patients without whom this study
viii LOGINGET PREMIUM ACCOUNTPLAGTRACKER'S API
Follow @plagtracker
Your paper contains 0% of non-unique content that appears in 0 Sources Please make sure that highlighted text is properly referenced.
0%
Tweetx
Our advice:
Wow, your paper is awesome and you're a master! Don't be shy, share your score now:
ix
C
ONTENTSS. No
Title
Page Number
1 INTRODUCTION 2
2 AIMS AND OBJECTIVES 5
3 REVIEW OF LITERATURE 7
4 MATERIALS AND METHODS 25
5 RESULTS 31
6 DISCUSSION 54
7 SUMMARY AND CONCLUSION 58
8 BIBLIOGRAPHY 61
9 ANNEXURES 65
x
L
IST OFT
ABLESTable
No.
Title of the table
Page
no
1 Age Distribution of Antenatal Mothers 31
2 Comparison of Mean age between the three trimesters among pregnant women
33
3 Comparison of Mean Weight (kgs) between the three trimesters among pregnant women
34
4 Comparison of Mean Height (cm) between the three trimesters among pregnant women
36
5 Comparison of Mean Body Mass Index (BMI) between the three trimesters among pregnant women
38
6 Comparison of Mean Blood Pressure between the three trimesters among pregnant women
40
7 Comparison of Parity between the three trimesters among pregnant women
42
8 Comparison of TT / IFT between the three trimesters among pregnant women
44
9 Comparison of FVC (%) between the three trimesters among pregnant women
45
10 Comparison of FEV1(%) between the three trimesters among pregnant women
47
11 Comparison of FEV1/ FVC(%) between the three trimesters among pregnant women
47
12 Comparison of PEFR between the three trimesters among pregnant women
[image:10.595.102.531.100.665.2]xi
L
IST OFG
RAPHSTabl
e No.
Title of the Graphs
Page no
1 Age Distribution of Antenatal Mothers 32
2 Comparison of Mean age between the three trimesters among pregnant women
33
3 Comparison of Mean Weight (kgs) between the three trimesters among pregnant women
35
4 Comparison of Mean Height (cm) between the three trimesters among pregnant women
37
5 Comparison of Mean Body Mass Index (BMI) between the three trimesters among pregnant women
39
6 Comparison of Mean Blood Pressure between the three trimesters among pregnant women
41
7 Comparison of Parity between the three trimesters among pregnant women
43
8 Comparison of TT / IFT between the three trimesters among pregnant women
44
9 Comparison of FVC (%) between the three trimesters among pregnant women
46
10 Comparison of FEV1(%) between the three trimesters among pregnant women
48
11 Comparison of FEV1/ FVC(%) between the three trimesters among pregnant women
50
12 Comparison of PEFR between the three trimesters among pregnant women
1
INTRODUCTION
---2
INTRODUCTION
Pregnancy is the distinctive nature of a particular order in which related things
follow each other of effective physiological changes that a marked effect on various
organs function and is associated with multiple changes in respiratory system anatomy
and physiology1-3. Three important changes in the organization of the thorax that occur
during the period of pregnancy were an expansion in the width of the lower-level of chest
wall (anteroposterior and the transverse diameters are increased); raise of the diaphragm
(a cephalad displacement of approximately 4 cm to 5 cm) and a 50% broadening of the
costal angle1-3. These alterations attain the maximum around the 37th week of pregnancy
and become normal within 6 months after delivery6.
Pulmonary function is disturbed by changes in the airway, thoracic cage, and
respiratory drive. And also capillary engorgement in the entire respiratory tract leads to
mucosal edema and hyperemia4,5. Multiple biochemical changes like increase in
progesterone, estrogen, prostaglandins, corticosteroid and cyclic nucleotide levels occur
simultaneously during the period of pregnancy6.
The chest wall circumference raised about 6cm but not satisfactorily to present a marked dimnision in the Residual Volume of air in the lungs controlled by the raised
diaphragm. The Diaphragmatic elevation is literally greater during pregnancy than during
nonpregnant state6. During any level of normal pregnancy, the amount of oxygen entered
into the lungs, by the rise in Tidal Volume in a clear manner go beyond the oxygen need
to be forced by pregnancy. Furthur more the quantity of hemoglobin in circulation raises
3 related with physiological adaptation in the control of breathing, in lung volumes, in the
mechanisms of respiration and in acid-base balance. Maternal pulmonary changes in
succession alter the metabolism and health of the fetus through their influence on placental gas exchange6.
The most important changes in lung function is a rise in Minute Ventilation which
enhances by 36% by the eighth week of antenatal period finally attaining the levels ,50%
above the nonpregnant demand. These changes are needed to fulfill the increase in
oxygen consumption of 30-35% by the growing fetus6.
The respiratory alterations have far-reaching clinical implications as previous
knowledge will aid significantly in the process of dealing with an antenatal women with
respiratory disorders. Pulmonary alterations in antenatal period are of clinical
significance to the anesthetist during management of anesthesia to antenatal women,
especially during caesarean section6.
Thus this study objective is specifically evaluating some ventilatory function
4
AIM AND OBJECTIVES
---5
A
IM ANDO
BJECTIVES OF THE STUDYA
IM:
To determine the effect of pregnancy on pulmonary function parameters in antenatal
cases attending Karpaga Vinayaga Institute Medical Sciences and Research Centre,
Kancheepuram District.
O
BJECTIVES:
To establish the values of Forced Vital Capacity (FVC) in Pregnancy
To establish the values of Forced Expiratory Volume (FEV1) in Pregnancy
To verify the difference in FEV1/FVC during Pregnancy
To evaluate the values Peak Expiratory Flow Rate (PEFR) during Pregnancy
To assess the effect of gestational age (1st , 2nd and 3rd trimester) on these
7
REVIEW OF LITERATURE
The pulmonary system includes the lungs, the conducting airways that direct air
to the gas exchange sites (alveoli), respiratory centers in the central nervous system, the
muscles of the chest wall and the diaphragm that are responsible for inflation and
deflation of the lungs7. The lungs occupy most of the thoracic cavity except for the space
filled by the heart and major blood vessels7.
The process of respiration is divided into four categories: 1- Pulmonary ventilation. 2-
Diffusion of oxygen and CO2 between alveoli and tissues. 3- Transport of oxygen and
CO2 in body fluids to and from cells. 4- Regulation of respiration.7
Air is distributed to alveoli as a result of contraction of the respiratory muscle.
These muscles comprise the diaphragm and the external intercostal muscles of the
ribcage and accessory inspiratory muscles (scalenes and sternocleidomastoids which are
not active in eupnea). Contraction of these muscles expands the thoracic cavity, creating
a subatmospheric pressure in the alveoli. Contraction of the diaphragm results in
downwards displacement of the thoracic cavity and contraction of external intercostals
muscles resulting in a lifting of the thoracic cage leading to increasing in the
anteroposterior diameter. As alveolar pressure decreases, atmospheric air enters into the
alveoli by bulk flow till the pressure becomes equal. The process of filling up the lung is
called inspiration. Expiration is generally passive, results from relaxation of the
inspiratory muscles and powered by elastic recoil of lung tissue that is stretched during
inspiration. With the relaxation of the inspiratory muscles and lung deflation, alveolar
8 atmosphere by bulk flow. Active expiration is because of internal intercostals muscles
and the abdominal recti muscles7.
Pulmonary ventilation includes the inflow and outflow of air in the lungs,which is
altered by various independent factors. Spirometry is a method of assessing lung
function by measuring the volume of air that the patient can expire from the lungs after a
maximal inspiration.
Lung Volumes and Capacities
spirometry measurement of Lung volumes is fundamentally anatomical measurements of
lung gas volumes. A lung volume refers to a principle volume of the lung, whereas lung
capacities, also a volume measurement, are the sum of two or more principle lung
volumes. The following lung volumes can be measured directly or indirectly with a
9
Tidal Volume (VT): volume of air inhaled or exhaled during a normal spontaneous breath.
Inspiratory Reserve Volume (IRV): volume of air that can be inhaled at the end of a spontaneous inspiration.
Expiratory Reserve Volume (ERV): volume of air that can be exhaled at the end of a spontaneous VT.
Residual Volume (RV): volume of air in lungs that cannot be forcefully exhaled or the volume of air in the lung at end of a vital capacity.
10
Inspiratory Capacity (IC): the maximal volume of air that can be inhaled from normal end-expiration or VT + IRV
Functional Residual Capacity (FRC): total volume of air in the lung at end of normal end-expiration or ERV + RV.
Total Lung Capacity (TLC): total volume of air in lung at maximal endinspiration or VC + RV or IRV + VT + ERV + RV.
The minute respiratory volume: Total amount of new air moved into the respiratory passages per minute and is equal to tidal volume (500 ml) multiplied by the respiratory
rate (12/min) = 6000ml/minute.
SPIROMETRY
:-Spirometry is a physiological test that estimates how an individual inspires or
expires volumes of air as a function of time. The basic signal estimated in spirometry
may be volume or flow. Spirometry is extremely useful as a screening test of general
respiratory health in the same way that blood pressure gives crucial information about
general cardiovascular health. However, on its own, spirometry does not lead clinicians
directly to an aetiological diagnosis8,9.
Spirometry has many other applications in evaluating and governing respiratory
disease. These include estimating the presence and severity of restrictive lung diseases,
screening of the employees in hazardous occupational environments, pre-employment
screening for definite occupations, and evaluating fitness to work. Some believe it may
be helpful as an encouraging tool to help smokers to quit, but solid scientific evidence on
11 Spirometry can be done with many different types of equipment and involves
cooperation between the subject and the examiner, and the results got will depend on
technical as well as personal factors.8,9
If the quality of uneven results can be decreased and the estimation accuracy can
be improved, the range of normal values for populations can be narrowed and alterations
more easily observed. The first American Thoracic Society (ATS) statement on the
standardization of spirometry as the consequence of The Snowbird workshop held in the
year 197910 . This was upgraded in 1987 and again in 199411, 12. The European
Community have taken a similar initiative for Steel and Coal, resulting in the first
European standardization document in 198313. This was then updated in
1993 as the official statement of the European Respiratory Society (ERS)14. There
are usually only minor differences between the two most recent ATS and ERS
statements, except that the ERS statement includes absolute lung volumes and the ATS
does not. The ATS and ERS together in an attempt to publish standards that can be
applied more widely. The statement is designed to cover definitions, equipment, and
patient-related procedures. All recording devices covered by this statement must meet the
appropriate requirements, despite whether they are for monitoring or diagnostic purposes.
12
T
YPES OF SPIROMETERS:
-
Bellows or rolling seal spirometers are big and not easily transportable, and are used mainly in lung function laboratories. They require regular calibration with a 3-liter
13
Electronic desktop spirometers are small, easily transportable, and generally fast and easy to use. They have a real-time visual display and paper or computer printout. Some
need calibration with the 3-liter syringe; others can be examined for accuracy with the
syringe but necessitates any alterations to be executed by the manufacturer. Usually, they
require small observation other than cleaning. They sustain validity over years and are
perfect for primary care9.
Small, inexpensive hand-held spirometers give a numerical record of blows but no printout. It may be important to look up predicted values in tables, but some include these
14 patient so that the spirometer also gives percent predicted values. These are useful for
simple screening and are precise for diagnosis if the more costly desktop form is
unsuitable or too expensive9.
Many spirometers give two forms of traces. One is the standard plot of volume
expired against time. The other is a plot of flow (L/sec) on the vertical axis versus
volume expelled (L) on the horizontal axis. This is a flow–volume trace and is most
helpful in diagnosing airway obstruction9.
In some countries, a printed record of spirometry is necessary for claiming
15 think careful in the light of this, as some automatically produce a printout, others can
store data to be printed later from a PC, and others do not have printing capacity at all8,9.
SPIROMETRY INDICES
:-Forced Vital Capacity (FVC): -
This is the volume change between maximal inhalation and maximal exhalation.
It can be measured during normal inhalation and exhalation or during forced
ventilatory effort (FVC). FVC measures about 4.8 liters in males and 3.7 liters in
females8,9.
Forced Expiratory Volume in one second (FEV1): -
FEV1 is the volume of air expired during the first one second of exhalation
maneuver starting from total lung capacity (TLC).It is the very often used index to assess
airway obstruction, bronchodilation, and constriction of airways. The FEV1 should be
more than 80% of the predicted value for age, race, and height is normal8,9.
FEV1/FVC% : -
When expressed as the percentage of VC (FEV1 percentage FVC), it is an index
of evaluating and quantifying airflow limitation. In patients with obstructive lung disease,
the IVC is more than the EVC, which is more than FVC. Thus when using the
FEV1/FVC ratio as an index, the actual VC should be specified; hence
FEV1percentageFVC or FEV1percentageIVC. The normal ratio of FEV1/ FVC is 0.8 to
16
Expiratory Peak Flow Rate (PEFR): -
This is the maximum flow generated during expiration performed with maximal
force and started after a full inspiration. PEFR is appreciably larger if the maneuver is
performed without pause, immediately after the inspiration than if it is performed after a
pause. The normal value is between 250 and 450litres /minute8,9.
Several factors decide the value of respiratory parameters. These variations occur
from one geographical location to the other, and even within the same population.
17 relationship between some respiratory parameters with age, weight, height race etc has
been established.
Pregnancy leading to some physiological and biochemical alterations that
influence generally all the organ of the body. Indeed, the alterations in the pulmonary
system have far-reaching implications for the antenatal woman, her baby, and health care
providers6.
The nasal obstruction is related with clear rhinorrhea and physical examination of
nose shows edematous nasal mucosa. It is known to be caused by a number of related
factors. The nasal mucosa is affected by a generalized rise in interstitial fluid volume
seen during the antenatal period and is also made worse by the direct effect of estrogen
on the nasal mucosa, which causes increased vascularity and mucosal oedema16.
Pregnancy-induced hypertension (PIH) or preeclampsia can increase the
18 manipulation of the airway can lead to massive bleeding from the nose or oropharynx;
endotracheal intubation can be a difficult one, and only a smaller than usual endotracheal
tube may fit through the larynx17-19.
There have been a lot of alterations and important advances in pulmonary
function testing, but little has been applied to antenatal women particularly in our
environment and it is hoped that our work in this area will help to refine the situation.
Hyperventilation occurs during the antenatal period. The attendant hypocapnia and
alkalosis of results from a complex interaction of pregnancy, induced changes in
wakefulness and central chemoreflex drive to breathe, acid-base balance, metabolic rate,
and cerebral blood flow19. There had been a lot of controversy surrounding the effects of pregnancy on vital capacity with many conflicting results.
Puranik et al, working in India, evaluated pulmonary function status in fifty
normal pregnant women tested monthly. The parameters studied were Vital Capacity
(VC), Forced Vital Capacity (FVC) and Forced Expiratory Volume in 1st second (FEV1)
using Vitalograph Spirometer; tidal volume (VT), inspiratory capacity (IC) and
expiratory reserve volume (ERV) using spirograph and resting minute ventilation (VE)
using Tissot's spirometer. Control values were obtained in the same subject 8-10 weeks
after delivery. The increment seen in VT, VE and IC was very highly remarkable20. The
small increase in the frequency of respiration was important and the decreasing trend
noticed in ERV was very highly noteworthy. VC and FVC were conserved by the
increase in IC and an associated decline in ERV. An increase in VC is caused mainly to
19 Another study in India using a dry bellows spirometer and a Wright's peak flow
meter showed a marked decline in peak expiratory flow rate, forced vital capacity and
forced expiratory volume in one second during the third trimester compared to controls21. Chhbra et al. study, 70 selected women, 50 pregnant and 20 nonpregnant controls
found that out of seven parameters studied five showed alterations. There were alterations
in the frequency of respiration, tidal volume, vital capacity, inspiratory capacity and
expiratory reserve volume22. Maximum voluntary ventilation and timed vital capacity did
not change. RF, VT, VC and IC increased significantly while a significant decline of
ERV. These alterations may affect the antenatal behavior of pregnant women and their
pregnancy outcomes22.
Kolarzyk, working in Poland on 51 antenatal women aged 26.6±4.9 years and 40
healthy women (control group), showed a statistically significant increase during the
antenatal period in cases of tidal volume (VT) and minute ventilation (MV) (whereas
breath frequency was nearly on the same level)23.There were also differences in
inspiratory drive (VT/TI), occlusion pressure (P0.1), RRS. In addition, there was a
correlation between BMI at the baseline with P0.1, MV, and VT/TI23.
Sroczynski examined the function of the respiratory system in antenatal women in
the last month of non-complicated pregnancy. Spirometry with Lung test 1000 was
performed in 31 antenatal women at a mean gestational age of 37.72 weeks. In 24 of
them, the test was repeated after delivery24 .The results were compared with a control
group of 31 healthy non-pregnant women. The vital capacity in the last month of
pregnancy did not differ from values after delivery and in the control group. Component
20 inspiratory reserve volume remained unchanged24. Minute ventilation recorded at rest in
antenatal period is raised despite lowered breathing rate, whereas maximum voluntary
ventilation was lower than after delivery and in the control group, evidencing decreased
breathing reserve. The main forced expiratory parameters continue to exist unchanged in
pregnancy. Parameters characterizing bronchioles showed an increase in airflow
(bronchodilation). Furthermore, dyspnoeic symptoms found in antenatal women
correlated with alterations in vital capacity components. Symptoms depended on the
mechanics of ventilation and not on the status of bronchi24.
Rees measured some respiratory parameters longitudinally during pregnancy and
post partum in 20 normal subjects with a computer-assisted mass spectrometer25. It
showed that resting tidal volume, minute ventilation, oxygen consumption, and carbon
dioxide production raised during pregnancy. End-tidal carbon dioxide tension fell
continuously during the antenatal period. Respiratory exchange ratio was 0.9 at 36 to 39
weeks' gestation and 0.8 at 5-13 weeks postpartum. Ventilatory frequency did not alter
during the antenatal period25. Wise and colleagues (1992) in the USA observed that the
important physiologic changes that occur during antenatal period are the increased
minute ventilation, which is caused by enhanced respiratory center sensitivity and drive;
a compensated respiratory alkalosis; and a low expiratory reserve volume. The vital
capacity and measures of forced expiration are well preserved. Patients who have many
lung diseases tolerate pregnancy well, with the exception of those who have pulmonary
hypertension or chronic respiratory insufficiency from a parenchymal or neuromuscular
21 Lui measured the lung functions in different pregnant stages in 41 women with
pregnancy and 12 normal women without pregnancy. Forced Vital Capacity (FVC)
significantly, but gradually decreased as pregnancy advanced26. After 28 weeks of
gestation, the Vital Capacity (VC), Forced Expired Volume in 1 second (FEV1)
significantly declined as compared with the normal values. These results suggested that
the lung function altered gradually during pregnancy, especially after the 28th week, but
more significantly in VC, FVC, and FEV1. Maybe there are slight obstructions in the
bronchial tubes, after the 28th week of gestation and it may be the reason for the
occurrence of shortness of breath and the lung infection26.
Peak expiratory flow rate has exhibited variations during the antenatal period.
Peak expiratory flow rates (PEFR) were measured longitudinally in 60 pregnant women
aged 20-28 years (average 24 yrs), with the height between 130-160 cm (average 154.5
cm), each month beginning from 3rd month of gestation and also 8-10 weeks postpartum
using Wright's Peak Flow Meter. The PEFR decreased from 329.12 +/- 4.40 lpm in the
3rd month to 286.22 +/- 3.81 lpm in the 9th month of gestation and risen to 347.86 +/-
2.93 lpm in postpartum period20. However Brancazio, study longitudinally in the USA on
57 women during each trimester of pregnancy and postpartum demonstrated that peak
expiratory flow rate does not change with pregnancy and advancing gestation27. This
finding is in agreement with a recent study in Northern Nigeria using 250 female (123
pregnant and 127 non-pregnant).Although values obtained were lower than that of
Caucasians, there were no significant changes between pregnant and non-pregnant
subjects 28. The Pulmonary function does not seem to be affected by fundal height or
22 A cross-sectional study of pulmonary function was performed in 68 women with
twin pregnancies (17 examined in the first trimester, 35 second trimester, 16 third
trimester) and 140 women with singleton pregnancies (28, 80, 40, respectively) and 22
non-pregnant women in a London teaching hospital. In both the twin and singleton
pregnancies, the mean FRC and expiratory reserve ventilation of women studied in the
third trimester and minute ventilation of women studied in each trimester differed
significantly from that of the non-pregnant women. There were, however, no significant
differences demonstrated in respiratory function between healthy women with a twin as
compared with singleton pregnancies29. Moreover , Strauss studied, retrospectively,
carried out 69 spirometric pulmonary function tests on 19 singletons, seven twins, 38
triplets, and five quadruplet pregnancies; maternal age 19–37 years; pregnancy weeks
22–4130.The vital capacity forced expired volume in 1 second, Tiffeneau's index, blood
gasses as well as blood pH levels were not significantly different in singleton, twin,
triplet or quadruplet pregnancies before or after 30 weeks of gestation. Finally, no
significant difference in respiratory function measurements could be found between
higher order pregnancies with or without subjective dyspnea. Thus, no clinically relevant
correlation between any spirometrically measurable pulmonary function values and
pregnancy data referring to uterine size, fundal height or breathlessness were found30.
Various physiological and pathological conditions may affect lung function during
pregnancy. A study performed by Schultz et al. in Denmark showed a significant
decrease in FRC, PEFR and FEV1 because of the postural changes, however, arterial
23 In Switzerland, it has been shown that epidural analgesia improves lung
function31. Spirometry was performed in sixty consenting participants receiving epidural
analgesia during the antepartum visit and in labour. After effective epidural analgesia was
established; at both assessments and the women were pain-free the results were as
follows: Values were within normal ranges but increased significantly after effective
epidural analgesia; median inter quantan range (IQR)) increase for vital capacity 7.4
(3.0-13 [-12- 27])% , forced vital capacity 4.4 (1.7-9.8 [-(3.0-13-26])% ; forced expiratory volume
in 1 s 5.5 (1.7-8.6 [-14-28])% ; and peak expiratory flow rate 2.3 (-1.6-5.8 [-18-16])%31.
Unsal measured FVC, FEV1 and PEFR in 13 pre-eclamptic and 15 control
subjects undergoing cesarean section31; and 11 pre-eclamptic and 15 control subjects
undergoing vaginal delivery (VD) on the postpartum third day. It was demonstrated that
certain pulmonary functions might be impaired in the early postpartum period in
pre-eclamptic women undergoing a caesarean section. Prepre-eclamptic women had significantly
lower FVC, FEV1 and PEFR measurements than the control. When the subjects were
grouped according to the mode of delivery, FVC, and FEV1 values were observed to be
significantly different between the preeclamptic and control groups undergoing a
caesarean section.None of these parameters was significantly different between the
pre-eclamptic and control groups who had delivered vaginally31. Lung function is affected by
multifactorial variables including normal pregnancy. These changes are further modified
by some obstetrics complications. Thus, baseline values are extremely invaluable in the
24
MATERIALS AND METHODS
---25
MATERIALS AND METHODS
S
TUDYD
ESIGN:
Observational Study
S
TUDYS
ETTING:
Antenatal women attending the obstetric and gynecology Department of
Karpaga Vinayaga Institute of Medical Sciences and Research Centre,
Chinnakaolambakkam, Kancheepuram district
S
TUDYP
ERIOD:
April 2015 to January 2016
P
OPULATION ANDS
AMPLING:
The antenatal mothers visiting OBG department were taken for the study after
getting informed consent, the consent being explained in their own language. The
subjects were grouped into three: Pregnant subjects of first trimester (up to12 weeks),
second trimester (13 weeks to 28 weeks) and third trimester (29weeks to up to birth)
gestational period. Totally 90 samples, (i.e) 30 subjects in each group were selected for
26
E
THICAL CLEARANCE:
Ethical clearance (Reg No: 201415601) was obtained from Institutional Ethical
Committee, Karpaga Vinayaga Institute of Medical Sciences and Research Centre.
INCLUSION CRITERIA
Confirmed pregnant women who were willing to participate
Ability to demonstrate sufficient proficiency in carrying out the tests needed to
assess ventilatory function.
EXCLUSION CRITERIA
Patients with the following were excluded:
Pre-existing cardio-respiratory diseases like asthma, Chronic Obstructive Airway
Disease (COPD), Congestive Cardiac Failure (CCF).
Presence of spinal deformities (scoliosis, kyphoscoliosis)
Upper and lower respiratory tract infections.
Medications that alter lung function (e.g. bronchodilators and constrictors).
Acute malaria in pregnancy.
Pre-eclampsia.
Diabetes in pregnancy
Other pregnancy complications (threatened abortion, antepartum hemorrhage etc)
We have used computer-based spirometry, Medicaid spiro excel in performing
27
M
ETHODOLOGY:
The subjects considered for this study are with Hemoglobin more than 10 gm%.
All the subjects were called for spirometric tracings, 3 to 4 hrs after meal, in the post
absorption stage in order to keep uniform conditions for recording the tests. All the
subjects were given instructions and with regard to the performance of the tests. The
tracings in the spirograph were taken after being fully satisfied. Two to three tracings
were taken out of which the best is taken as the final reading.
P
ROCEDURE:
The standard spirometry maneuver is a maximal forced exhalation (greatest effort
possible) after a maximum deep inspiration (completely full lungs). Several indices can
be derived from this blow.
• FVC – Forced Vital Capacity – the total volume of air that the patient can forcibly exhale in one breath8,9.
• FEV1 – Forced Expiratory Volume in One Second – the volume of air that the patient is able to exhale in the first second of forced expiration8,9.
• FEV1 /FVC – the ratio of FEV1 to FVC expressed as a fraction (previously this was expressed as a percentage). Values of FEV1 and FVC are measured in liters and are also
expressed as a percentage of the predicted values for that individual8,9.
M
EASURINGFEV1,
FVC,
ANDF
LOW–V
OLUMEC
URVES8,9Attach a clean, disposable, one-way mouthpiece to the spirometer.
28 The patient should hold their breath long enough to seal their lips tightly around
the mouthpiece.
Blast the air out as forcibly and fast as possible until there is no more air left to
expel. The operator should verbally encourage the patient to keep blowing and
keep blowing during this phase. Watch the patient make sure a good mouth seal
around the mouthpiece is achieved.
Check that an adequate trace has been achieved. Sometimes with electronic
spirometers, the patient may leak a small volume of air into the mouthpiece while
sealing the lips which will register as the blow.
Repeat the procedure at least twice until three acceptable and repeatable blows are
obtained. Maximum of 8 efforts
There should be three readings, of which the best two are within 150 ml or 5% of
each other and best.
The numbers appear as a table of actual and predicted figures together with volume–
time and flow–volume traces. The best readings of FEV1 and FVC are usually recorded.
Spirometer with real-time traces and printouts are taken as they provide helpful
information about the quality and acceptability of the blows8,9.
I
NTERPRETATION OF SPIROMETRY:
It involves looking at the absolute values of FEV1, FVC, and FEV1/FVC,
comparing them with predicted values, and examining the shape of the spirograms.
Patients should complete three blows that are consistent and within 5% of each other.
In a patient with normal lung function, the volume–time curve should rise rapidly
29 obstruction, it takes longer to blow out the air—up to 15 seconds—and the upward slope
of the spirogram is much less steep8,9.
V
ARIABLES UNDER THE STUDYIn this study, a structured Proforma was used to collect clinical and laboratory
values. The variables such as Age of the antenatal woman, gestational age in weeks,
parity, whether they received Inj.TT and Iron Folic acid tablets, Weight (kgs), Height
(cm), Blood Pressure and spirometric values were collected. BMI was calculated with the
formula weight / (Height)2, Pulmonary Parameters FVC, FEV1, FEVI/FVC and PEFR
were measured.
S
TATISTICALA
NALYSIS:
The data were entered in MS Excel and analyzed in SPSS software 20v. Mean
and Standard deviations were calculated for quantitative variables and percentages for
categorical values.
The comparisons were assessed by one-way Analysis of Variance at 5% level of
significance among the trimester for pulmonary parameters. Chi-square test was used to
find the association between parity and trimester at 5% level of significance.
30
RESULTS
---31
RESULTS
Table 1: Age Distribution of Antenatal Mothers
Trimester
Chi Sq p value Age First Second Third Total
<20 years 4 2 3 9
1.43 0.8
21 – 30 Years 20 24 22 66
>31 Years 6 4 5 15
Total 30 30 30 90
In this study, 90 subjects were selected considering 30 equal samples in each
group. Their age ranged from 18 years to 34 years overall. Table 1 describes the
distribution of age among the three trimesters 66 subjects were in the age group of 21
years to 30 years. There is no significant difference between the groups by chi-square test
32 Their mean age was described in table 2. Mean age in the first trimester was 26.1
± 4.7, Second trimester 24.8 ± 4.4 and in the third trimester 25.13 ± 4.61. There is no
significant difference between the groups by Analysis of variance. (p = 0.5).
33
Table 2: Comparison of Mean age between the three trimesters
among pregnant women
Trimester Mean SD F P Value
First 26.10 4.70
0.654 0.5
Second 24.80 4.40
Third 25.13 4.61
Graph 2: Comparison of Mean age between the three trimesters
34
Table 3: Comparison of Mean Weight (kgs) between the three
trimesters among pregnant women
Variables Trimester Mean SD F Sig.
WEIGHT (Kg)
First 54.50 7.93
17.024 0.0001
Second 62.53 9.46
[image:45.595.123.507.197.309.2]Third 66.50 6.73
Table 3 shows the anthropometric measurements such as weight Height and BMI
were calculated. Table 3 shows the mean Weight (kgs) across the three groups. Mean
weight 54.5 ± 7.93, 62.53 ± 9.46 and 66.5 ± 6.73 for first second and third trimesters
respectively which showed a significant difference by One-way ANOVA (F = 17.024, p
35
Graph 3: Comparison of Mean Weight (kgs) between the three
36
Table 4: Comparison of Mean Height (cm) between the three trimesters
among pregnant women
Variables Trimester Mean SD F Sig.
HEIGHT (Cm)
First 155.87 7.48
1.471 0.235 Second 158.77 11.04
[image:47.595.129.505.227.340.2]Third 160.03 10.07
Table 4 shows the mean Height (cm) across the three groups. Mean Height 155.87
± 7.48, 185.77 ± 11.04 and 160.03 ± 10.04 for first second and third trimesters
respectively which showed no significant difference by One-way ANOVA (F = 1.471, p
37
Graph 4: Comparison of Mean Height (cm) between the three
38
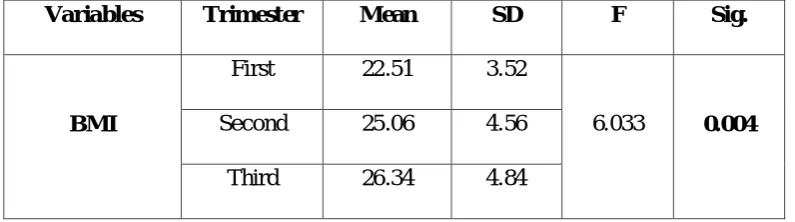
Table 5: Comparison of Mean Body Mass Index (BMI) between the
three trimesters among pregnant women
Variables Trimester Mean SD F Sig.
BMI
First 22.51 3.52
6.033 0.004
Second 25.06 4.56
[image:49.595.118.516.250.361.2]Third 26.34 4.84
Table 5 shows the mean Body Mass Index (BMI) across the three groups. Mean
BMI were 22.51 ± 3.52, 25.06 ±4.56 and 26.34 ± 4.84 for first second and third
trimesters respectively which showed statistically significant difference by One-way
39
Graph 5: Comparison of Mean Body Mass Index (BMI) between the
40
Table 6: Comparison of Mean Blood Pressure between the three
trimesters among pregnant women
BP Trimester Mean SD F Sig.
SBP
First 123.30 11.26
8.196 0.001
Second 131.07 6.22
Third 121.07 11.71
DBP
First 78.70 6.82
14.962 0.0001
Second 84.97 3.76
[image:51.595.135.498.222.417.2]Third 75.87 8.35
Table 6 shows the mean Blood Pressures among the three group study subjects.
Mean Systolic Blood Pressure 123.3 ± 11.26, 131.07 ± 6.22 and 121.07 ± 11.71 for first
second and third trimesters respectively which showed statistically significant difference
by One-way ANOVA (F = 8.196, p = 0.001).
Mean Diastolic Blood Pressure were 78.7 ± 6.82, 84.97 ± 3.76 and 75.87 ± 8.35
for first second and third trimesters respectively which showed statistically significant
difference by One-way ANOVA (F = 14.962, p = 0.0001). Graph 6 and 7 explains the
41
Graph 6: Comparison of Mean Blood Pressure between the three
42
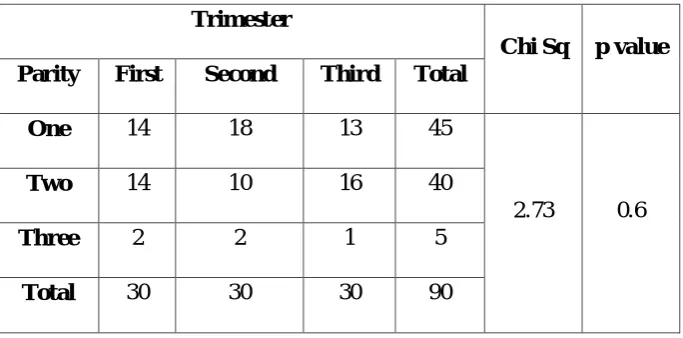
Table 7: Comparison of Parity between the three trimesters
among pregnant women
Trimester
Chi Sq p value Parity First Second Third Total
One 14 18 13 45
2.73 0.6
Two 14 10 16 40
Three 2 2 1 5
[image:53.595.146.488.221.390.2]Total 30 30 30 90
Table 7 describes the difference in study groups by parity which was not
statistically significant with chi-square test (p = 0.6). Table 8 shows subjects received
Injection TT and Iron-folic acid tablets during their follow ups. All the subjects were
43
Graph 7: Comparison of Parity between the three trimesters
among pregnant women
0 2 4 6 8 10 12 14 16 18
First Second Third
44
Table 8: Comparison of TT / IFT between the three trimesters
among pregnant women
Trimester First Second Third
Injection TT 30 30
Iron Folic Acid Tablets 30 30 30
Graph 8: Comparison of TT / IFT between the three trimesters among
45
Table 9: Comparison of FVC (%) between the three trimesters
among pregnant women
Variables Trimester Mean SD F Sig.
FVC %
First 93.37 6.14
3.501 0.034
Second 94.23 6.70
[image:56.595.145.487.195.309.2]Third 97.53 6.45
Table 9 shows the mean FVC% values among the three group study subjects.
Mean FVC values were 93.37 ± 6.14, 94.23 ± 6.7 and 97.53 ± 6.45 for first second and
third trimesters respectively which showed statistically significant difference by One-way
46
Graph 9: Comparison of FVC (%) between the three trimesters
47
Table 10: Comparison of FEV1(%) between the three trimesters
among pregnant women
Variables Trimester Mean SD F Sig.
FEV1 %
First 91.13 8.14
3.367 0.039
Second 91.63 9.00
[image:58.595.159.476.226.340.2]Third 96.00 6.66
Table 10 shows the mean FEV1% values among the three group study subjects.
Mean FEV1 values were 91.13 ± 8.14, 91.63 ± 9 and 96 ± 6.66 for first second and third
trimesters respectively which showed statistically significant difference by One-way
48
Graph 10: Comparison of FEV1(%) between the three trimesters
49
Table 11: Comparison of FEV1/ FVC(%) between the three trimesters
among pregnant women
Variables Trimester Mean SD F Sig.
FEV1/FVC ( %)
First 91.84 6.32
4.904 0.01
Second 93.19 6.47
[image:60.595.146.486.227.340.2]Third 96.66 5.64
Table 11 shows the mean FEV1/ FVC% values among the three group study
subjects. Mean FEV1/FVC% values were 91.84 ± 6.32, 93.19 ± 6.47 and 96.66 ± 5.64 for
first second and third trimesters respectively which showed statistically significant
difference by One-way ANOVA (F = 4.904, p =0.01). Graph 11 explains the differences
50
Graph 11: Comparison of FEV1/FVC (%) between the three trimesters
51
Table 12: Comparison of PEFR between the three trimesters
among pregnant women
Variables Trimester Mean SD F Sig.
PEF
First 99.15 4.62
9.965 0.0001
Second 100.51 5.49
[image:62.595.138.496.226.340.2]Third 104.80 5.21
Table 13 shows the mean PEFR values among the three group study subjects.
Mean PEFR values were 99.15 ± 4.62, 100.51 ± 5.49 and 104.8 ± 5.21 for first second
and third trimesters respectively which showed statistically significant difference by
52
Graph 12: Comparison of PEFR between the three trimesters
53
DISCUSSION
---54
DISCUSSION
The present cross-sectional study had an equal number of samples in
three-trimester groups group 1:up to 12 weeks, group 2 :13weeks to 28 weeks and group 3: 29
weeks to term. Most of the subject participants were in the mean age of 20 to 30 years.
The anthropometric measures weight, Height, and BMI were calculated. Height not
having any significant difference where in weight and BMI were statistically differing in
each trimester. As gestational age increases, there is a rise in weight and BMI which
correlating with previous studies as well.
During pregnancy, caloric intake increases to make the sure proper development
of the fetus. The amount of weight gained during a single pregnancy varies among
women. The overall pregnancy weight gain for women starting pregnancy at a normal
weight, with a BMI of 18.5 - 24.9 range from 11.4 to15.9 kg32
Gestational weight is a unique and complex biological phenomenon that supports
the functions of growth and development of the foetus. Gestational weight gain is
influenced not only by alterations in maternal physiology and metabolism but also by
placental metabolism. The placenta functions as an endocrine organ, a barrier, and a
transporter of substances between maternal and fetal circulation. Practitioners may
formulate different recommendations based on specific and individualized patient`s
needs, based on factors including low maternal age, nutritional status, foetal
development, and morbid obesity. During the antenatal period, insufficient or excessive
weight gain can compromise the health of the mother and fetus and also affect respiratory
55 The blood pressures both systolic and diastolic were also showed significant
difference due to the trimesters. There were increases in the second trimester,
third-trimester values more or less equal to first by Tukey’s multiple comparison tests.
In respiratory parameters, there was rising trend across the three trimesters of
FVC%, FEV1%, EFR and PEF values. Similar studies showed raise in these values.
These were due to the downward movement of the uterus, as the head of the fetus gets
engaged. It is generally observed that the breathlessness seen in the 3rd trimester of
antenatal period disappears near full term. This finding is consistent with other authors8, 9
PEFR was significantly increased in group 3 antenatal women. As PEFR is
muscular element it could be because of downward displacement of the diaphragm at full
term pregnancy. This finding is in agreement with other researchers10 At the same time
some authors have found that PEFR decreases throughout pregnancy6,7,11
Some studies showed a significant increase in Forced Vital Capacity (FVC) while
other studies showed a decline in FVC. They noticed a small but definite increase in the
vital capacity curve during the antenatal period from the third to the eighth month. They
observed, rise in the Vital Capacity during the last month of antenatal period20, 21.
Landt CK, Widlund G and Benjamin PR found a rise in Vital Capacity during the
antenatal period. Root , Cohen , Landt and others concluded that the Vital Capacity of the
lung is raised during pregnancy and the rise in VC noticed6. Rubin et al observed that
there is a decrease in Vital Capacity while Cugell felt that Vital Capacity remained
unchanged during pregnancy6. Howard G Knuttgen and Kendall E studied the
physiological changes during normal pregnancy. Pulmonary hyperventilation developed
56 Bernard J, Gee L , Bernard S Packer et al, studied about the Pulmonary
Mechanics during Pregnancy. They noticed that during late pregnancy, there is a 25%
decrease in FRC and about 40% decrease in ERV. The slight and statistically
insignificant decrease in total lung capacity and VC were also found in their study6. FVC
is maintained by the rise in inspiratory capacity.
The work was done by the study of Skandan KP, Mehta YB, Shah V, Parikh SR
et al showed an increase in Tidal Volume (TV) together with a decline in Expiratory
Reserve Volume (ERV) and Vital Capacity during antinatal period. Gazioglu K,
Kaltreider NL, Lehmann V and Fabel H found that during the antenatal period the
Inspiratory Capacity rises and the expiratory capacity is declines6.
Knox AJ, Petkova S et al, noticed a number of physiological alterations which
occurred during the antenatal period. At the end of the first trimester, Ventilation rose by
20-25% and was sustained throughout antenatal period6. A decline in the Residual
Volume (RV) and Functional Residual Capacity (FRC) was noticed. Also, Diaphragmatic
excursion, Vital Capacity, and Total Lung Capacity remained unchanged6.
It would have been more suitable if patients were recruited in the 1st trimester and
longitudinally followed up to delivery and six weeks postpartum to make sure of the
actual time it will take for these alterations to come back to normal. Moreover,
57
SUMMARY AND CONCLUSION
---58
SUMMARY AND CONCLUSION
The present study proved that the respiratory parameters are significantly altered
during pregnancy.
The increased FVC, PEFR, FEV1, and FEV1/FVC ratio is a strong indication
that pregnancy causes physiological adaptation in the lungs. Hormones determine
changes in smooth muscle tone and possibly connective tissue - elastance might occur
during pregnancy which probably alters the mechanical properties of the respiratory
system.
FVC increases significantly during the second trimester of gestation and
throughout pregnancy. FEV1/FVC% is significantly higher in Second and the third
trimester multiparous than primigravida women, suggesting that changes in FVC
occurring during pregnancy persist postpartum. PEFR increases significantly during
healthy pregnancies and should be interpreted cautiously in pregnant women with
impaired lung function
With the combination of increased oxygen consumption and the decreased
expiratory reserve volume due to the reduced functional residual capacity, rapid fall in
arterial oxygen tension despite careful maternal positioning and pre-oxygenation may
occur during labour and spinal anesthesia. Even with short periods of apnea, either from
obstruction of the airway or inhalation of a hypoxic mixture of gasses, the gravida has
little defense against the development of hypoxia.
Pregnant women with respiratory disorders should undergo lung function test
during labour to ascertain the degree of severity and to institute appropriate intervention.
59 attainment of Millennium Developmental goal 5 (Reduction in maternal mortality by 75
% by the year 2015).
Limitations of this study were the sample size which is small for cross-sectional
studies. Future studies need to do with large sample size and if funds and time feasible
then longitudinal studies would be better. PFT should be a part of the routine antenatal
60
REFERENCES
61
REFERENCES
1. Weinberger SE, Weiss ST, Cohen WR et al. Pregnancy and the lung. Am Rev Respir
Dis 1980; 121(3):559–81.
2. Goldsmith LT, Weiss G, Steinetz BG. Relaxin and its role in pregnancy. Endocrinol
Metab Clin North Am 1995;24(1):171–86.
3. Gilroy RJ, Mangura BT, Lavietes MH. Rib cage and abdominal volume displacements
during breathing in pregnancy. Am Rev Respir Dis 1988;137(3):668–72.
4. Ellegard EK. Pregnancy rhinitis. Immunol Allergy Clin North Am 2006;26(1):119–35,
vii.
5. Toppozada H, Michaels L, Toppozada M et al. The human respiratory nasal mucosa in
pregnancy. An electronic microscopic and histochemical study. J Laryngol Otol 1982;
96(7):613–26.
6. Shailaja Y, Srikanth S, Lung Function tests in different trimesters of pregnancy,
Indian Journal of Basic and Applied Medical Research; 2013, Vol.3(1): 285-292.
7. Zaid Al-Madfai, Respiratory Physiology
8. Spirometry for health care providers, Global Initiative for chronic obstructive lung
disease (GOLD)
9. Brusasco V, Crapo R, Viegi G, Standardisation of spirometry, Eur Respir J 2005; 26:
319–338.
10.Renzetti AD Jr. Standardization of spirometry. Am Rev Respir Dis 1979; 119: 831–
62 11. American Thoracic Society. Standardization of spirometry: 1987 update. Am Rev
Respir Dis 1987; 136: 1285–1298.
12. American Thoracic Society. Standardization of spirometry, 1994 update. Am J
Respir Crit Care Med 1995; 152: 1107–1136.
13. Quanjer PH, ed. Standardized lung function testing. Report Working Party
Standardization of Lung Function Tests. European Community for Coal and Steel.
Bull Eur Physiopathol Respir 1983; 19: Suppl. 5, 1–95.
14. Quanjer PH, Tammeling GJ, Cotes JE, Pedersen OF, Peslin R, Yernault J-C. Lung
volume and forced ventilator flows. Report Working Party Standardization of Lung
Function Tests, European Community for Steel and Coal. Official Statement of the
European Respiratory Society. Eur Respir J 1993; 6: Suppl. 16, 5–40.
15.Shailaja Y, Srikanth S, Lung Function tests in different trimesters of pregnancy,
Indian Journal of Basic and Applied Medical Research; 2013, Vol.3(1): 285-292.
16.Bende M, Hallgårde M, Sjögren U, Uvnäs-Moberg K. Nasal congestion during pregnancy. Clin Otol Allied Sci, 1989,14 (5):385-7.
17.Ellegård EK, The etiology and management of pregnancy rhinitis. Am J Respir
Med. 2003, 2(6):469-75.
18.Toppozada H, Michaels L, Toppozada M, El-Ghazzawi I, Talaat M, Elwany S,
The human respiratory nasal mucosa in pregnancy. An electron microscopic and
histochemical study. J Laryngol Otol 1982, 96:613-26.
19.Jenson D, Duffin J, Lam YM, Webb KA, Simpson JA, Davies GA, Wolfe LA,
O,Donnell DE, Physiological mechanisms of hyperventilation during human
63 20.Puranik BM, Kaore SB, Kurhade GA, Agrawal SD, Patwardhan SA, Kher JR, A
longitudinal study of pulmonary function tests during pregnancy. Indian J Physiol
and Pharmacol 1994, 38:129-132.
21.Mokkapatti R,Prasad EC,Venkatraman S ,Fatima K, Ventilatory functions in
pregnancy. Indian J Physiol Pharmacol, 1991, 35:237-40.
22.Chhbra S, Nangia V, Ingley KN, Changes in respiratory function tests during
pregnancy. Ind J Physiol Pharmacol, 1988, 32 (1):56-60.
23.Kolarzyk E, Szot WM, Lyszczarz J, Lung function and breathing regulation
parameters during pregnancy. Arch Gynecol Obstet, 2005, 272(1):53-8.
24.Sroczynski T, Evaluation of respiratory tract function in healthy women in the last
month of uncomplicated pregnancy. Ann Acad Med Stetin, 2002, 48:331-50.
25.Rees GB, Roughton PF, Symonds EM, Patrick JM, A longitudinal study of
respiratory changes in normal human pregnancy with cross-sectional data on
subjects with pregnancy-induced hypertension. Am J Obstet Gynecol, 1990, 162
(3):826-30.
26.Liu CT, Lung function changes during pregnancy. Zhonghua Fu Chan Ke ZA Zhi,
1992, 27(2):84-5.
27.Brancazio LR, Laifer SA, Schwartz T, Peak expiratory flow rate in normal
pregnancy. Obstet Gynecol, 1997,89 (3):383- 6.
28.Salisu AI,Adelaiye AB,Babashani M, A formula for predicting Peak Expiratory
Flow Rate in non Pregnant and Pregnant women in second and third trimesters of
pregnancy in Kura Local Government Area ,Kano state Nigeria. Research Journal
64 29.McAuliffe F,Kametas N, Costello J, Rafferty GF, Greenough A, Nicolaides K,
Respiratory function in singleton and twin pregnancy. Brit J Obstet Gynaecol,
2002, 109 (7):765-9.
30.Strauss A, Müller-Egloff S, Schwaiblmair M, Knitza R, Hepp H, Maternal
pulmonary function and dyspnea in multifetal pregnancies. Prenat Neonat Med,
2001, 6(4): 234- 41.
31.Von Ungern-Sternberg BS,Regli A,Bucher E,Reber A, Schneider MC, The
effect of epidural analgesia in labor on maternal respiratory function.
Anesthesia, 2004, 59 (4):350-3.
32.Broughton-Pipkin F, Maternal Physiology In; Dewhurst Textbook of
Obstetrics and Gynaecology.7th edition, Edmonds DK(Ed), Blackwell
Publishing Oxford. 2007, PP 10-18.
33.Grindheim G, Toska K, Estensen M, Rosseland L. Changes in pulmonary function
65
ANNEXURES
66
PATIENT CONSENT FORM
Title of the study :
A
SSESSMENT OF PULMONARYF
UNCTION BY SPIROMETRY IN ANTENATAL CASESName : Date :
Age : OP No :
Sex : Individual ID No:
:
The details of the study have been provided to me in writing and explained to me in my
own language.
I confirm that I have understood the above study and had the opportunity to ask
questions.
I understand that my participation in the study is voluntary and that I am free to withdraw
at any time, without giving any reason, without the medical care that will normally be
provided by the hospital being affected.
I agree not to restrict the use of any data or results that arise from this study provided
such a use is only for the scientific purpose(s).
I have been given an information sheet giving details of the study.
I fully consent to participate in the above study.
67
Ra xg;Gjy; gbtk;
Ma;T nra;ag;gLk; jiyg;G :
Ma;T nra;ag;gLk; ,lk; :
gq;F ngWNthhpd; ngah; :
gq;F ngWNthhpd; taJ : gq;F ngWNthhpd; vz; :
NkNy Fwpg;gpl;Ls;s kUj;Jt Ma;tpd; tpguq;fs; vdf;F tpsf;fg;gl;Ls;sJ. ehd; ,t;tha;tpy; jd;dpr;irahf gq;Nfw;fpd;Nwd;. ve;j fhuzj;jpdhNyh ve;j rl;lr;rpf;fYf;Fk; cl;glhky; ehd; ,t;tha;tpy; ,Ue;J tpyfpf; nfhs;syhk; vd;Wk; mwpe;J nfhz;Nld;.
,e;j Ma;T rk;ge;jkhfNth ,ij rhh;e;J NkYk; Ma;T Nkw;nfhs;Sk; NghJk; ,e;j Ma;tpy; gq;FngWk; kUj;Jth; vd;Dila kUj;Jth; vd;Dila kUj;Jt mwpf;iffis ghh;g;gjw;F vd; mDkjp Njit ,y;iy vd mwpe;J nfhs;fpNwd;. ,e;j Ma;tpd; %yk; fpilf;Fk; jftiyNah KbitNah gad;gLj;jpf; nfhs;s kWf;f khl;Nld;.
,e;j Ma;tpy; gq;F nfhs;s xg;Gf; nfhs;fpNwd;. ,e;j Ma;it Nkw;nfhs;Sk; kUj;Jt mzpf;F cz;ikAld; ,Ug;Ngd; vd cWjpaspf;fpNwd;.
gq;Nfw;gthpd; ifnahg;gk; rhl;rpahshpd; ifnahg;gk;
,lk;: ,lk;:
68
PROFORMA FOR PATIENT DETAILS
NAME:
AGE : D.O.B: OP.NO.:
INDIVIDUAL ID. NO: ADDRESS:
HISTORY:
LMP: EDD
GRAVIDA: PARA: LIVE: ABORTION: PAST HISTORY :
FAMILY HISTORY:
DRUG HISTORY: IMMUNISATION:
IRON & FOLIC ACID SUPPLEMENTATION: GENERAL EXAMINATION:
HEIGHT: WEIGHT: BMI:
69
MASTER CHART
70 S.NO Trimester NAME AGE Parity SBP DBP TT/IFT (Kg) WT (Cm) HT BMI (Lit) FVC FVC % FEV1 (Lit) FEV1 % FEV1/FVC ( %)
1 1 SRILAKSHMI GAYATHIRI 22 1 110 70 1 63 163 23.7 2.74 95 2.52 99 92
2 1 GAYATHRI 27 2 120 80 1 50 150 22.2 2.76 107 2.43 104 93
3 1 BRINDHA 18 1 120 70 1 38 158 15.2 2.7 90 2.25 86 99
4 1 VINODHINI 20 1 130 90 1 40 150 17.8 2.74 101 2.31 98 84.3
5 1 SANMATHI 21 1 130 80 1 50 155 20.8 3.07 106 2.59 103 84.4
6 1 SHABANA 22 1 120 80 1 72 152 31.2 2.28 82 2.04 84 106
7 1 VIJAYA 26 2 110 80 1 62 164 23.1 3.08 96 2.78 99 90.3
8 1 MAGESHWARI 26 2 126 80 1 63 155 26.2 2.53 88 2.26 90 106
9 1 RATHIKA 27 1 130 90 1 65 164 24.2 2.91 91 2.41 87 99
10 1 VIJAYALAKSHMI 28 2 130 80 1 75 150 33.3 2.02 77 1.81 79 107
11 1 DHAKSHAYINI 30 2 120 80 1 57 154 24 2.34 85 1.98 83 101
12 1 VANTHY 30 2 130 80 1 55 148 25.1 2.51 100 2.06 94 98
13 1 POONGKODI 31 2 120 70 1 57 156 23.4 2.58 92 1.99 82 93
14 1 SUDHA 32 2 120 80 1 73 165 26.8 2.6 83 2.25 83 86.5
15 1 JAYANTHI 22 2 130 90 1 71 158 28.4 2.22 78 1.95 79 87.8
16 1 RADHIKA 32 2 120 70 1 71 156 29.2 2.66 96 2.16 90 98
17 1 KAVITHA JAYARAMAN 34 2 130 81 1 80 154 33.7 2.03 77 1.61 70 80.1
18 1 KAVITHA 24 1 120 70 1 52 147 24.1 2.08 87 1.75 85 84.1
19 1 BAVITHRA 34 2 130 90 1 68 182 25.5 2.7 91 2.17 84 97
20 1 SENTHAMIL 25 1 130 80 1 79 151 34.6 1.88 75 1.71 79 91
21 1 PERIYAMMAL 30 1 120 80 1 52 145 24.7 2.5 110 2.13 109 103
71 S.NO Trimester NAME AGE Parity SBP DBP TT/IFT (Kg) WT (Cm) HT BMI (Lit) FVC FVC % FEV1 (Lit) FEV1 % FEV1/FVC ( %)
23 1 RADHIKA 27 1 130 80 1 65 164 24.2 2.91 91 2.41 87 99
24 1 VANAJARANI 31 2 120 80 1 57 156 23.4 2.58 92 1.99 82 93
25 1 NIVETHA 21 1 120 80 1 50 155 20.8 3.07 106 2.59 103 84.4
26 1 SANGEETHA 30 2 150 80 1 55 148 25.1 2.51 100 2.06 94 98
27 1 DHAYA 22 1 133 80 1 63 163 23.7 2.74 95 2.52 99 92
28 1 DEVI 27 2 140 80 1 50 150 22.2 2.76 107 2.43 104 93
29 1 SHAKTHI 18 1 100 70 1 38 158 15.2 2.7 90 2.25 86 99
30 1 KEERTHANA 20 1 90 60 1 40 150 17.8 2.74 101 2.31 98 84.3
31 2 RATHIKA 34 2 130 90 1 80 154 33.7 2.03 77 1.61 70 80.1
32 2 RANI 22 1 130 80 1 72 152 31.2 2.28 82 2.04 84 106
33 2 POONGKODI 26 2 140 90 1 62 164 23.1 3.08 96 2.78 99 90.3
34 2 SHAMUGI 34 2 140 89 1 68 182 25.5 2.7 91 2.17 84 97
35 2 VENI 22 1 136 88 1 71 158 28.4 2.22 78 1.95 79 87.8
36 2 NAYAGI 28 2 126 81 1 75 150 33.3 2.02 77 1.81 79 107
37 2 RENUGA 30 2 130 85 1 57 154 24 2.34 85 1.98 83 101
38 2 MONISHA 25 1 126 84 1 79 151 34.6 1.88 75 1.71 79 91
39 2 SOWNDARI 30 2 131 85 1 52 145 24.7 2.5 110 2.13 109 103
40 2 ARCHANA 32 2 129 85 1 73 165 26.8 2.6 83 2.25 83 86.5
41 2 RAJEE 24 1 124 84 1 52 147 24.1 2.08 87 1.75 85 84.1
42 2 RAJALAKSHMI 32 2 132 86 1 71 156 29.2 2.66 96 2.16 90 98
43 2 VANI 21 1 140 90 1 70 155 29.14 2.08 87 1.75 85 84.1
44 2 NITHIYA 24 1 128 82 1 34 153 14.52 2.7 91 2.17 84 97
45 2 MAHESWARI 24 1 132 86 1 75 168 26.57 2.74 101 2.31 98 84.3
72 S.NO Trimester NAME AGE Parity SBP DBP TT/IFT (Kg) WT (Cm) HT BMI (Lit) FVC FVC % FEV1 (Lit) FEV1 % FEV1/FVC ( %)
47 2 VASUGI 23 1 138 88 1 70 166 25.40 2.53 88 2.26 90 106
48 2 PAVITHRA 22 1 130 85 1 50 174 16.51 2.5 110 2.13 109 103
49 2 SUGUMARI 19 1 126 82 1 78 170 26.99 2.58 92 1.99 82 93
50 2 LOGANAYAGI 21 1 125 85 1 50 165 18.37 2.66 96 2.16 90 98
51 2 RENUGA 21 1 130 85 1 51 155 21.23 2.51 100 2.06 94 98
52 2 PRIYA 24 2 130 85 1 52 148 23.74 2.74 95 2.52 99 92
53 2 MARGRET 24 1 138 88