Provision for learners
aged 14–16 in the
further education sector
an initial analysis
Brian Styles and Mick Fletcher
Provision for learners aged 14 – 16
in the further education sector
Contents
Page• Executive summary 3
• Summary findings
Sample characteristics 5
Rate of growth in pre-16 provision in colleges 5
Subject choice and study time 5
Profile of pupils attending pre-16 provision in colleges 5
Funding pre-16 provision in colleges 6
Benefits and concerns associated with pre-16 provision 7
• Detailed findings
Section 1: Profile of colleges responding. 8 Section 2: Rate of growth in pre-16 provision in colleges. 9 Section 3: Subject choice and study time. 10 Section 4: Profile of pupils attending pre-16 provision in colleges. 11 Section 5: Funding pre-16 provision in colleges. 13 Section 6: Benefits and concerns associated with pre-16 provision. 17
• Conclusions 20
• Appendix 1: Questionnaire and covering letter 21
• Appendix 2: Areas for further research 27
Executive summary
This research is based on a postal survey of all colleges in the further education sector, carried out in the summer term 2005. The results are considered to be a reliable reflection of the views and experiences of the whole FE sector in relation to colleges’ experience with pre-16 vocational courses.
The research confirms that the Increased Flexibility initiative has had a significant impact on the number of Year 10 and Year 11 pupils attending vocational courses at FE colleges as part of their Key Stage 4 studies. It also confirms the wide range of subjects studied, and that the majority of the pupils are taking courses that lead to nationally recognised qualifications. In addition to these positive trends, the survey identified a number of significant issues that could adversely impact on the
sustainability of growth in this provision.
The major concerns identified are as follows.
• Colleges appear to be cross-subsidising their pre-16 activities to a considerable extent. Using the financial assumptions described in Appendix 3, the deficit for 72 colleges that provided complete data was estimated at £33 million. This
compares with the income they received from schools/LEAs, the LSC and other sources of £19.263 million; i.e. only about 36% of the total cost of their pre-16 provision is being met from additional income. Even at the level of direct costs (ignoring overheads), the cross-subsidy was estimated at £6.908 million, which represents 26.4% of the direct costs they identified against this provision.
• The 132 colleges returning the questionnaire represent around a third of the sector. There is no reason to suppose that colleges that offered no 14–16 provision were less likely than average to return the questionnaire; indeed, a nil return required considerably less effort. A rough scaling up therefore suggests that there could be an overall shortfall of the order of £100 million per year.
• Within these overall percentages there are major differences in the performance of individual colleges. However, only 22 of the 72 colleges reported costs and revenues that produced a positive contribution to overheads from pre-16 courses and, once the formula for overheads was applied, only four colleges were shown to be in surplus. Despite significant variability, therefore, the current funding model appears to be unsustainable.
• This conclusion is supported by the fact that more than two-thirds of the respondents identified as their major concern that the additional income they received failed to cover the full cost of the provision. If this view is seen in the context of growing pressures on both school and college funding and the short term nature of present LSC and EU funding, it is difficult to be confident that further growth will be financially supportable.
• To inform future debates on funding, more research is needed to better understand the current cost and funding structure associated with pre-16
However, the success of the LSC’s strategy of working with colleges to improve the quality and reduce the quantity of their facilities threatens the spare capacity that often accommodates pre-16 courses. When this pressure to improve
utilisation is coupled with the fact that most colleges cross-subsidise their pre-16 provision, it is not difficult to envisage a situation developing within which some colleges decide to reduce or eliminate pre-16 courses.
• Maintaining a college’s ‘adult ethos’: when the colleges were asked to consider seven concerns associated with pre-16 provision and classify each as of ‘major’, ‘minor’ or of ‘no concern’ to them, there were two significant differences in the responses from the 18 largest providers, compared with the sample as a whole. These were in respect of the following concerns:
• significant numbers of pre-16 learners tend to undermine the college’s ‘adult ethos’
• schools generally use the courses as a ‘dumping ground’ for pupils they find difficult to control.
Summary findings
Sample characteristics
The 132 colleges responding to the survey constitute a reasonably representative sample of the whole sector in terms of location, scale of operations and mission. A full breakdown of their characteristics is presented in Section 1. The analysis of the responses thus provides a reliable guide to the pattern of pre-16 provision in colleges and their developing attitudes to it.
Rate of growth in pre-16 provision in colleges
Since 2002/03, the rate of growth has been prodigious. For the colleges responding to the questionnaire, the number of qualification aims studied increased over the period 2002/03 to 2004/05 by 144% for nationally recognised qualifications and 36% for other qualifications. This growth occurred across all levels but was particularly strong for Entry and Level 2. A further analysis of the growth rates is available in Section 2. The one perhaps surprising aspect of these results is the continued growth in the number of pupils taking qualifications without national recognition. Although this provision has grown at a much slower rate than that for nationally recognised qualifications, a reduction might have been expected given the strong pressure from government, LSC and schools in that direction.
Subject choice and study time
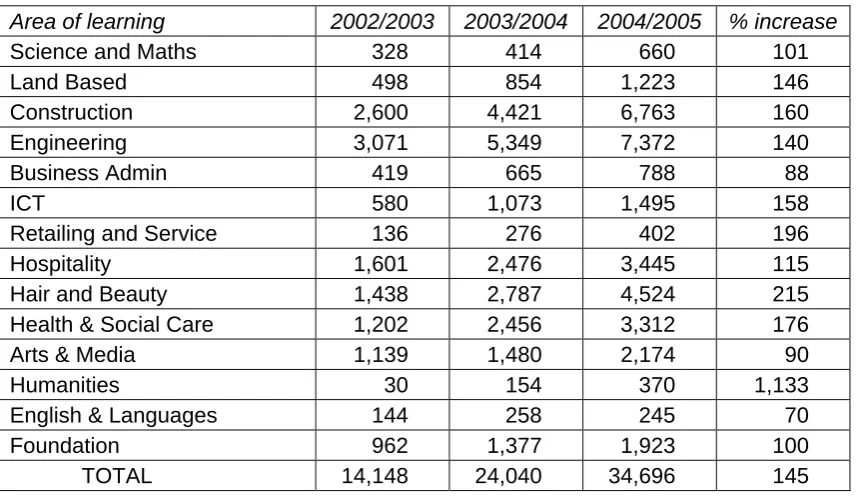
The rapid growth in the number of qualification aims studied has been spread across the full 14 areas of learning. However, in absolute terms, the traditional vocational areas remain the most popular, with the top three – Engineering, Construction, and Hairdressing and Beauty Therapy – accounting for nearly 54% of all the qualification aims studied. A full breakdown by area of learning is provided in Table 3(a) below.
The attendance at college is predominantly for one day per week or less. This accounts for 88% of the total, with 48% studying for a half day or less and 40% for between a half and a whole day per week. However, of the 97 colleges with pre-16 pupils, 68 reported having pupils for more than one day a week, and 37 of these had some pupils attending for more than three days. This latter group represented 1,281 pupils, who are likely to be on full-time college placements whether or not they have been formally withdrawn from mainstream schooling.
Profile of pupils attending pre-16 provision in colleges
The analysis in section 4 suggests that, as the take-up of vocational pre-16 courses has increased, the pupil profile has broadened in terms of pupil engagement,
behaviour and academic level. The analysis challenges the traditional stereotype that held that the college-based vocational programmes were only suitable for the pupils who were disaffected and/or performed poorly within the normal Key Stage 4
validity of this conclusion, and to identify which of the integration models are working best in terms of improved pupil engagement and performance and cost effectiveness.
Funding pre-16 provision in colleges
Section 5 explores in detail the income and expenditure associated with the delivery of pre-16 vocational courses. The most striking finding of the analysis is the very high levels of cross-subsidy colleges provide to sustain this provision. In respect of the sub-group of 72 colleges for which sufficient data was available, there was a £6.908 million shortfall when additional income received was compared with the direct costs incurred in its delivery. When overheads were added this shortfall increases to £33 million. (The LSDA Understanding Costs study for the LSC shows that overhead costs constitute at least half of total college expenditure.) Even if a lower rate of 25% were to be used, the level of cross-subsidy is huge when compared with other sources of funding:
£000
Estimated direct expenditure 26,171
Estimated overheads 26171
Total costs 52342
Income received: £000 %
Schools and LEAs 9,988 19.1
LSC 8,403 16.1
Other 874 1.7
Colleges cross-subsidy 33077 63.2
Total 52342
In both percentage and absolute terms, cross-subsidies for pre-16 provision at this level look unsustainable given the funding constraints within which colleges operate. However committed to this provision colleges may be, it is difficult to see that they will be able to afford to continue at the current level, let alone expand further. The detailed analysis in Section 5 explores whether the variability between colleges’ financial performance can be explained in terms of volume or the nature of the income streams available to fund the provision. The data received shows that:
• No systematic relationship could be shown between the volume delivered, measured in guided learning hours (GLH), and the deficit/surplus per GLH.
• LSC funding for this provision tends to benefit those colleges delivering lower numbers of GLH. This tendency is not consistent in its effect but reflects the impact of funding associated with the Increased Flexibility initiative. This funding is available at a number of discrete levels, but the allocation is not directly linked to the actual volume delivered. The result of this approach is that large providers tend to receive less per GLH than those delivering smaller numbers.
• There were very significant variations in the income per GLH that colleges received from their partner schools and LEAs. Moreover, no systematic relationship was found to exist between the volume of provision a college
have developed and agreed charges that vary greatly but are generally too low to support current provision let alone future growth.
The differences between the 22 colleges reporting positive contributions and the other 50 are shown in Table 5(a). Although this analysis revealed some interesting differences at the group level, the variations within groups were too large to allow reliable conclusions to be drawn. Given this lack of clarity it is important that the veracity of their data, particularly the cost estimates, is checked. This will enable the research to identify those colleges that have definitely achieved a sustainable financial model to be identified and their approach understood.
The single most worrying feature of this analysis is that the current contribution of schools and LEAs to the total cost of pre-16 provision is estimated at less than 20%. This suggests that without significant additional government funding and/or the development of a Key Stage 4 option model that enables schools to reduce their staff to release money to fund college courses, further growth in this provision will not occur. In fact, the continued pressure on college and school funding could result in the current level of activity being reduced by colleges to save money.
Benefits and concerns associated with pre-16 provision:
The survey also explored what benefits and concerns colleges associated with the pre-16 provision. The respondents as a whole considered the four major benefits to be:
• ‘improved relationships with local schools’ (97%) • ‘is part of the college’s social mission’ (72%)
• ‘helps improve the retention and achievement of those who subsequently enrol’ (69%)
• ‘improves college recruitment’ (63%).
The only significant difference between the overall responses and those for the largest 18 providers was for ‘improves college recruitment’: 86% of the sub-group indicated this as a major benefit, compared with 63% for the total sample. This difference could suggest that a significant driver of growth in these cases was a need or ambition to increase their 16 to 18-year-old learner numbers.
The other three potential benefits listed on the survey were seen as either minor, in the cases of staff development and additional income, or of no benefit in the case of using spare capacity. This last classification serves to underline the capacity
problems colleges may face if they wish to increase provision for pre-16 learners.
In respect of potential concerns, for more than two-thirds of the respondents the major concern was that ‘the full cost (direct costs and overheads) of the provision is not covered by the additional income received’. For the respondents as a whole, no other concern was identified as ‘major’ by more than 37%.
Detailed findings
Section 1: Profile of colleges responding
The questionnaire (reproduced as Annex 1) was sent to all the further education colleges in England. There were 132 responses, although in some cases the data provided was incomplete. This meant that the number of colleges included in each section of the analysis varies. In each case the number of valid returns is indicated. The initial analysis, based on question 1, analysed the profile of the 132 colleges in order to determine whether it was a reasonably representative sample of the whole sector.
Table 1(a) Colleges responding: mission
College mission
Total responses
Plan to offer provision in
2005/06
No plans to offer provision in
2005/06
Sixth form colleges 27 17 10
General FE colleges 86 85 1
Tertiary colleges 12 12 0
Specialist colleges 7 7 0
132 121 11
Table 1(b) Colleges responding: 2004/05 budget
College budget (2004/05)
Total responses
Plan to offer provision in
2005/06
No plans to offer provision
in 2005/06
Less than £10 million 52 41 11
£10 – £15 million 27 27 0
£15 – £20 million 13 13 0
£20 – £25 million 13 13 0
£25 – £30 million 8 8 0
Over £30 million 19 19 0
132 121 11
Table 1(c) Colleges responding: catchment areas
College catchments
Total responses
Plan to offer provision in
2005/06
No plans to offer provision in
2005/06
Totally urban 30 26 4
Mainly urban 30 26 4
Mixed urban/rural 55 52 3
Mainly rural 15 15 0
Remote rural 2 2 0
These profiles, together with a wide range of geographical locations, led the researchers to conclude that the sample constituted a reasonable sub-set of the sector as a whole. The findings are thus likely to give reasonably sound insights into pre-16 provision in England.
Section 2: Rate of growth in pre-16 provision in colleges
Question 5 asked colleges to report their actual pupil numbers for the three years 2002/03 – 2004/05 and to project forward for 2005/06 and 2006/07. A significant minority of the colleges were unable to provide the projected numbers, which limits the usefulness of any direct comparisons between actual recruitment in 2002/03 – 2004/05 and projected intakes for 2005/06 and 2006/07. The subsequent analysis looks at the actual figures for 2002/03 – 2004/05.
Table 2(a) Number of registrations for courses that do not lead to a nationally recognised qualification
Entry level Other Total
2002/03 1,074 3,843 4,917
2003/04 1,100 4,228 5,328
2004/05 1,129 5,576 6,705
% increase over the
three years 5 45 36
Table 2(b) Number of registrations for nationally recognised qualification aims, by level
Entry level Level 1 Level 2 Level 3 Total
2002/03 1,762 6,741 2,178 62 10,743
2003/04 2,469 9,943 4,332 201 16,945
2004/05 5,228 14,718 5,966 354 26,266
% increase over
the three years 196 119 1,174 471 144
These tables confirm the significant impact of the Increased Flexibility initiative on the number of pre-16 learners undertaking qualifications at colleges. It also underlines the growth of registrations for nationally recognised qualifications relative to those without national recognition. The only slightly surprising finding is that overall demand for the latter has continued to grow, albeit at a slower rate, despite the pressures to the contrary from government and schools.
Table 2(c) Projected intakes for 2005/06 and 2006/07
2002/ 03
2003/ 04
2004/ 05
2005/ 06
2006/ 07
% increase 2004/05 – 2006/07
Entry level 251 120 127 155 207 63.0 No qualification
aim Other 2,330 2,017 3,153 3,277 3,154 Nil
Entry level 977 1,327 1,704 1,275 1,239 (27.3) Level 1 4,087 4,460 5,557 6,355 6,875 23.7 Level 2 1,098 1,805 2,450 3,228 3,696 50.9 Nationally
recognised qualifications
Level 3 49 164 317 397 387 25.2
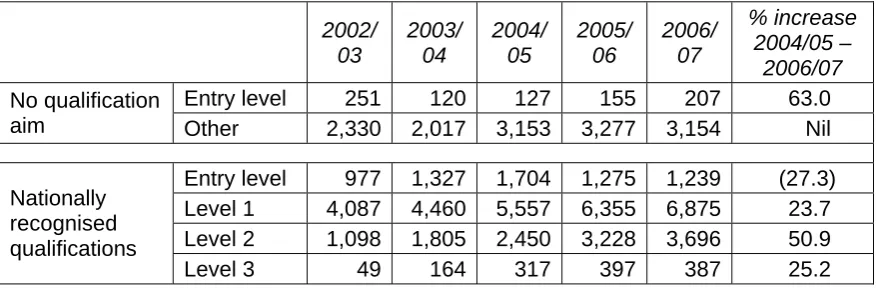
The figures in Table 2(c) show that these colleges expect that provision leading to awards without national recognition will remain at about the level delivered in 2004/05. For provision leading to nationally recognised awards:
• Entry level will decline significantly in 2005/06 and be maintained near that lower level in 2006/07.
• Level 1 will continue to grow, but at a slowing rate; 2003/04 – 2004/05 at 24.6%; 2004/05 – 2005/06 at 14%; and 2005/06 – 2006/07 at 8%.
• Level 2 will grow strongly in 2005/06 (31.7%), but more weakly in 2006/07 (12.6%).
• Level 3 will grow slowly from a moderate base.
The relatively small number of colleges providing this data and its projected nature reduce its reliability. However, it does show that further growth is expected, but not at the high rates achieved between 2002/03 and 2004/05. Given the number of pupils that could potentially benefit from this provision, growth rates at the level envisaged by these colleges could mean the demand for places will exceed supply.
Section 3: Subject choice and study time
Question 2 explored the form of the college provision i.e., whether it was
curriculum widening or tasters/master classes. 109 of the respondents indicated that they offered curriculum widening programmes and a large majority of these also offered short courses as tasters. A small number of the colleges offered full-time study opportunities to pre-16 students that had become disaffected at school. The majority of these students were integrated within the college’s post-16 provision. The majority of the 109 organised their pre-16 curriculum widening programmes in
discrete groups with only 27 indicating that they used a mixture of discrete groups and integration with post-16 groups.
[image:10.595.85.524.90.235.2]Table 3(a) Number of qualification aims by area of learning
Area of learning 2002/2003 2003/2004 2004/2005 % increase
Science and Maths 328 414 660 101
Land Based 498 854 1,223 146
Construction 2,600 4,421 6,763 160
Engineering 3,071 5,349 7,372 140
Business Admin 419 665 788 88
ICT 580 1,073 1,495 158
Retailing and Service 136 276 402 196
Hospitality 1,601 2,476 3,445 115
Hair and Beauty 1,438 2,787 4,524 215
Health & Social Care 1,202 2,456 3,312 176
Arts & Media 1,139 1,480 2,174 90
Humanities 30 154 370 1,133
English & Languages 144 258 245 70
Foundation 962 1,377 1,923 100
TOTAL 14,148 24,040 34,696 145
Question 4 asked colleges to analyse the pupils attending their pre-16 provision by the weekly period of their attendance. This data, provided by 97 of the respondents, covered 31,987 pupils and gave the following attendance breakdown.
Table 3(b) Period of attendance
Period of attendance
Up to a half day
More than half – 1 day
1–2 days 3 days or more
Total
Number of pupils 15,473 12,624 2,609 1,281 31,987
% of total 48 40 8 4
As would be expected, a large majority (nearly 88%) attend for one day or less per week. However, of the 97 colleges with pre-16 pupils, 68 reported that they had some pupils for more than one day per week, and 37 of these had pupils attending for more than three days per week. In most cases, this latter group of pupils will be ‘full-time’ at the college, whether or not they have been formally withdrawn from mainstream schooling.
Section 4: Profile of pupils attending pre-16 provision in
colleges
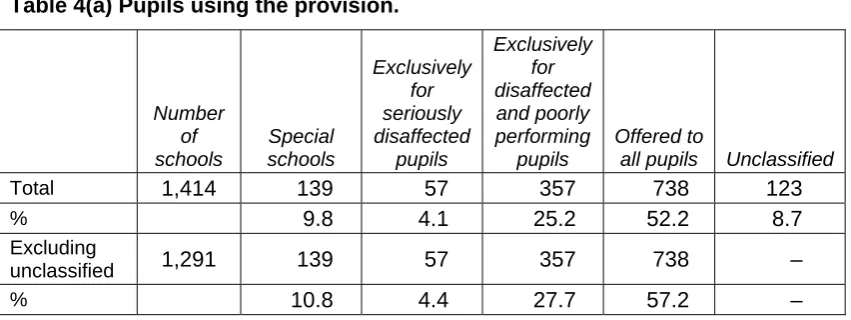
[image:11.595.85.514.88.336.2]Table 4(a) Pupils using the provision. Number of schools Special schools Exclusively for seriously disaffected pupils Exclusively for disaffected and poorly performing pupils Offered to
all pupils Unclassified
Total 1,414 139 57 357 738 123
% 9.8 4.1 25.2 52.2 8.7
Excluding
unclassified 1,291 139 57 357 738 –
% 10.8 4.4 27.7 57.2 –
The comparable split for the 27 largest providers (over 400 pupils per week.
Number of schools Special schools Exclusively for seriously disaffected pupils Exclusively for disaffected and poorly performing pupils Offered to
all pupils Unclassified
Total 471 56 25 137 232 21
% 11.9 5.3 29.1 49.3 4.4
Excluding
unclassified 450 56 25 137 232
% 12.4 5.6 30.4 51.6
These findings challenge the stereotype that maintains that the vocational courses at colleges are primarily offered to pupils who are disaffected and/or performing poorly within the normal Key Stage 4 curriculum. The fact that the colleges have classified 57% of their partner schools as ‘offering the provision to all pupils’ suggests that a majority of these schools are offering college courses as an integral part of their Key Stage 4 curriculum options.
This result should be seen in the context of the responses to survey question 9, which asked colleges to classify a number of potential concerns as ‘major’, ‘minor’ or ‘of no concern’. One of the potential concerns given stated that ‘schools generally use the courses as a ‘dumping ground’ for pupils they find difficult to motivate and control’. Among the responding colleges, 33% indicated this was a major concern, 52% a minor concern, and 15% of no concern. These figures seem broadly to reflect the colleges’ classification of individual schools given above.
In considering this finding, it is important to recognise that these global percentages hide very significant differences at individual college level. Some respondents rated all or most of their partner schools as offering the provision to all pupils, while others rated all or most of their partners as using the courses ‘exclusively for disaffected and poorly performing pupils’. Further research is required to establish whether these significant differences at individual college level result from important differences in school practice or inconsistent classification of similar pupil groups.
[image:12.595.85.511.76.236.2]different from the overall average: 52% indicated it as a major concern, 39% a minor concern, and 9% of no concern.
These results suggest that as the take-up of vocational pre-16 courses offered by colleges has increased, the range of pupils participating has broadened. As a result, they are no longer largely attended by pupils making poor progress at Key Stage 4. It is important that more research is carried out to identify how these college courses are being integrated into Year 10 and Year 11 options. This integration is essential if pupils and their parents are to value the vocational options and see them as
desirable alternatives. As long as a significant number of schools continue to confine vocational options to their poorly performing pupils, the provision will be stigmatised as an inferior route to post-16 education and training.
Such an approach also places considerable pressure on the school’s funding. Only when the vocational provision is fully integrated into the Key Stage 4 options can savings be made by reducing the number of teachers employed to deliver the traditional curriculum. Where it is used as an alternative curriculum for a limited number of pupils, it will represent additional expenditure for which there are no compensating savings, thereby limiting its availability to pupils.
Section 5: Funding pre-16 provision in colleges
Of the 139 responses received, 42 colleges were either not involved in the delivery of pre-16 provision, or provided incomplete data on costs and/or income. A further 26 were excluded because their level of pre-16 provision was very small. This analysis concentrates on the remaining 72.
Main sources of income
The subset of 72 colleges identified in excess of £19 million as the income directly associated with their pre-16 provision. This was received from three main sources:
£000
Schools & LEAs 9,988 LSC 8,403 Other 874 Total 19,263
• Schools and LEAs: These two income streams have been amalgamated, because most of the income from LEAs is for individual excluded students who attend colleges full time rather than being reintegrated into another school.
• LSC: The majority of this funding is provided via the Increased Flexibility project. In some cases this is supplemented by local initiative funds.
• Other: The majority of this funding (£713,000) comes from EU grants. These were received by five of the colleges; the largest single grant was £300,000.
Relationship between income and estimated expenditure
The income identified by the 72 colleges for their pre-16 provision was considerably less than the associated direct costs. The collective figures for this group of colleges is as follows:
£000s
Estimated direct total expenditure 26,171 Identified additional income 19,263 Contribution to overheads (6,908)
Assessed overheads 26,171)
Estimated total deficit (33,079
The overhead of £26.171 million is based on the LSDA ‘Understanding Costs’ study, which has consistently shown that direct costs account for only half of college expenditure. If provision for 14 to 16-year-olds in FE is to be seen as other than a marginal activity, this is the figure that should be used to calculate the level of resource required. To do otherwise risks either diverting resources from other programmes or failing to provide needed re-investment.
Since some have argued that it might be seen as a marginal activity, however, a specific overhead rate has also been derived using £3.24 per guided learning hour (GLH). This produces an average overhead rate of 40% (£17.569m ÷ £43.740m). Even using this more modest estimate of the overhead element, the figures
demonstrate a substantial cross-subsidy in respect of the costs incurred in delivering pre-16 provision. The combined negative contribution of £6.908 million equates to 26.4% of the direct expenditure incurred by the 72 colleges. Even if the applicable overhead rate was as low as 25%, the position would be as follows:
£000
Estimated: Direct expenditure 26,117 Overheads @ 25% of total costs 8,724
Total costs 34,895
%
Income: Schools & LEAs 9,988 28.6
LSC 8,403 24.1
Other 874 2.5
College cross-subsidy 15,630 44.8
Total cost 34,895
The college subsidy is between 45% and 66%, depending on the overhead rate used. Of even more significance, the table shows that schools and LEAs as only contributing between 20% and 30% of the total costs of provision provided for their pupils.
Variations in performance
broad range of negative values. A detailed analysis of the colleges reveals the following differences in performance between the 22 and the remaining 50.
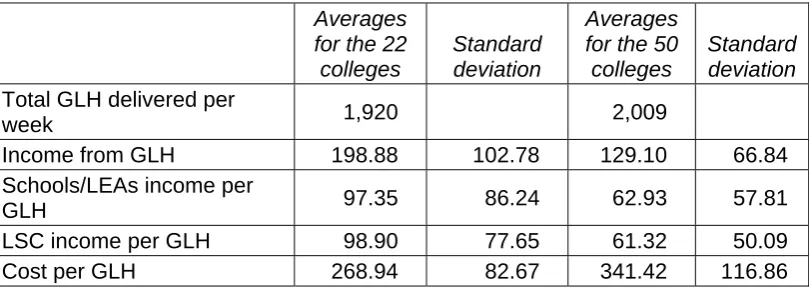
Table 5(a) The 22 colleges reporting positive contributions compared with the remaining 50
Averages for the 22
colleges
Standard deviation
Averages for the 50 colleges
Standard deviation
Total GLH delivered per
week 1,920 2,009
Income from GLH 198.88 102.78 129.10 66.84 Schools/LEAs income per
GLH 97.35 86.24 62.93 57.81
LSC income per GLH 98.90 77.65 61.32 50.09
Cost per GLH 268.94 82.67 341.42 116.86
The table illustrates the extent to which the financial characteristics differ between the two groups. The better financial results of the 22 are characterised by higher income, both from schools/LEAs and LSCs and from lower direct costs. Their average income is 54% greater and costs 21% lower than those reported by the other 50 colleges. However, the position within the 22 is by no means uniform, as the high standard deviations indicate. Closer inspection reveals that 7 of the 22 reported income below and 4 reported costs above the averages for the other 50. These very large variabilities within and between the two groups make it difficult to draw firm conclusions. A significant number of the 22 colleges reported very low direct costs per GLH, which could indicate under-reporting as well as greater efficiency.
These findings suggest that further checks on the data need to be made before firm conclusions can be drawn. Once overheads are included, even at a minimum 40% level very few colleges reported a surplus on their pre-16 provision and most providers were showing large deficits.
Comparison of the contribution per weekly GLH and the volume
delivered measured in GLHs per week
Table 5(b) Comparison of the contribution per GLH and delivery volumes
Number of GLHs per week
Contribution per GLH (£)
500 ↓ 999 1000 ↓ 1499 1500 ↓ 1999 2000 ↓ 2499 2500 ↓ 2999 3000 or more Total
200 – 100 2 1 1 4
+
99 – 0 2 5 5 1 2 3 18
1 – 99 3 12 8 4 4 5 36
100 – 199 1 3 1 1 4 10
200 – 299 1 1 2
300 – 399 1 1 2
-
Total 6 24 15 7 8 12 72
[image:15.595.89.494.140.286.2] [image:15.595.89.477.561.735.2]other 36 a negative contribution. It also illustrates that the contribution per GLH has no systematic relationship with the volume delivered.
Variability in income.
Tables 5(c) and (d) below explore in more detail the variability between colleges of income received from schools and LEAs and the LSC.
Table5(c) Relationship between LSC income per GLH and a college’s volume measured in GLHs
GLHs
LSC income per GLH (£)
500 ↓ 999 1000 ↓ 1499 1500 ↓ 1999 2000 ↓ 2499 2500 ↓ 2999 3000 or
more Total
Nil 1 3 1 1 6
1–49 2 2 2 3 6 10 25
50–99 6 12 2 2 1 23
100–149 2 4 1 1 8
150–199 1 5 6
200–249 4 4
Total 6 24 15 7 8 12 72
The distribution of the LSC funding shows a definite bias towards colleges delivering lower GLHs. For instance, of the 27 colleges delivering in excess of 2,000 GLHs, 77% receive less than £49 per GLH from the LSC. However, only 22% of colleges delivering below 2,000 GLHs receive less than £49. This difference reflects the impact of the funding associated with the Increased Flexibility initiative, which makes no attempt to reflect the volume each college delivers.
Table 5(d) Relationship between school and LEA income per GLH and a college’s volume measured in GLHs
GLHs
School/LEA income per GLH
£s 500 ↓ 999 1000 ↓ 1499 1500 ↓ 1999 2000 ↓ 2499 2500 ↓ 2999 3000 or more Total
Nil 1 2 1 1 5
1-49 1 5 6 2 3 6 23
50-99 3 6 7 3 2 3 24
100-149 6 1 1 1 1 10
150-199 1 3 1 1 6
200-249 1 1 2
250-299 1 1
300+ 1 1
Total 6 24 15 7 8 12 72
[image:16.595.85.508.539.713.2]LEAs. These disparities cannot continue if the proposed growth in the pre-16
provision colleges provide is to be met. The tables also underline the urgent need for research and debate on a national system for charging schools for pre-16
programmes delivered in colleges.
Section 6: Benefits and concerns associated with pre-16
provision
Question 8 asked respondents to consider seven factors that might influence their decisions on pre-16 provision and classify each of them as of major, minor or no benefit to them. The responses are presented as percentages in Table 6(a) below. Table 6(b) separates the responses of the 18 colleges with the largest number of equivalent learner days per week to explore whether their responses are at variance with those of the group as a whole.
Table 6(a) Benefits of pre-16 provision: all respondents
Major benefit
(%)
Minor benefit
(%)
No benefit
(%)
Improves college recruitment 63 33 4
Improves relationships with local schools 97 3 0
Is a source of additional income 6 42 52
Helps improve the retention and achievement
of those who subsequently enrol 69 28 3
Is part of the college’s social mission 72 26 2 Uses spare capacity within the college 1 19 80
Development of college staff 25 62 13
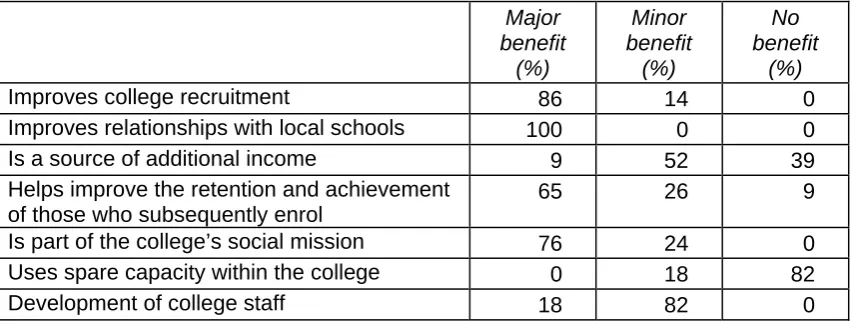
Table 6(b) Benefits of pre-16 provision: largest 18 colleges in terms of GLHs delivered
Major benefit
(%)
Minor benefit
(%)
No benefit
(%)
Improves college recruitment 86 14 0
Improves relationships with local schools 100 0 0
Is a source of additional income 9 52 39
Helps improve the retention and achievement of those who subsequently enrol
65 26 9
Is part of the college’s social mission 76 24 0
Uses spare capacity within the college 0 18 82
Development of college staff 18 82 0
The responses identify four major benefits to colleges of participation in pre-16 provision:
[image:17.595.88.515.298.464.2] [image:17.595.86.515.518.681.2]The responses of the 18 largest providers in the sample strongly reflect the views of the group as a whole. The only significant difference is that they give greater
emphasis to improved recruitment (86% against 63% classifying it as a major benefit). This difference may indicate that a stronger need or ambition to increase their 16 to 18-year-old learner numbers might drive the growth in their provision relative to that of others.
Compared with the strong support for the four benefits listed above, the benefit to staff development was seen as minor by the majority of colleges. Little benefit was seen in the pre-16 provision as either a source of additional income or as a means of achieving better utilisation of accommodation.
Question 9 asked respondents to consider seven concerns associated with pre-16 provision and classify each of them as of major, minor or no concern to them. The responses are presented as percentages in Table 6(c) below. Table 6(d) separates the responses of the 18 colleges with the largest number of equivalent learner days per week to explore whether their responses are at variance with those of the group as a whole.
Table 6(c) Concerns with pre-16 provision: all respondents
Major concern
(%)
Minor concern
(%)
No concern
(%)
Significant numbers of pre-16 learners tend to
undermine the college’s ‘adult ethos’ 14 58 28
The college finds it difficult to meet the statutory child protection requirements / its responsibilities for duty of care
14 59 27
The full cost (direct costs and overheads) of the provision is not covered by the additional income received
68 23 9
Their use of specialist workshops and staff
inhibits the growth of post 16 provision 37 43 20
Teaching and support staff do not feel that they have the specialist skills and experience required to successfully teach pre-16 learners
37 60 3
Schools generally use the courses as a
‘dumping ground’ for pupils they find difficult to motivate and control
33 52 15
Disproportionate use of management time to
Table 6(d) Concerns with pre-16 provision: largest 18 colleges in terms of GLHs delivered
Major concern
(%)
Minor concern
(%)
No concern
(%)
Significant numbers of pre-16 learners tend to
undermine the college’s ‘adult ethos’. 30 44 26
The college finds it difficult to meet the statutory child protection requirements / its responsibilities for duty of care
14 43 43
The full cost (direct costs and overheads) of the provision is not covered by the additional income received.
70 17 13
Their use of specialist workshops and staff
inhibits the growth of post 16 provision. 44 39 17 Teaching and support staffs do not feel that
they have the specialist skills and experience required to successfully teach pre-16 learners.
44 52 4
Schools generally use the courses as a
‘dumping ground’ for pupils they find difficult to motivate and control.
52 39 9
Disproportionate use of management time to
ensure collaboration works. 35 56 9
The majority of the responses identified only one major concern: the additional income received failed to cover the full cost of provision delivered. This was a major concern for more than two-thirds of respondents. As Table 6(c) indicates, no other factor was considered of major concern by much more than a third of the
Conclusions
The research confirms that the Increased Flexibility initiative has had a significant impact on the number of Year 10 and Year 11 pupils attending vocational courses at FE colleges as part of their Key Stage 4 studies. It also confirms the wide range of subjects studied, and that the majority of the pupils are taking courses that lead to nationally recognised qualifications. In addition to these positive trends, the survey identified a number of significant issues that could adversely impact on the
sustainability of growth in this provision.
The analysis of the questionnaire responses provided a great deal of useful information on and insights to pre-16 provision from a college perspective. The findings raise a number of important questions around funding, physical constraints and ethos erosion that could seriously inhibit further growth. To assist policy makers planning this critical element of the 14–19 strategy, it is important that these potential constraints are better understood.
Appendix 1: Questionnaire and covering letter
Dear
Questionnaire to inform the development and funding of 14–16 vocational programmes.
There is a growing consensus that colleges have a critical role, in collaboration with schools, in the development and delivery of a broader 14 – 16 vocational curriculum. Despite this recognition there is little firm evidence available on such basic questions as: what will the additional cost be for schools and colleges associated with its expansion?; is there sufficient specialist staff and facilities to meet the expected growth in the take-up of these programmes?; which collaborative models deliver the best outcomes for pupils and are financially sustainable? The absence of reliable answers to these questions poses insurmountable problems for those planning the further development of the vocational options.
This questionnaire is an important first step in closing this serious information gap. It is designed to collect information associated with the current level of college activity with 14–16 year olds, related costs and the impact of these courses on specialist college facilities, staff and post-16 students. The evidence and insights gained from the responses will be used to help inform forward planning by the sector, LSC and DfES. If the data collected is to be authoritative it is important that your colleges experience is included. A high overall response rate will give additional force to any evidence that supports the need for appropriate resourcing of this key development. Any information you provide will only be used to produce sector wide aggregates and no individual college data will be identifiable. A Steering Group is overseeing the research with representatives of LSDA, DfES, LSC, AOC, Ofsted and the Institute of Education.
The pressure on the time of college staff is recognised but given the importance of this research you are asked to seriously consider making the completion of this questionnaire a priority. It offers a real opportunity for colleges to be instrumental in policy making in this important area of development and to ensure that your
experience informs future planning. It is designed to be as easy to fill out as possible while collecting the necessary information. Please pass it to the appropriate member of your staff for completion. Your college will receive a summary of the findings once the analysis is complete.
Thank you for completing this questionnaire. A summary of the findings will be circulated to all colleges who respond. All published material will be anonymous. The findings will be investigated further through a number of more detailed individual college case studies. If you would be willing to participate in this second stage please indicate contact details.
Contact name:
Job Title:
College:
Email address:
Telephone:
14–16 provision in colleges
This is a questionnaire for an LSDA study into 14–16 provision in colleges. The study has been initiated to inform policy implementation relating to curriculum reform at 14+.
LSDA research manager: Mick Fletcher (Taunton office) Project consultant: Brian Styles
1. College details:
a) College name:
b) Type: ( ) Sixth form college ( ) General FE college ( ) Tertiary college ( ) Specialist college
c) Your LSC region(s):
d) Learner numbers (2004/05):
16-19 - FT - PT
Adult - FT - PT
e) Total budget income (2004/05):
( ) Less than £10m ( ) £10-£15m ( ) £15-£20m ( ) £20-25m ( ) £25-30m ( ) Over £30m
f) College catchment:
( ) Wholly urban ( ) Mainly urban ( ) Mixed urban / rural ( ) Mainly rural ( ) Remote rural
g) Type of 16 –18 provision in the college’s main catchment area:
( ) School sixth forms and general FE college/s only
( ) School sixth forms, sixth form college/s and general FE colleges ( ) Tertiary and/or general FE college/s only
( ) Other (please describe):
h) What is your college’s involvement in providing courses for school pupils aged 14 – 16?
Up to 2004 2004-5 2005-6 Future
( ) None ( ) None ( ) None planned ( ) None expected ( ) Involved ( ) Involved ( ) Planned ( ) Anticipated
If you have answered ‘none’ throughout or only ‘anticipated’ please return this page of the questionnaire as the analysis requires you to be included in the sample.
2. Type of provision
a) What type of 14–16 provision is your college involved in?
( ) curriculum widening with partner schools ( ) other e.g. tasters (please state what):
b) Is your 14–16 provision handled:
( ) mainly in discrete groups ( ) integrated with 16+ provision ( ) a mixture of both
3. Relationship with the partner schools:
a) Number of school pupils (individuals, not FTEs) involved in an average week:
( ) 0-49 ( ) 50-100 ( ) 100-150 ( ) 150-200 ( ) 200-250 ( ) 250-300 ( ) 300-350 ( ) 350-400 ( ) 400-450 ( ) 450-500
State approximate number if more than 500:
b) Number of schools involved with the provision: ________
c) Characterise the schools involved under the following broad headings that describe the type of the pupils they send: No. of schools • Special schools
• Exclusively for seriously disaffected pupils
• Confined to disaffected and poorly performing pupils • Offered as an option to all pupils
4. Average time per week pupils spend undertaking college courses:
1/2 a day or less 1/2 –1 day 1 – 2 days 3 days / full time Number of
individual pupils
5. Analysis of the provision provided:
The aim of this section is to establish in broad terms the type of provision delivered and its scale ie. the figures do not need to be exact unless such data is readily available.
a) Trend in pupil numbers: total and by by level of study (individuals, not FTEs)
2002/03 2003/04 2004/05 2005/06 2006/07
Total
Entry level
No qualification
aims: Other
Entry level
Level 1
Level 2
Qualification aims:
b) Trend in pupil numbers by area of learning:
Areas of learning
2002/03 2003/04 2004/05 2005/06 2006/07
Science & Maths
Land Based Provision
Construction
Engineering
Business Admin
ICT
Retailing & Service
Hospitality
Hairdressing & Beauty Health & Social Care Arts & Media
Humanities
English & Languages
Foundation Learning
6. Staffing and resources
a) What level of staffing was involved in 14–16 provision at your college for 2004-5? (Exclude staff provided by schools).
Full-time equivalents or Contact hours Teaching staff
Learning support, technicians, drivers etc Administrative staff
Managers
b) Are any other significant resources provided by the college for 14–16 year old school pupils?
Approximate value Materials and consumables
Transport and travel Other (please say what)
7. Income
How much income relating to 14–16 activity did you, or do you expect to, receive in 2004/05?
Source Normal fees or
revenue funds
One-off grants etc
Total
8. Benefits of pre-16 provision
To establish what factors influence your college’s involvement in pre-16 provision please classify the following reasons as of major, minor or no benefit.
Major Benefit
Minor Benefit
No Benefit
1. Improves college recruitment 2. Improves relationships with local
schools
3. Is a source of additional income 4. Helps improve the retention and
achievement of those who subsequently enrol
5. Is part of the college’s social mission 6. Uses spare capacity within the college 7. Development of college staff
Other (please state what):
9. Concerns with pre-16 provision
Listed below are some concerns that have been raised by colleges. Please classify them as of major, minor or no concern to your college.
Major Concern
Minor Concern
No Concern
1. Significant numbers of pre-16 learners tend to undermine the college’s ‘adult ethos’.
2. The college finds it difficult to meet the statutory child protection requirements / its responsibilities for duty of care
3. The full cost (direct costs and overheads) of the provision is not covered by the additional income received.
4. Their use of specialist workshops and staff inhibits the growth of post 16 provision. 5. Teaching and support staffs do not feel that
they have the specialist skills and experience required to successfully teach pre-16
learners.
6. Schools generally use the courses as a ‘dumping ground’ for pupils they find difficult to motivate and control.
7. Disproportionate use of management time to ensure collaboration works.
Other (please state what):
Appendix 2: Areas for further research
Introduction
The analysis of the questionnaire responses provided a great deal of useful information on and insights to pre-16 provision from a college perspective. The findings raise a number of important questions around funding, physical constraints and ethos erosion that could seriously inhibit further growth. To assist policy makers planning this critical element of the 14-19 strategy it is important that these potential constraints are better understood. In addition the initial research only looked at the issues around pre-16 courses from a college perspective. A more complete
understanding requires that the relevant issues are also explored from the school perspective. The two research projects outlined below are designed to provide data and insights to assist policy makers to plan the further development of college based courses for pre-16 pupils. Their findings will also assist the college and secondary school sectors to understand the potential problems and benefits associated with the growth of this provision.
Project 1
This project would build directly on the initial research and involve visits to 20 colleges selected from those that responded to the questionnaire and reported significant levels of pre-16 provision. This group to comprise colleges reporting both financial surpluses and deficits for this provision. The interviews with appropriate senior staff will be used to:
i. Check the relevant data submitted in response to the questionnaire is accurate and calculated on a comparable basis to the other colleges selected.
ii. Explore in detail the sustainability of the current provision and identify any changes they are planning and the reasons for them.
iii. Explore their longer-term plans for pre-16 provision and identify the key factors that are driving and inhibiting future growth.
The objectives of this project are to:-
• Provide more accurate data on the costs and revenues associated with pre-16 provision in order that: potentially sustaining models can be identified; more robust data on delivery costs can be established; and the basis on which schools and LEAs are charged for access to this provision can be understood.
• Identify the factors, from a college perspective, that are likely to inhibit or limit future pre-16 provision and explore possible measures to reduce their impact.
Project 2
The project would involve visits to a sample of 20 schools that currently have more than 25% of their Year 10 and Year 11 pupils attending college courses for at least one half day per week. It is envisaged that those selected would be partner schools of the colleges selected for Project 1. The interviews with appropriate senior staff will:
• Identify the estimated costs and savings resulting from some pupils being taught for part of their time at college.
• Identify the performance/value added achieved by those pupils undertaking college courses. The aim would be to compare the performance of these pupils with similar cohorts that attend schools without a college option.
• Establish their views of the value of college based courses and what factors are likely to influence its future development at the school.
The objectives of this research project are to:
• Better understand how schools are integrating college courses into their Key Stage 4 option packages and the profile of pupils selecting the vocational alternative.
• Understand exactly what costs and savings schools experience when a significant number of their pupils attend college courses.
• Begin to evaluate whether the addition of college courses to the Key Stage 4 option package actually improves the performance of the pupils that attend. • Identify the characteristics of the pupils that opt to attend college courses.
Appendix 3: Standard formulas used to calculate college
costs
GLHs per week
To transform the attendance figures into GLHs per week the following multipliers were used:
Attendance
Assumed GLHs
No. of pupils
Average GLHs per week
Half a day or less 3 344 1,032
Half to one day 5 121 605
One to two days 9 32 288
Three days or more 15 4 60
Total 501 1,985
These multipliers were used to transform pupil numbers into average GLHs per week as shown in the example. This estimate was used to measure the cost and income per GLH week.
Staff costs
The colleges were asked to provide the estimated number of full time equivalent staff committed to pre-16 courses in each of the four categories.
Category
Annual cost per full-time equivalent
(£)
Teaching staff 28,500
Support staff 21,000
Admin staff 18,500
Managers 34,500
Other costs