Effective Pre-School, Primary and Secondary Education Project (EPPSE 3-14)
Influences on Students’ Dispositions in Key Stage 3:
Exploring Enjoyment of School, Popularity, Anxiety,
Citizenship Values and Academic Self-Concept in
Year 9
The EPPSE 3-14 Research Team Principal Investigators
Professor Kathy Sylva
Department of Educational Studies, University of Oxford 00 44 (0)1865 274 008 / email kathy.sylva@edstud.ox.ac.uk
Professor Edward Melhuish
Institute for the Study of Pupils, Families and Social Issues Birkbeck University of London
00 44 (0)207 079 0834 / email e.melhuish@bbk.ac.uk
Professor Pam Sammons
Department of Educational Studies, University of Oxford
00 44 (0)1865 274 142/ email pamela.sammons@education.ox.ac.uk
Professor Iram Siraj-Blatchford
Institute of Education, University of London
00 44 (0)207 612 6218 / email i.siraj-blatchford@ioe.ac.uk
*Brenda Taggart
Institute of Education, University of London
00 44 (0)207 612 6219 / email b.taggart@ioe.ac.uk
Research Officers
Dr Katalin Toth
Institute of Education, University of London 00 44 (0)207 911 5587 / email k.toth@ioe.ac.uk
Diana Draghici
Institute of Education, University of London
00 44 (0)207 612 6608 / email d.draghici@ioe.ac.uk
Dr Aziza Mayo
Institute of Education, University of London
00 44 (0)207 331 5110 / email a.mayo@ioe.ac.uk
Rebecca Smees
Department of Education, University of Oxford
00 44 (0)1865 274 142 / email pamela.sammons@education.ox.ac.uk
**Wesley Welcomme
Institute of Education, University of London
00 44 (0)207 612 6684 / email w.welcomme@ioe.ac.uk
Authors
Pam Sammons
Kathy Sylva
Edward Melhuish
Iram Siraj-Blatchford
Brenda Taggart
Rebecca Smees
Diana Draghici
Katalin Toth
ACKNOWLEDGEMENT
The EPPSE 3-14 project is a major longitudinal study funded by the Department for Education (DfE). The research would not be possible without the support and co-operation of the six Local Authorities (LAs), and the many pre-school centres, primary schools, secondary schools, and the young people and parents participating in the research.
The views expressed in this report are the authors’ and do not necessarily reflect those of the Department for Education
Contents
Executive summary
i
Introduction
1
Aims
1
Methods
2
Structure of the paper and analyses
3
Section 1: Characteristics of the sample at the end of Year 9
4
Section 2: Students’ dispositions at the end of Year 9
8
Section 3: Students’ dispositions and data analysis
21
Section 4: Links between individual, family and Home Learning characteristics and
students’ dispositions in Year 9
27
Child Measures
28
Family Measures
31
Home Environment Measures
31
Section 5: Students’ dispositions at the end of Year 9 in secondary school: The Impact
of Pre-school, Primary School and Secondary School
36
Testing the impact of different aspects of pre-school within the contextualised model
36
Impact of pre-school centre effectiveness
37
Impact of primary school effectiveness
37
Impact of secondary school effectiveness
38
Section 6: Links between academic attainment, social-behavioural status and views of
school and dispositions in Year 9
40
Academic attainment and social-behavioural outcomes in Year 9 and dispositions
40
Views of school and dispositions in Year 9
41
Section 7: Students’ dispositions across the first years of secondary school:
Results from Value Added Multilevel Analyses
44
Simple Value Added models
44
Complex Value Added models
45
The impact of Pre- and Primary school
45
Section 8: Summary and conclusions
46
Appendix 1: Exploratory and confirmatory factor analyses of dispositions outcomes in
Year 9
48
Appendix 2: Factor structure using Varimax and Oblique Exploratory Factor Analysis
51
Appendix 3: Correlations between the factor items
60
Appendix 4: Multilevel analyses of peer data for dispositions and views of school
62
Appendix 5 : Results of contextualised multilevel analyses
64
Appendix 6: Testing Year 9 attainment and social-behavioural outcomes as predictors of dispositions within the contextualised multilevel analyses
70
Appendix 7: Methodology and Effect Sizes
71
Glossary
72
i Executive Summary
There is increasing interest in studying a range of student outcomes in educational research because it is recognised that, while promoting good academic attainment is an essential function of schools, they also serve a range of other important purposes. Promoting student well being, social behaviour and positive attitudes or dispositions towards learning are also important. Schools are expected to promote positive values relating to citizenship, enjoyment of school and encourage favourable views of learning capabilities amongst students.
This report presents the results of analyses of students’ dispositions in Year 9 (age 14). Reports on student’s academic and social-behavioural development at this age are published separately (Sammons et al. 2011a, Sammons et al. 2011b). The original EPPE sample was recruited to the study at age 3 years plus and monitored to the end of Key Stage 3 (Year 9) in secondary school. An additional home sample of children (who had not attended a pre-school setting) was recruited when the pre-school sample started primary school. In addition to exploring pre-school influences, the EPPSE 3-14 research identifies the influence of primary and secondary school on students’ later educational outcomes and trajectories, as well as investigating any continuing pre-school effects.
EPPSE 3-14 involves the collection and analysis of a wide range of quantitative data about student’s development and its relation to individual student, family, home learning environment (HLE) characteristics and the characteristics of the pre-schools they attended. Additional ‘value added’ measures of primary school academic effectiveness have been derived from independent statistical analyses of national data sets conducted for all primary schools in England (Melhuish et al., 2006) as part of an earlier study. In addition, Contextual Value Added (CVA) national school indicators1 of secondary school performance and Ofsted judgements2 related to the secondary school attended have also been collected and incorporated into the EPPSE 3-14 data base to provide indicators of the quality of secondary schools attended to complement the measures on primary and pre-school settings. Thus it is possible to explore various features of pre-school, primary school and secondary influence on students’ dispositions in Year 9.
Two separate questionnaire surveys were administered to students; the first asking students’ views mainly about themselves (which we term dispositions) and the second asking them about their experiences of school and classroom life (which we term views or reports of school). Similar surveys, although somewhat shorter, had also been administered at younger ages when these students were in primary school in Year 2 (age 7) and Year 5 (age 10). Thus the research could link measures of individual students’ dispositions in Year 2, Year 5 and Year 9 to explore changes over time. A range of statistical methods has been used to investigate results for 1766 students for whom at least one disposition outcome measure was collected in Year 9, representing 90% per cent of the students in the EPPSE 3-11 sample for whom valid baseline data had been collected on dispositions in Year 5.
The aims of the analyses were:
to explore students’ views on individual questions related to dispositions, compared to similar questions in Year 2 and Year 5;
to examine students’ responses for underlying dimensions (factors) related to their dispositions and views of school at the end of Key Stage 3;
to explore the impact of individual, parent and early years home learning environment (HLE) characteristics on students’ dispositions at the end of Year 9;
to model students’ dispositions to school and change in dispositions over Key Stage 3;
to investigate any continuing impact of pre-school quality and effectiveness, including any variations in dispositions for students who had experienced different levels of quality of pre-school provision (and those who had not attended a pre-pre-school centre i.e. the ‘home’ sample);
1 From the Department of Education (DfE) 2
ii to investigate the influence of primary and secondary school academic effectiveness and quality on dispositions and changes in disposition (controlling for individual, family and HLE characteristics);
to investigate how other measures of students’ development including academic attainment and social behaviour relate to their dispositions;
to investigate how students’ perceptions of their secondary school experiences (views of school) relate to their dispositions.
Key findings
Views and experiences of school in Year 9
Six dispositions outcomes were identified using exploratory and confirmatory factor analysis of the Year 9 survey data.
Dispositions in Year 9
The analysis of the Year 9 student questionnaire revealed six underlying factors that we term dispositions, some overlapping with the outcomes at previous time points (Year 2, Year 5). The first two factors relate to ‘Academic self-concepts for English and maths’, and are based on items taken from existing well established Academic self-concepts scales (Marsh 1990, Marsh & Hau 2003, Marsh & Craven 2006). The third factor ‘Popularity’ relates to how popular students feel they are with other teenagers and how many friends they have. The fourth factor ‘Anxiety’ reflects the degree to which the students feel unhappy, worried, nervous in new situations, fearful or suffer from minor ailments. The fifth factor ‘Citizenship values’ relates to how important students feel certain behaviours are such as strong people not picking on weak people, respecting rules and laws, controlling your temper, respecting other’s views, and sorting out disagreements without fighting. Lastly ‘Enjoyment of school’ reflects the degree to which students reported they like lessons and being at school, like answering questions in class, but also how much the student experiences boredom in lessons or feels school is a waste of time.
Section 3 of the report shows the questionnaire items associated with each of these dimensions. Confirmatory factor analysis was the main method to identify these underlying dispositions because it produces more reliable and valid measures than using exploratory factor analysis alone.
At younger ages in primary education (in Year 2 and Year 5) the EPPSE students were found to be somewhat more positive towards school than they were in Year 9. In line with other research (MacBeath and Mortimore 2001) students tend to report ‘enjoying’ school less as they get older, and the results also suggest that their ‘academic self-concepts’ tends to decrease somewhat over time and the way they view their behaviour also becomes somewhat less favourable. Nonetheless, the majority of students still have fairly positive views in Year 9. For example, 51 per cent of Year 2 students reported liking school ‘all the time’ compared to 24 per cent of Year 5 students. This compares with 20 per cent of Year 9 strongly agreeing that they like being at school. Students’ reports indicate that they feel they are less clever and are less likely to feel safe outside the classroom as they get older.
iii When asked how they felt about individual subjects, students’ liking of individual subjects also showed a reduction over time for all subjects. However, the relative popularity of individual subjects remained fairly constant. Sport and the Arts/Creative subjects were still the most popular subjects in Year 9, the least popular being modern languages.
Students were generally confident about their overall ability in Year 9 (93% agreed/strongly agreed that they thought they could do most things well; 76% felt they were clever), but there was some variation in perceived ability in the individual subjects.
In Year 9 the majority of students still reported they liked school (69% agreed and 20% strongly agreed), and most liked their lessons (66% agreed and 18% strongly agreed with this statement) but boredom in lessons was reported by a substantial minority (36% of students agreeing and 5% strongly agreeing they get bored in class).
In terms of future plans, nearly all students believed it was important to get GCSEs and A levels, and the majority also felt it was important to get a degree. They had high aspirations, in total 77 per cent of students felt it was likely or very likely that they would go to university (41% think it is very likely, 36% fairly likely they will apply to go to university). It should be noted that most students in the EPPSE sample completed the surveys before current substantial increases in university fees were introduced.
Most students in Year 9 believe they are popular with their friends. Only a minority of students felt they don’t make friends easily (10%) whereas 62 per cent agreed and 28 per cent strongly agreed that they make friends easily. Around a fifth felt unpopular (20%) whereas 65 per cent agreed and 12 per cent strongly agreed that they were popular with their peers.
Anxious behaviours were a common feature of students at this age group, with approximately half feeing nervous in new situations and worrying a lot. Approximately one in five students indicated that they felt unhappy or suffered regularly from minor ailments (14% agreed/ 3% strongly agreed they felt unhappy and 22% agreed/ 6% strongly agreed they suffer from minor ailments). Anxiety related behaviours were significantly more commonly reported by girls.
The impact of individual student, family and home characteristics on students’ dispositions The analyses highlight the influence of a range of student, family and home environment factors that predict variation in students’ dispositions. An analysis that contextualised students’ outcomes in terms of these factors was carried out. The results show that individual student and family background factors have weaker relationships with students’ dispositions than with their academic outcomes in Year 9 (see Sammons et al 2011a), also that relationships are generally weaker than those found with some aspects of student’s social behaviour (see Sammons et al 2011b). These results are in similar to those found previously when the sample was in primary school.
Student background
Girls reported significantly different dispositions than boys in terms of their ‘maths academic self- concept’, ‘anxiety’, ‘popularity’ and ‘citizenship values’. Girls have a lower ‘academic self-concept for maths’, but there are no gender differences for ‘English academic self-concepts’(even though girls at this age have significantly higher attainment in English). Girls also tend to have a poorer view of their ‘popularity’ and are more likely to report ‘anxiety’ than boys. However, girls show higher ‘citizenship values’ than boys.
Students from different ethnic groups were compared to the majority ethnic group, White UK, to explore any significant differences in their dispositions towards school. Most ethnic groups did not differ in their perceptions from the White UK heritage group, but there were some statistically significant patterns;
iv Indian students also reported greater ‘enjoyment of school’, had higher ‘maths academic
self-concepts’ scores, were more positive in assessing their ‘popularity’ with peers and also reported lower levels of ‘anxiety’.
Black African heritage group also, on the whole, had a higher ‘English and maths academic self-concepts’ and were more positive in assessing their ‘popularity with peers than the White UK group.
Black Caribbean heritage group also, on the whole, had a higher ‘English academic self-concepts’ and were more positive in assessing their ‘popularity’ with peers than the White UK group.
White European students reported higher ‘citizenship values’ than the White UK group.
Given the small numbers such ethnic differences should be treated with caution but the findings do not suggest that ethnic minority students have slightly different (as a group) views of school or views of themselves than the majority White UK group.
Students who had been identified by their parents as having behavioural problems in the early years also tended to report enjoying school less, being more anxious, and had a lower ‘Maths academic self-concepts than other students in Year 9. Students who had been identified by their parents as having developmental problems in the early years also tended to report higher ‘citizenship values’, this may be because such students are more likely to experience SEN (as identified in our reports on academic and behavioural outcomes) and perhaps face more bullying.
Students who had very low birth weight reported they felt less ‘popular ‘with their peers in Year 9. This may reflect long term developmental difficulties. The student’s number of siblings at entry to pre-school was also significant. Students with two or more siblings tended to ‘enjoy’ school less than singletons. For only children the company of other young people at school may be of special importance in adolescence.
Lastly, students who were older in the year group tended to have a better ‘maths academic self-concepts’ than younger students within the year group. This effect at this age appears to relate to developmental differences in attainment as it fails to be significant once attainment measured by KS3 Teacher Assessment (TA) levels is taken into account (there is a well known association between age in months and differences in attainment within a year group, hence the development of age standardised tests).
Family background
Poverty status was measured using the Free Schools Meals (FSM) entitlement measure. Students entitled to FSM had lower ‘Maths academic self-concepts’ scores. The highest socio-economic level of either parent (family SES) was also tested, based on their occupation in KS2. Students from ‘Other Professional Non-Manual’, ‘Skilled Non-Manual’ and ‘Skilled Manual’ families had a lower ‘Maths academic self-concepts than students from a Professional Non-manual household. No other categories were found to differ from this group significantly in their dispositions.
The employment status of fathers was also found to be related to ‘maths academic self-concepts’. Students who had fathers who were employed full time and those who were studying were found to have higher ‘Maths academic self-concepts’ than students whose fathers were not working.
The qualification level of both parents was also examined. There were no clear patterns with regard to mother’s or father’s qualifications in contrast to findings for academic and social-behavioural outcomes in Year 9 (Sammons et al, 2011a&b).
v The marital status of parents showed a small but significant effect. Compared to students living in married households in KS2, students from widow/widower households reported higher levels of ‘anxiety’ than studentsfrom married households. Students from households where their parents were living together but not legally married reported higher ‘popularity’ with peers than students from married households. This is in contrast to findings on academic attainment and social behaviour (as rated by teachers) where students from single parent families showed poorer outcomes in year 9.
Home learning environment
The student’s early years HLE has been found to be a positive predictor of other academic and social-behavioural outcomes at age 14. There was a positive association found between higher early years HLE index scores and students’ later self-reported ‘enjoyment of school’ in Year 9. Students with higher HLE scores in the early years (top three groups) had significantly higher ‘enjoyment of school’ in Year 9 than students who had the lowest levels of home learning. Early learning experiences had given these children a better start to primary school and this advantage continued throughout primary education and on into secondary school.
Later home learning indicators also showed a positive link to ‘popularity’ and ‘English academic self-concepts’. Students with high and medium levels of ‘parent/child interaction’ in KS1 reported higher ‘popularity’ levels in Year 9 compared to those with low levels of ‘parent/child interaction’. In addition, students with high and medium levels of a global index of HLE in KS2 also showed more positive views of their ‘popularity’ with peers than students with low levels. Students who had high and medium levels of ‘Individual Child Activities’ in KS2 had higher ‘English academic self-concepts’ to those with low levels of ‘Individual Child Activities’. These results confirm the continuing importance of parental support for learning in the home for all round child development with benefits that last into adolescence.
Relationship to Special Educational Needs
Students who have been identified as having SEN show less favourable dispositions for all factors except ‘citizenship values’. SEN students have significantly less favourable scores for ‘academic self-concepts’, ‘popularity’ and especially ‘anxiety’. Students who have been identified as having a special need (SEN) also show a number of less favourable dispositions. Students who are at the School Action stage of the SEN register report lower ‘academic self-concepts’ (English and maths) and ‘enjoyment of school’. Students who are at the School Action plus stage of the register or have a full statement report higher ‘anxiety’ levels, lower ‘popularity’ and lower ‘English academic self-concepts’ than their peers.
After attainment was taken into account students on the SEN register show no significant differences in ‘academic self-concepts’ compared with other students. This suggests that the lower attainment of students with SEN in Year 9 accounts for differences in their ‘academic self-concepts’ rather than their SEN status per se although the two (academic attainment and SEN status) are strongly related and so relationships will tend to be reciprocal.
Relationship to academic attainment and social-behavioural outcomes
Academic attainment was found to be significantly associated with students’ dispositions for four dispositions (‘academic self-concepts in English and maths’, ‘anxiety’ and ‘enjoyment of school’). Attainment in maths proved to be a strong predictor of ‘maths academic self-concepts’, ‘anxiety’ and ‘enjoyment of school’. English was the strongest predictor of #English academic self-concepts#. In Year 5 attainment was not found to be related to ‘enjoyment of school’ but by Year 9 it showed a significant association. This may reflect a greater awareness of students’ relative levels of attainment in KS3 and its implications for future educational choices and GCSE entry in secondary schools.
vi importance of ‘self regulation’ in shaping students’ outcomes and predicting success in school (Sammons et al 2011b).
Relationship to experiences of secondary school
There was a strong link between students’ self perceptions and their self-reported ‘views of school’. Various factors were identified that relate to students’ views and experiences of their secondary school strongly predicted their ‘enjoyment of school’ especially in relation to ‘teacher support’, ‘valuing students’, ‘emphasis on learning’ and the ‘school environment’.
Students’ experiences of their secondary school’s ‘emphasis on learning’, ‘learning resources’ how much they ‘valued students’ and ‘teacher discipline’ were strong predictors of ‘maths academic self-concepts’.
‘Teacher support’ and ‘emphasis on learning’ were also predictive of ‘English academic self-concepts’. Students’ reported experiences of ‘teacher support’, ‘emphasis on learning’ and ‘valuing students’ were also quite strongly predictive of the disposition outcome ‘citizenship values’.
The link between the students’ views and experiences of their secondary school and their dispositions was weaker for ‘anxiety’ and ‘popularity’, although less favourable views for the perceived ‘behavioural climate’ (scores of ‘poor behaviour climate’) of the school was found to be quite strongly predictive of increased ‘anxiety’ scores.
Pre-school quality and effectiveness and primary school effectiveness Continuing pre-school influences
The analyses of EPPSE students’ dispositions at the end of KS3 produced little evidence of any continuing pre-school effects for dispositions towards school, when comparing students who had attended pre-school with those who had not.
When investigating the quality of different aspects of pre-school experiences (comparing only those who had pre-school experience), higher levels of quality of experience in terms of ‘positive relationship’ scores (measured by the ARNETT instrument), lower ‘punitiveness’ scores and lower ‘detachment’ scores predicted higher ‘English academic self-concepts’ later on in KS3. Lower ‘detachment’ scores for pre-school experiences also predicted higher ‘enjoyment of school’ in Year 9 while poorer quality ‘positive relationship’ in pre-school predicted higher ‘anxiety’scores in Year 9.
Quality of the pre-school was also measured through two environmental rating scales ECERS-E (Sylva et al., 2003) and ECERS-R (Harms et al., 1998). Neither of these measures predicted dispositions in Year 9. This is in contrast to findings for academic and social-behavioural outcomes in Year 9. Thus we can conclude that earlier pre-school influences tend to be less important as predictors of students’ later dispositions than of academic or social-behavioural outcomes at the end of KS3.
Primary and secondary school academic effectiveness (contextualised value added)
Various measures of primary school academic effectiveness were tested as predictors but these were not found to relate to students’ dispositions in Year 9. This is in contrast to findings for academic attainment measured by TA levels in Year 9 where those who had attended a more academically effective primary school showed continued benefits in their attainment at age 14 (see Sammons et al 2011a).
vii The small amount of secondary school level variation was found only for ‘English academic self-concepts’ in the contextualised model (4.3%), but this just failed to reach statistical significance for the value added model (4.1%). However, an additional analysis of peer data from 66 schools that EPPSE students attend was also carried out where the average number of students per school was much higher (mean=24) showed significant school level variation for all outcomes except ‘anxiety’ (variation=0.2%).
The largest variation amongst school for dispositions was found for ‘enjoyment of school’ (11.2%) followed by ‘maths academic self-concepts’ (6.2%), ‘English academic self-concepts’ (5.3%), ‘popularity’ (4.7%) and ‘citizenship values’ (2.9%). This contrasts with the much greater school level variance found for some of the views of school factors based on students’ survey responses in Year 9.
Particularly high variation between schools was found for the factor that measured students’ views of ‘headteacher qualities’ (14.5%), ‘poor behaviour climate’ (27.5%) and ‘school environment’ (27.6%)3
. Some evidence of school level variation in specific areas was also found when individual questions were investigated. These were mainly related to ‘enjoyment of school’ items (feeling out of place, feeling school was a waste of time and feeling the school was a friendly place) and the importance students indicated they attached to gaining academic qualifications (this can be seen as a measure of educational aspirations).
There was also some variation between secondary schools in how much students reported they liked and felt they were good at Modern languages. These results show that secondary schools do vary in the quality of various features of school experiences, as reported by students in KS3. Some students show benefits from more favourable and supportive secondary school environments during KS3.
Ofsted inspection data was used to provide measures of secondary schools’ quality and effectiveness for a range of areas, and tested in the contextualised multi level models. ‘Enjoyment of school’ was found to be predicted by a number of secondary school quality indicators derived from Ofsted inspection judgments. Schools that were judged to be ‘outstanding’ in ‘meeting the needs of learners’, ‘how well learners achieve’, ‘the standard reached by learners’, ‘progress made by learners (including those with learning difficulties and disabilities)’, and in developing student’s skills to promote ‘economic well-being in the future’ had students that reported greater ‘enjoyment of school’ than students from schools judged as ‘inadequate’ in these aspects, controlling for differences in student, family and HLE characteristics.
Schools judged as ‘outstanding’ in the extent to which learners adopt healthy lifestyles and the extent to which ‘learners develop workplace and other skills that will contribute to their future economic well-being’ had students that reported lower levels of ‘anxiety’ than student who attended schools judged to be ‘inadequate’ in these areas. These findings suggest that these features of the quality of the secondary school can have a significant positive impact on certain affective outcomes in terms of our self report student disposition measures.
The secondary school academic effectiveness measure (derived from DfE CVA scores) was not found to be a significant predictor any of the other disposition outcomes. These results indicate that academically effective secondary schools do not seem to shape secondary students’ ‘enjoyment of school’ in KS3.
3
viii Estimating changes in dispositions over time
We studied changes in students’ dispositions over time using value added analyses for the six outcomes to explore how dispositions altered from Year 5 to Year 9. Dispositions in Year 5 were used as a baseline, to assess the degree of change over the four year period. For these analyses we added to the contextualised multilevel models a prior measure, using the dispositions collected at Year 5 in addition to the background factors presented above. These analyses were undertaken to explore whether the student, family and HLE characteristics, found to be significant in predicting aspects of their dispositions measured at the end of Year 9, were also associated with differential change in these dispositions between Year 5 of primary school and Year 9 of secondary school
.
Dispositions in Year 5 were used as a baseline, to assess the degree of change over the three year period. Where the corresponding measure was available, this proved to be the best predictor of later dispositions, although it usually accounted for only a small proportion of total variance in the Year 9 measure, reflecting the lower correlations.
The generally weak relationships found between dispositions prior dispositions in Year 5 to those in Year 9 may be in part a reflection of the high fluctuation in students’ dispositions that seems to be occurring over time. The results indicate that students’ dispositions show greater variability and are less predictable than measures of their cognition and social behaviour.
The generally weak relationships found between students’ prior dispositions (Year 5) and those in Year 9 indicate fluctuation in students’ dispositions over the four years covering transition to secondary school and across KS3 (this may reflect measurement difficulties and real changes in a students’ views and feelings as they enter adolescence and adapt to secondary school environments). Similar weak relationships between Year 2 and Year 5 dispositions were reported in an earlier paper (Sammons et al 2008).
Thus we find that correlations between students’ dispositions in Year 5 and Year 9 are relatively low compared to those we found for attainment or social behaviour across years KS3 (‘enjoyment of school’ r=0.24, ‘academic self-image’ in Year 5 and ‘maths academic self-concepts’ in Year 9 r=0.25, ‘academic self-image’in Year 5 and ‘English academic self-concepts’ r=0.19, ‘anxiety and isolation’in Year 5 and ‘anxiety’in Year 9= 0.22).
Summary and implications
There is increasing interest in studying a range of student outcomes in educational research because it is recognised that, while promoting good academic attainment is an essential function of schools, they also serve a range of other important purposes. Promoting student well being, social behaviour and positive attitudes or dispositions towards learning are also important. Schools are expected to promote positive values relating to citizenship, enjoyment of school and encourage favourable views of learning capabilities amongst students.
This research confirms findings elsewhere (Keys and Fernandez 1992) that student attitudes tend to become less positive over time and that in a number of areas gender differences exist. The tendency of girls to have lower academic self-concepts than boys, feel less popular and have higher self reported ‘anxiety’ scores is something that is relevant to the organisation of school pastoral systems.
ix resources’). There is also evidence of important variation between schools in students’ dispositions for ‘enjoyment of school’. Taken together, the findings suggest that secondary schools do differ significantly in various ways that are likely to influence the quality of learning and well-being as perceived by students. Such evidence could provide valuable feedback to schools, especially where they maybe struggling to improve or are rated as inadequate by inspectors.
The findings of this Year 9 analysis of student dispositions show similarities to findings in Year 5 that suggest student background has only a small impact on dispositions compared to its impact on other outcomes (Sammons et al 2011a, 2011b). This may in part be linked to greater changes in self perceptions over time, suggesting concurrent influences play a larger role. However, gender differences were found for some outcomes, as was the case for EPPSE students’ academic and social-behavioural outcomes in Year 9.
Year 9 student dispositions were found to relate to academic attainment and ‘self regulation’, suggesting that less academic students also have less positive experiences of learning. Students with SEN were found to be particularly vulnerable to poorer self perceptions, and this could be relevant in the development of student’s personal goals.
Self perceptions, including items related to ‘enjoyment of school’ become less positive over time, but students are still generally positive in Year 9 about themselves and their school experience, with the majority of students liking school, feeling popular and feeling that academic success is important. More specifically almost two thirds of students think getting a university degree is very important and have high aspirations. A gender divides is evident with boys more inclined to like and feel competent in maths, science, ICT and sports and girls in English, the Arts and modern languages, areas in which there are also national differences in subject choices found at GSCE and A level.
A good quality early years HLE has been shown to benefit students’ academic outcomes even in secondary school, and also their social behaviour. The early years HLE also predicts more favourable dispositions in Year 9. Thus encouraging positive learning experiences in the home and appropriate parenting skills that facilitate this could also nurture positive views of learning and school more generally in the longer term.
Family and child case studies of resilient and vulnerable children provide further in depth discussion of influences base on interviews and quantitative evidence. These provide deeper understanding of the parenting and schooling patterns that influence well being and developmental pathways (Siraj-Blatchford et al., 2011).
The research provides important evidence on educational influences on students’ dispositions. Attending a high quality secondary school (as assessed through Ofsted judgements) appears to have some positive benefit to ‘enjoyment of school’ and lower ‘anxiety’ levels, suggesting that good quality schools also benefit emotional well-being and highlight the importance of including students’ views in the school evaluation process.
1
Introduction
This report presents the results of analyses related to students’ dispositions in Year 9 (age 14). The original EPPSE pre-school child sample (2,800) was recruited to the study at age 3 years plus. An additional 300 children who had not attended a pre-school setting (the ‘home group) were recruited when the pre-school sample started primary school. The full sample (approximately 3,000 children) was then monitored to the end of Key Stage 1 (age 7, Year 2). The sample was followed again to the end of Key Stage 2 (age 11, Year 6). This third extension, the EPPSE 3-14 study has followed up the sample to the end of Key Stage 3 (age 14, Year 9). The longitudinal research design investigates the influence of primary and secondary school influences on students’ educational outcomes in Year 9 (academic, social-behavioural and affective), as well as investigating any continuing pre-school effects.
As well as children’s academic and social-behavioural outcome data, the EPPSE 3-14 study collected and analysed a wide range of information on individual student, family and home learning environment (HLE) characteristics, as well as information on the pre-schools the children attended.
Additional ‘value added’ measures of primary and secondary school academic effectiveness (derived from independent statistical analyses of national data sets) and selected indicators of school quality (measured by Ofsted inspection judgements), have been used in the analyses. These indicators about primary and secondary schools complement the measures collected earlier on the pre-school setting attended. The research therefore explores pre-school, primary and secondary school influences on students’ outcomes in Year 9 both separately and jointly.
Student questionnaires (All about Me and All about Me at School) designed to explore individual students’ views about school and classroom life (through self-report) were collected at different time points (aged 7, 10 and 14). A range of statistical methods have been used to investigate results for 1766 students for whom at least one disposition outcome measure was collected in Year 9, representing 90 per cent of sample whom had valid baseline data on dispositions in age 10 (Year 5).
Aims
The aims of the analyses were:
to explore students’ views on individual questions related to dispositions, compared to similar questions in Year 2 and Year 5;
to examine students’ responses for underlying dimensions (factors) related to their dispositions and views of school at the end of Key Stage 3;
to explore the impact of individual, parent and home learning (HLE) characteristics on students’ dispositions at the end of Year 9;
to model students’ dispositions to school and change in dispositions over Key Stage 3;
to investigate any continuing impact of pre-school, including any variations in students’ dispositions for those who had experienced different levels of quality of pre-school provision (and those who had not attended a pre-school centre i.e. the ‘home’ sample);
to explore the impact of measures of pre-school processes, particularly quality and effectiveness on later student dispositions;
to investigate the influence of primary and secondary school academic effectiveness and quality on dispositions and changes in disposition (controlling for individual, family and HLE characteristics);
to investigate how other measures of students’ development including academic attainment and social behaviour relate to their dispositions;
2 Methods
The findings reported rely on descriptive analyses and complex techniques such as exploratory and confirmatory factor analysis and multilevel analysis. Principal components analysis was used to examine underlying dimensions in students’ dispositions (perceptions of themselves and attitudes towards school) and their school experiences. This enabled questionnaire items to be grouped in order to identify separate measures of attitudes towards school. Confirmatory factor analysis was then conducted to create a more robust overall model of dispositions in Year 9. Multilevel models analysed the extent to which different individual background characteristics (including individual student, family, home learning) predict students’ dispositions in Year 9 and test the impact of indicators of pre-school, primary and secondary school experience on these dispositions.
The paper focuses on six disposition measures derived from Year 9 student questionnaires that covered a range of topics. The questionnaires were administered at the end of Year 9. At the end of Year 2 and 5 similar questionnaires of students’ views were administered, so comparable measures of prior student dispositions are available and reported in an earlier paper (Sammons et al 2008).
Multilevel models provide accurate estimates of the impact of different individual or school characteristics on student outcomes (Goldstein 1995). They are used to explore institutional influences by partitioning variance into individual and higher levels (e.g. pre-school centre or primary or secondary school) reflecting clustering in the sample.
Earlier analyses over the pre-school period enabled the calculation of value-added estimates (residuals) of individual pre-school centre effects for children in the sample who attended a pre-school centre (see EPPE 3-11 Technical Paper 8a and b for details; Sammons et al 2002a, 2002b). These value-added measures of centre effectiveness have been included in subsequent analyses of students’ educational outcomes, at the end of Year 9, to establish whether the effectiveness of the pre-school attended in promoting children’s social-behavioural and academic development continues to show any relationships with students’ later dispositions towards secondary school.
To examine the impact of secondary school on students’ later outcomes in Year 9, measures of secondary school academic effectiveness in terms of national contextualised value added measures (CVA) and Ofsted judgements from inspections were utilised.
Background information about individual child, parent and family characteristics, was obtained initially through parent interviews conducted soon after children were recruited to the study. The parent interviews were designed to obtain information about a child’s health and care history, details of family structure and parents’ own educational and occupational backgrounds as well as some indications of parent-child activities. In most cases the parent interviews were conducted within 10 weeks of recruiting a child to the study and an excellent response rate (97%) was achieved. It should be noted that most interviews were with student’s mothers and usually took place at the child’s pre-school centre, although for some working parents telephone interviews were found to be more convenient.
Subsequently parents were asked to provide information via questionnaires about child, parent and family characteristics when the children were in Key Stage 1 of primary school (age approximately 6 years). Details were sought regarding any change in background information (in employment, income, family structure, number of siblings etc) as well as information on aspects of the HLE in Key Stage 1. The response rate obtained was 80.6 per cent1. Further information was collected by means of a parent questionnaire in Key Stage 2.
1 Between the initial assessment at entry to pre-school and the Reception assessment 139 children dropped out of the
3 Structure of the paper and analyses
This report is divided into eight sections.
Section 1: gives details about the characteristics of the EPPSE 3-14 sample.
Section 2: describes how students answered the individual questions on the Year 9 All about Me questionnaire.
Section 3: describes how the baseline (Year 5) and outcome (Year 9) students’ measures of dispositions were created using exploratory and confirmatory analysis of the self-report questionnaire items.
Section 4: investigates whether particular groups of students show differences in their dispositions at the end of Year 9 that are predicted by their individual, family and HLE background characteristics.
Section 5: investigates the effects of pre-school, primary and secondary school characteristics on students’ dispositions.
Section 6: investigates the impact of other concurrent outcomes and factors on dispositions in Year 9. Including the relationships between students’ academic attainment, social-behavioural dimensions and views of school factors collected in Year 9.
Section 7: investigates whether particular groups of students show differences in the extent of change in their dispositions from Year 5 to Year 9 and whether educational experiences at pre-school, primary and secondary school predict such changes from Year 5 to Year 9.
4
Section 1: Characteristics of the sample at the end of Year 9
Of the original sample (n=3172) data was available for just over half (n=1766, 55.6%) for the All about Me questionnaire and the All about me in school questionnaire (n=1752, 55.3%). In total, 1766 students (55.6%) had at least one disposition outcome in Year 9.2
The research design used for the original pre-school phase of the EPPSE study is described in detail in EPPE Technical Paper 1 (Sylva et al. 1999). In summary, six English Local Authorities (LAs) in five regions participated in the research with children recruited from six main types of provision: nursery classes, playgroups, private day nurseries, Local Authority (LA) day care nurseries, nursery schools and integrated (combined) centres.
In order to enable comparison of centre andtype of provision effects the project sought to recruit 500 children, 20 in each of 20-25 centres, from the various types of provision. In some LAs certain forms of provision were less common and others more typical. Within each LA, centres of each type were selected by stratified random sampling and, due to the small size of some centres in the project (i.e. rural playgroups) more of these centres were included than originally proposed, bringing the sample total to 141 centres. In all 2,857 children in the pre-school were tracked to entry in reception at primary school. An additional sample of 314 ‘home’ children (who had not attended a pre-school centre) was added at entry to primary school, for comparison with those who had attended pre-school, bringing the total sample to 3,172.
Once in primary school EPPSE children were asked their views about school life at two time points: Year 2 (age 6) and Year 5 (age 10). These students were then asked again at the end of Year 9 in secondary school. This section provides descriptive statistics for the sample at the end of Year 9 for whom questionnaire information had been obtained at age 14. Tables 1.1 to 1.3 provide a brief summary of the characteristics of the EPPSE 3-14 students at the end of Year 9 for whom at least one disposition factor score was available (n=1766).
Table 1.1 provides a brief summary of the characteristics of the students compared to the full sample and sample at the start of primary school. In all 22 per cent of EPPSE students in the sample had an ethnic background that was not white UK and 8.9 per cent had a different mother tongue than English. With respect to family structure, 13.8 per cent of the students lived in large families (3 or more siblings at entry to pre-school). Just under one in ten (151 students, 8.6% of the total sample) had not attended any type of pre-school (the ‘home’ group).
2 Of the original EPPSE sample recruited to the study (3172), 2798 were followed up to the end of KS3 in Year 9. The
5 Table 1.1: Selected background characteristics for the valid sample of Year 9 students included in the dispositions analysis compared to the overall sample
EPPSE Dispositions sample Year 9
(n=1766)
EPPSE sample at start of primary school
(n=2754)
Full EPPSE sample (n=3172)
n % n % n %
Gender*: Male Female 850 916 48.1 51.9 1584 1485 51.6 48.4 1636 536 51.6 48.4 Ethnicity*:
White UK Heritage White European Heritage Black Caribbean Heritage Black African Heritage Black Other Indian Pakistani Bangladeshi Chinese Other Mixed Heritage White Non European
1374 58 47 26 6 40 87 15 0 29 89 2 77.8 3.3 2.7 1.5 0.3 2.3 4.9 0.8 0.0 1.6 5.0 0.1 2242 112 111 63 19 65 165 35 5 61 187 4 73.1 3.7 3.6 2.1 0.6 2.1 5.4 1.1 0.2 2.0 6.1 0.1 2295 122 116 66 122 67 177 40 5 62 192 4 72.4 3.8 3.7 2.1 0.7 2.1 5.6 1.3 0.2 2.0 6.1 0.1 English as an additional
language (EAL)*
158 8.9 326 10.6 354 11.2
3 or more siblings * 243 13.8 308 9.5 308 9.7
Home Learning Environment Index*: 0-13 14-19 20-24 25-32 33-45 Unknown 128 363 380 591 244 60 7.2 20.6 21.5 33.5 13.8 3.4 289 651 706 938 342 143 9.4 21.2 23.0 30.6 11.1 4.7 308 665 727 960 346 166 9.7 21.0 22.9 30.3 10.9 5.2 Type of pre-school*:
Nursery Class Playgroup
6 Although the Year 9 sample returning questionnaires were broadly in line with the full sample (n=3172), there were some differences. There were slightly more White UK (77.8%) in this sample than the original sample (72.4%), and proportionately more girls (51.9% compared to 48.1% in the original sample).
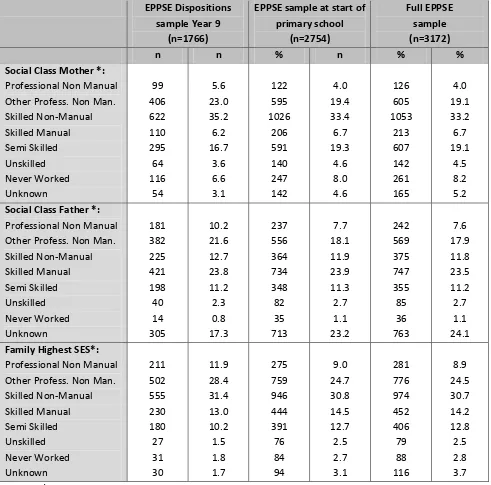
[image:19.595.46.537.210.695.2]Family background characteristics related to higher social class were also slightly over represented, as shown in Table 1.2. Students with parents from professional Non-manual social class were more likely to have returned questionnaire data in Year 9.
Table 1.2: Selected social class characteristics for the valid sample of Year 9 students included in the dispositions analysis compared to the overall sample
EPPSE Dispositions sample Year 9
(n=1766)
EPPSE sample at start of primary school
(n=2754)
Full EPPSE sample (n=3172)
n n % n % %
Social Class Mother *: Professional Non Manual Other Profess. Non Man. Skilled Non-Manual Skilled Manual Semi Skilled Unskilled Never Worked Unknown 99 406 622 110 295 64 116 54 5.6 23.0 35.2 6.2 16.7 3.6 6.6 3.1 122 595 1026 206 591 140 247 142 4.0 19.4 33.4 6.7 19.3 4.6 8.0 4.6 126 605 1053 213 607 142 261 165 4.0 19.1 33.2 6.7 19.1 4.5 8.2 5.2 Social Class Father *:
Professional Non Manual Other Profess. Non Man. Skilled Non-Manual Skilled Manual Semi Skilled Unskilled Never Worked Unknown 181 382 225 421 198 40 14 305 10.2 21.6 12.7 23.8 11.2 2.3 0.8 17.3 237 556 364 734 348 82 35 713 7.7 18.1 11.9 23.9 11.3 2.7 1.1 23.2 242 569 375 747 355 85 36 763 7.6 17.9 11.8 23.5 11.2 2.7 1.1 24.1 Family Highest SES*:
Professional Non Manual Other Profess. Non Man. Skilled Non-Manual Skilled Manual Semi Skilled Unskilled Never Worked Unknown 211 502 555 230 180 27 31 30 11.9 28.4 31.4 13.0 10.2 1.5 1.8 1.7 275 759 946 444 391 76 84 94 9.0 24.7 30.8 14.5 12.7 2.5 2.7 3.1 281 776 974 452 406 79 88 116 8.9 24.5 30.7 14.2 12.8 2.5 2.8 3.7 * Taken from first parent questionnaire
Fewer students in receipt of FSM returned the all about me questionnaire (12.9% compared to 17.7% of the full sample), and there were less students with multiple disadvantage returning the
7 Table 1.3: Selected employment and disadvantage characteristics for the valid sample of Year 9
students included in the dispositions analysis compared to the overall sample EPPSE Dispositions
sample Year 9 (n=1766)
EPPSE sample at start of primary school
(n=2754)
Full EPPSE sample (n=3172)
n n % n % %
Income indicator Year 9 Free school meals No Free school meals Unknown 228 1463 75 12.9 82.8 4.2 548 2267 254 17.9 73.9 8.3 562 2314 292 17.7 73.0 9.3 Employment status of mother
during pre-school period*: Not working
Working part-time Working full-time
Self-employed/combination part-time & self employed
Unknown 770 580 295 86 35 43.6 32.8 16.7 4.9 2.0 1521 868 456 129 95 49.6 28.3 14.9 4.2 3.1 1572 890 463 130 111 49.6 28.1 14.6 4.1 3.3 Total Multiple disadvantage*:
0 1 2 3 4 5+ Unknown 447 505 340 168 117 80 109 25.3 28.6 19.3 9.5 6.6 4.5 6.2 637 761 594 379 247 202 249 20.8 24.8 19.4 12.3 8.0 6.6 8.1 644 781 613 391 257 213 273 20.3 24.6 19.3 12.3 8.1 6.7 8.2 Salary of family during KS1:
No salary £2500-15000 £17500-27500 £30000-35000 £37500-66000 £67500-132000+ Unknown 279 289 293 198 347 141 219 15.8 16.4 16.6 11.2 19.6 8.0 12.4 589 484 411 271 470 173 691 18.5 15.8 13.4 8.8 15.3 5.6 22.5 569 485 411 271 470 173 793 17.9 15.3 13.0 8.5 14.8 5.5 25.0 Salary of family during KS2:
8
Section 2: Students dispositions at the end of Year 9
In this section we describe some of the questionnaire results in terms of students’ responses to individual survey items and provide some examples of differences in students’ dispositions for different background factors. Students’ responses to individual items are looked at in this section with analyses of difference between student groups related to gender, socio-economic status and SEN status3.
Importance of academic achievement and academic self-concepts
Students were fairly positive in terms of their views of their academic ability (see Table 2.2), in line with research elsewhere (Kintrea et al 2011), but approximately one quarter to a third of students indicated they were less confident about their ability in English and maths (see Table 2.1). Overall, students’ responses to individual ‘English and maths academic self-concepts’ questions were only weakly related4.
There were some significant differences between girls and boys, with boys significantly more likely to have a higher ‘self-concepts in maths’ and girls in English for three of the five questionnaire items (girls did not significantly differ to boys in how good they felt they were compared to others in English or how easy the work was in English). Students in receipt of FSM had significantly poorer ‘academic self-concepts’ than other students for all the items except ‘I have always done well in maths classes’, where no significant differences were found.
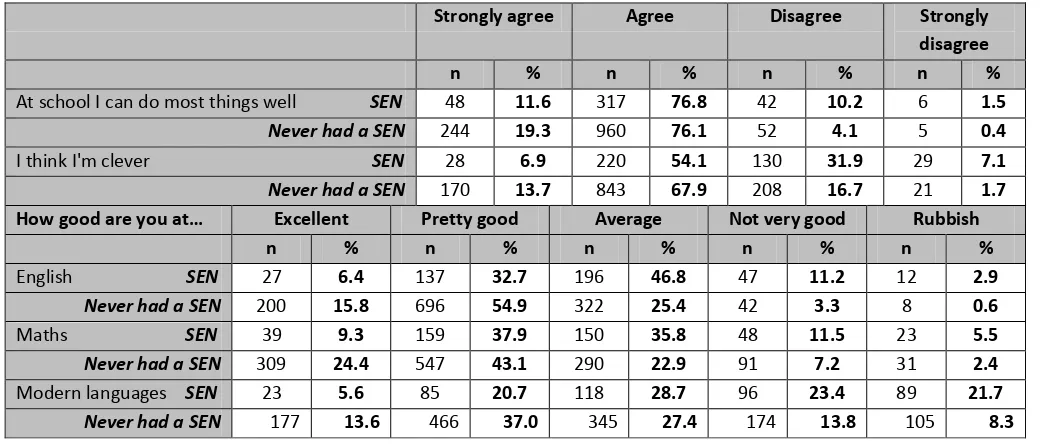
Large differences were found for all the English and maths individual items for students who were classed as having a Special Educational Need (SEN), with SEN students having significantly poorer self-concepts than other students (for example only 13% of SEN students strongly agree they learn things quickly in maths compared to 24% of other students).
Table 2.1: Students’ overall responses to items measuring Maths and English self-concepts in Year 9
Academic self-concepts in English and maths
Strongly agree
Agree Disagree Strongly disagree
English n % n % n % n %
I learn things quickly in my English classes 340 19.5 1024 58.8 349 20.0 28 1.6
I have always done well in my English classes 309 17.7 934 53.5 468 26.8 34 1.9
Compared to others my age I am good at English 234 13.4 875 50.2 587 33.7 46 2.6
Work in my English classes are easy for me 183 10.5 904 51.9 603 34.6 52 3.0
I get good marks in English 296 17.1 1149 66.2 260 15.0 30 1.7
Maths n % n % n % n %
I learn things quickly in my maths classes 372 21.3 913 52.3 367 21.0 95 5.4
I have always done well in my maths classes 361 20.7 858 49.3 438 25.0 85 4.9
Compared to others my age I am good at maths 324 18.6 806 46.2 520 29.8 93 5.3
Work in my Maths classes are easy for me 202 11.7 758 43.8 675 39.0 97 5.6
I get good marks in Maths 347 20.0 1081 62.3 250 14.4 58 3.3
Students were generally confident about their ability (93%), and over three quarters of students thought of themselves as clever (76% of students agree or strongly agree with this statement). Students appeared to be most confident about their ability in English, Science and ICT and least confident for Modern languages.
3 Students who were on the SEN register in Year 9 or who had previously had a SEN in Year 5 or earlier 4
Correlations between same items for English and maths were highest for ‘compared to others my age I am good at
English/maths’ r=0.19**, ‘Work in my English/maths classes are easy to me’ r=0.15**, and ‘I get good marks in
9 Girls and boys did not differ significantly in how well they felt they could do things at school, but boys were slightly more likely to believe they were clever than girls (79% of boys agreed with this statement compared to 73% of girls). There was a significant gender effect for how students viewed their ability in the individual subjects, with boys more likely to think they were good at maths, science, ICT and sport and girls more likely to think they were good at English, Arts/creative subjects and Modern languages.
The largest differences were found for sport (35% of boys and 19% of girls felt they were excellent at this subject), maths (25% of boys and 17% of girls felt they were excellent at this subject) and the Arts (17% of boys and 25% of girls felt they were excellent at this subject).
[image:22.595.45.567.297.522.2]Students in receipt of FSM had a lower general academic self-concepts (thinking they can do things well and clever), and were also less likely to think they were good at English, maths and Modern languages than other students. The largest effects were found for Modern languages (32% of students in receipt of FSM thought they were excellent or pretty good compared to 46% of other students).
Table 2.2: Students’ responses to items measuringacademic self-concepts in Year 9
Strongly agree
Agree Disagree Strongly disagree n % n % n % n %
At school I can do most things well 307 17.6 1328 75.9 103 5.9 1 0.6
I think I'm clever 210 12.2 1104 64.1 359 20.8 50 2.9
During class I usually know what I am supposed to do 311 18.3 1245 73.1 134 7.9 14 0.8 How good are you at… Excellent Pretty good Average Not very good Rubbish
n % n % n % n % n %
English 235 13.3 874 49.6 539 30.6 94 5.3 20 1.1
Maths 367 20.8 735 44.7 460 26.1 145 8.2 55 3.1
Science 329 18.7 784 44.5 491 27.9 131 7.4 26 1.5
ICT 287 16.4 726 41.5 516 29.5 174 9.9 47 2.7
Arts/creative subjects 368 21.0 677 38.6 412 23.5 202 11.5 95 5.4
Sport 473 26.9 602 34.2 429 24.4 160 9.1 95 5.4
10 SEN students had a significantly poorer view of how clever they were and whether they could do things well (see Table 2.3 below). They were also significantly less likely to think they were good at all of the subjects except Sport. The largest differences were found for English, Modern Languages and Maths.
Table 2.3: Academic self-concepts in Year 9 split by SEN status
Strongly agree Agree Disagree Strongly disagree
n % n % n % n %
At school I can do most things well SEN 48 11.6 317 76.8 42 10.2 6 1.5
Never had a SEN 244 19.3 960 76.1 52 4.1 5 0.4
I think I'm clever SEN 28 6.9 220 54.1 130 31.9 29 7.1
Never had a SEN 170 13.7 843 67.9 208 16.7 21 1.7 How good are you at… Excellent Pretty good Average Not very good Rubbish
n % n % n % n % n %
English SEN 27 6.4 137 32.7 196 46.8 47 11.2 12 2.9
Never had a SEN 200 15.8 696 54.9 322 25.4 42 3.3 8 0.6
Maths SEN 39 9.3 159 37.9 150 35.8 48 11.5 23 5.5
Never had a SEN 309 24.4 547 43.1 290 22.9 91 7.2 31 2.4
Modern languages SEN 23 5.6 85 20.7 118 28.7 96 23.4 89 21.7
Never had a SEN 177 13.6 466 37.0 345 27.4 174 13.8 105 8.3
Subject popularity
It is clear that some subjects are more popular than others. Sport and the Art/creative subjects were much more popular than other subjects for the EPPSE sample (58% liking Sport a lot and 49% liking Arts a lot), whereas Modern languages were the least popular (only 20% liking them a lot). Roughly a third of students indicated they liked English, maths, science and ICT a lot.
Significant gender differences were found for all subjects with boys liking maths, science, ICT and sport more than girls and girls liking English, the Arts and Modern languages significantly more than boys. The largest differences were found for sport (72% of boys like this subject a lot compared to 45% of girls), and the Arts (38% of boys like this subject a lot compared to 59% of girls).
Students in receipt of FSM had more positive views of ICT than other students (90% liked ICT a lot or average compared to 83% of other students). They were also slightly less positive about Sport (52% liked Sport a lot compared to 59% of other students).
11 Table 2.4: Popularity of school subjects in Year 9
How much do you like.. A lot Average Not at all
n % n % n %
English 499 28.4 1080 61.4 181 10.3
Maths 505 28.7 922 52.4 332 18.9
Science 610 34.7 916 52.1 233 13.2
ICT 605 34.5 855 48.8 293 16.7
Arts/creative subjects 855 48.9 603 34.5 290 16.6
Sport 1020 58.1 518 29.5 219 12.5
Modern languages 341 19.6 716 43.6 643 36.9
Students in Year 9 had strong views about the importance of gaining qualifications from GCSEs to a university degree. Almost all students felt it was important to get 5 good GCSEs (99%) and just less than nine out of ten students (88%) felt it was important to get a university degree. Girls were more likely than boys to think ‘A’ levels or a degree were important, although the difference was not large (76% of girls felt ‘A’ levels were very important compared to 72% of boys; 65% of girls felt a university degree was very important compared to 58% of boys).
[image:24.595.44.546.396.500.2]Students in receipt of FSM were more likely to think a qualification for a particular job was important (71% thought it was very important compared to 61% of other students). SEN students were somewhat less likely to feel academic qualifications were important. For example SEN 77% of SEN students felt it was very important to get 5 good GCSEs compared to 88% of other students.
Table 2.5: Year 9 students’ views on the importance of academic qualifications
How important is it to you to get… Very important
Fairly important
Not very important
Not at all important n % n % n % n %
5 good GCSEs (A*-C) or equivalent 1496 85.5 227 13.0 21 1.2 6 0.3
Qualification for a particular job e.g. car mechanic, etc 1072 61.5 460 26.4 157 9.0 54 3.1
‘A’ levels 1291 73.9 368 21.1 73 4.2 14 0.8
A university degree 1071 61.4 450 25.8 187 10.7 37 2.1
Subject choices
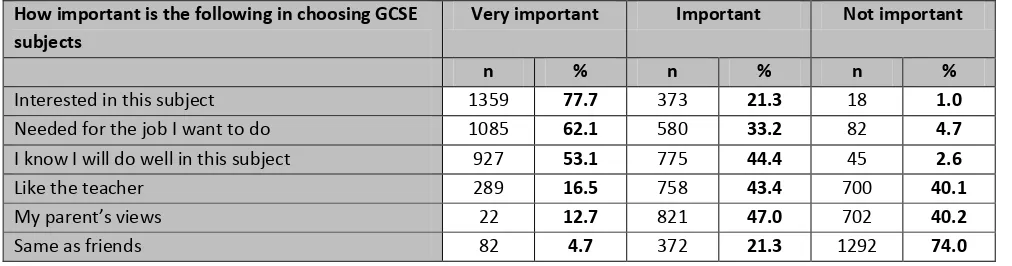
In Year 9 students choose the main GCSE courses they will be taking in Years 10 and 11. The three main reasons for GCSE choice given by students were interest in the subject (78% felt it was very important), needed for the job they wanted to do (62% very important) and knowing they will do well in this subject (53% very important).
Boys were slightly more likely to choose a subject because of their parents view (63% of boys said this was important or very important, compared to 58% of girls) and because it was the same as friends (32% of boys said this was important or very important, compared to only 21% of girls).
Students in receipt of FSM were a little less likely to choose their GCSE subjects because they were interested in the subject (74% thought it was very important compared to 78% of other students), more likely to choose GCSEs because it was needed for a job (70% thought it was very important compared to 61% of other students), because of parents views (66% thought it was important or very important compared to 58% of other students), and because it was the same as friends (33% thought it was important or very important compared to 25% of other students).
12 Table 2.6: Students’ reasons for GCSE choice in Year 9
How important is the following in choosing GCSE subjects
Very important Important Not important
n % n % n %
Interested in this subject 1359 77.7 373 21.3 18 1.0
Needed for the job I want to do 1085 62.1 580 33.2 82 4.7
I know I will do well in this subject 927 53.1 775 44.4 45 2.6
Like the teacher 289 16.5 758 43.4 700 40.1
My parent’s views 22 12.7 821 47.0 702 40.2
Same as friends 82 4.7 372 21.3 1292 74.0
Other reasons mentioned in an open ended response were enjoying or liking the subject (n=160), and being good at the subject at the moment (n=70). Other reasons given by a smaller number of students were finding the subject useful, the quality of the teaching, amount of coursework, learning new skills or being challenged, improving their work in that subject, future choices including career, other’s views and friendships, having a variety of subjects, making the ‘right’ choice and thinking they will try hard in the subject.
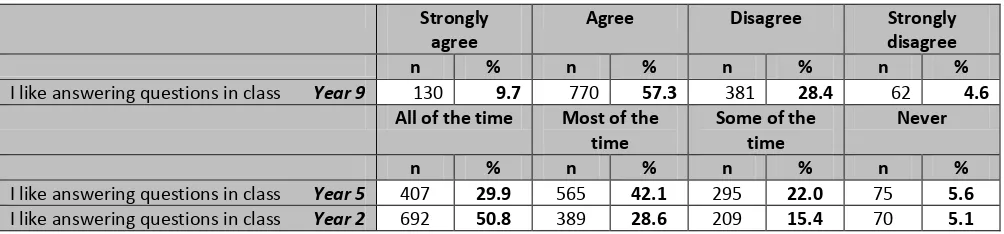
Enjoyment of school
Year 9 students are generally positive about their secondary school experience (see Table 2.7) with only approximately one in ten feeling that they do not like being at school (11% agreed/agreed strongly) or that their school is not a friendly place (10% agreed/agreed strongly). A slightly higher proportion did not ‘like most of the lessons’ (16% disagreed/disagreed strongly with the item).
However, there was a high proportion of students agreeing that they felt bored in lessons (41% agreed/agreed strongly). Two thirds of students (67% agreed/agreed strongly) liked to answer questions in class. Only a very small percentage of students (6% agreed/agreed strongly) believed t