Active ageing and universities:
engaging older learners
This series of Research reports published by Universities UK will present the results of research we have commissioned or undertaken in support of our policy development function. The series aims to disseminate project results in an accessible form and there will normally be a discussion of policy options arising from the work.
This report was produced for Universities UK by Professor Chris Phillipson and Jim Ogg of Keele University.
Acknowledgements
3 Preface
4 Summary
1
6 Introduction 2
8 Methodology
3
10 Demographic aspects of ageing 4
13 Active ageing and the value of learning in later life
5
16 Changing policies and practices towards work and employment
6
18 Responses from employers to older workers and older learners
7
21 Responses to older workers and older learners within formal education
8
33 Barriers and motivations for older people 9
36 Older learners: the development of non-formal education
10
39 Responding to active ageing: issues for universities
Appendix 1
44 Selected UK institutions with centres/institutes for lifelong learning
Appendix 2
46 Examples of initiatives outside the UK 49 Note on data sources
50 References Contents Active ageing and universities: engaging older
Charts
11 Chart 1 Fertility rates in England, 1935–2000
11 Chart 2 Population projections of the UK (thousands by age band), 2008-31
11 Chart 3 Population by sex and age, United Kingdom, 2001/21
18 Chart 4 Percentage of employees who would like work-related training
19 Chart 5 Percentage aged 50-plus who have attended a formal education or training course during the last month by age cohort, Europe
27 Chart 6 Access students by age
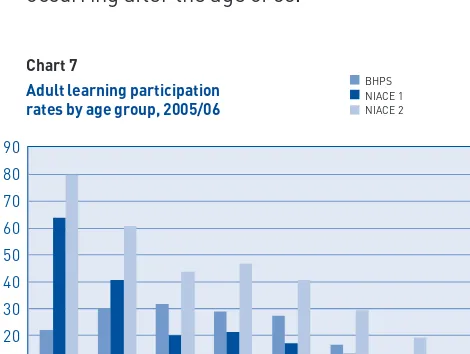
30 Chart 7 Adult learning participation rates by age group, 2005/06
30 Chart 8 Proportion of the British population who took part in training schemes or courses (part-time) within the last six months by occupational status, 2005/06
31 Chart 9 Percentage aged 50-plus who have attended a formal education or training course during the last 12 months by gender and socio-economic group
31 Chart 10 Percentage of people aged 50-plus who have attended a formal education or training course during the last 12 months by gender and age
32 Chart 11 Percentage of people aged 50-plus who have attended a formal education or training course during the last 12 months by gender and occupational status Tables
10 Table 1 UK population growth projections, 2006
18 Table 2 Employees receiving job-related training: by age and sex, United Kingdom, 2008
21 Table 3 Highest qualification held, by sex and age, 2005
22 Table 4 Level of highest qualification held by people aged 19–64 in England, 2007
23 Table 5 First-year students (excluding
postgraduate research students) in the UK by selected academic year, age group and level of study, 2007/08
24 Table 6 First-year students (excluding postgraduate research students) on full-time and sandwich courses in the UK by selected academic year, age group and level of study, 2007/08
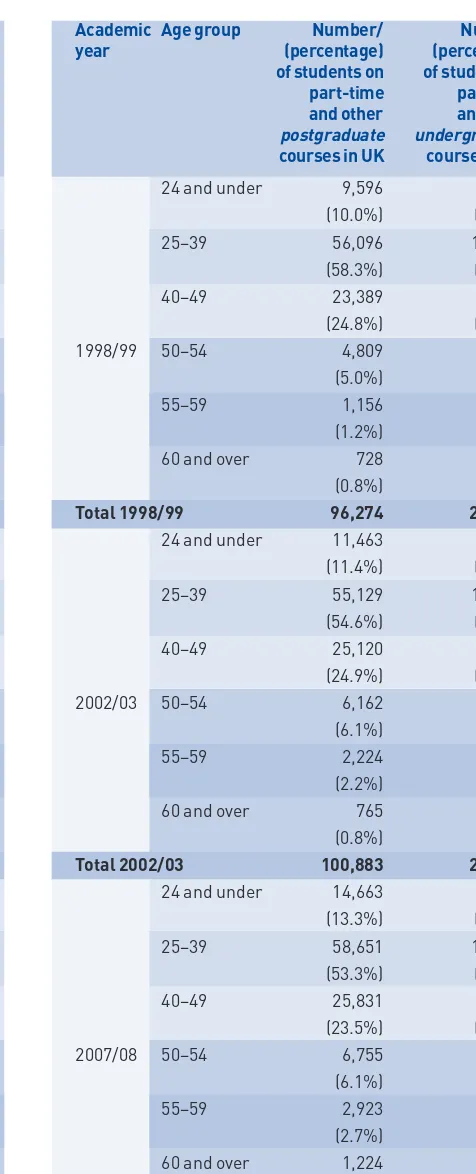
24 Table 7 First-year students (excluding postgraduate research students) on part-time and other courses in the UK by selected academic year, age group and level of study, 2007/08
25 Table 8 Top five subjects studied by full-time students aged 40–49, 2007/08
25 Table 9 Top five subjects studied by part-time students aged 40–49, 2007/08
25 Table 10 Top five subjects studied by full-time students aged 50-plus, 2007/08
25 Table 11 Top five subjects studied by part-time students aged 50-plus, 2007/08
26 Table 12 Type of course attended (male), 2008
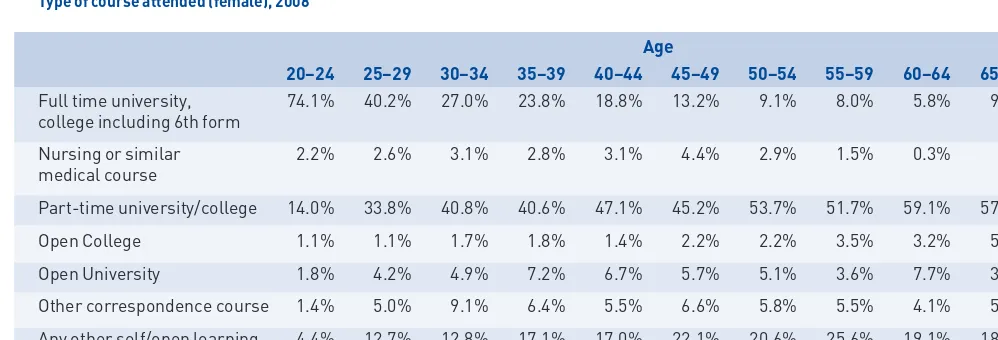
26 Table 13 Type of course attended (female), 2008
28 Table 14 Students working towards a qualification: by age, 2008
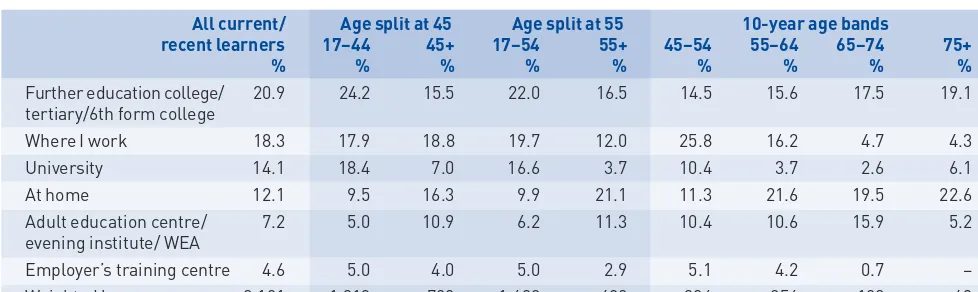
28 Table 15 How current/recent learners found out about their main learning activity
29 Table 16 Main location of learning
30 Table 17 Current or recent participation in learning by age – 1996, 1999, 2002, 2005, 2007, 2008 and 2009
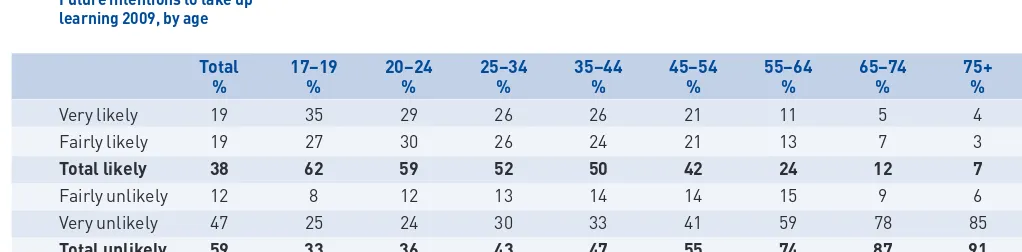
33 Table 18 Future intentions to take up learning 2009, by age
In 2008 Universities UK published two reports arising from a major project analysing how the size and shape of the higher education sector might change over the next 20 years in response to demographic changes. The project considered the demographic data on the age groups most relevant to the future demand for higher
education and developed a set of demand-based projections for the four countries of the UK. It examined the impact of these developments on the different student markets that universities currently operate in. The size and shape project generated considerable interest in the sector and as a result Universities UK decided to publish a number of specific studies of the different student markets, combining an analysis of data about enrolment trends with a discussion of current issues and the opportunities for future growth. The purpose of these studies is to alert member institutions and policy makers to the main issues affecting the future development of these markets. This report on older learners follows the publication of studies on taught and research postgraduates. Further studies on part-time students and the future market impact of private providers will follow later in 2010.
This report reviews the engagement of older learners (defined as those aged 50 and over) in education and training with particular reference to their involvement in higher education. The ageing of populations was one of the most important trends in the 20th century and will raise major challenges in this century. In 2007, for the first time ever in the UK, the percentage of the population under the age of 16 dropped below those of state pension age. The number of people aged 50 to 64 will rise to 21,7 million by 2032, an increase of a million on the 2007 figure. These trends suggest that social institutions will need to find fresh ways of adapting to and supporting an ageing population. The report examines the contribution that higher education might make to this process and suggests how universities might respond to changing patterns of demand (which will be influenced by varying patterns of work and employment as well as changes in the older age cohort). It also consider how policy changes could remove some of the barriers to the participation of older people in higher education.
5 Presently, only a small proportion of the 50-plus age group is involved in formal educational study. Much of the growth in the numbers of mature students on part-time undergraduate and postgraduate courses has been taken up by students in their 30s and 40s, with 50 remaining a point at which educational activity goes into sharp decline.
6 In the UK, a number of universities has developed centres or institutes of lifelong learning. Most of these build upon a
longstanding university adult and continuing education tradition, promoting a wide range of courses to the general public. Despite this, such courses have yet to reflect the changing needs and aspirations of a new cohort entering what has been termed the ‘third age’ following full-time employment.
7 Formal education remains a relatively junior partner beside informal learning, with the University of the Third Age (U3A) probably the best illustration with an estimated 670 active groups and around 190,000 older learners.
8 Informal learning has flourished in part because the formal sector has either remained marginal or has substantially withdrawn from
engagement with older learners: the number of people aged 60 and over participating in further education declined by 38 per cent between 2005/06 and 2006/07. There has been a long-term decline in those participating in adult and community learning. In higher education, the problems facing older learners may be increased by the withdrawal of institutional funding for students studying for a qualification at a level equivalent to or lower than the
qualification they already hold (ELQs).
9 In terms of activities with older learners, universities might pursue four possible pathways:
p
Educational and personal developmentprogrammes: these would build upon existing work in adult and continuing education, but would identify new types of courses and markets among a diverse and segmented post-50 market.
p
Employment-related programmes: thesemight support the policy objective of extending working life, although the extent of employer-demand may be fragile in the context of high levels of unemployment. The development of Findings
1 This report reviews the engagement of older learners (defined as those aged 50 and over) in education and training, with particular attention to their involvement in higher education.
2 The ageing of populations was one of the most important developments of the 20th century and will raise major challenges for life in the 21st. The proportion of the UK population aged 65 and over has increased steadily over the past 35 years: from 13 per cent of the population in 1971 to 16 per cent in 2008; it is projected to reach around 20 per cent by 2026. In 2021 there will be nearly 1 million more adults between the ages of 55–64 than in 2011, with many among this group keen to participate in higher education.
3 Ageing will be transformed in the 21st century, with:
p
increases in life expectancy – currentlystanding in the UK at 17.4 years at age 65 for men and 20 years at age 65 for women
p
changes in social attitudes – with traditionalstereotypes of old age challenged by the post-war ‘baby boom’ generation
p
new social roles – with greater engagement incommunity and leisure activities
p
extended activities associated withemployment – illustrated by the rise in self-employment, part-time working and consultancy work.
4 Higher education can be a key partner shaping responses to demographic change. It can achieve this in four main ways:
p
playing a leading role in creating a new type ofageing for the 21st century, built around extended economic, family and citizenship roles
p
supporting women and men planning the twodecades or more likely to be spent beyond their main work careers
p
unlocking mental capital and promotingwellbeing in later life
p
supporting a range of professional andp
Linking with regional development agencies toestablish co-funded projects with employers around training programmes targeted at older workers: this may be especially important given pressures to reduce training
opportunities for workers in a period of economic recession.
p
Targeting the 50-plus self-employed group,many of whom will be career/job changers with specific training requirements.
p
Establishing partnerships with Age UK andother relevant voluntary organisations to develop educational programmes focused on tackling social exclusion in later life: co-funding through government and other agencies would be one avenue to explore. Developing innovative programmes that incorporate new social groups within the older population and those about to enter
retirement should be a key strategy for educational policy.
p
Developing ageing as a niche area foracademic development but combining teaching older adults with a research focus.
11 Contents of the report:
p
Sections 1–5 review the background to thediscussion and highlight demographic and policy issues raising the profile of older learners.
p
Sections 6–7 discuss the involvement of olderlearners in training and higher education.
p
Sections 8–9 review barriers to participation informal education compared with evidence of activity in non-formal, self-help groups.
p
Section 10 reviews several initiatives andpolicy issues aimed at engaging older learners in higher education.
p
Social inclusion programmes: substantialnumbers of older people – in current as well as succeeding cohorts – remain trapped in a cycle of educational and social disadvantage. Higher education institutions, with partners such as local authorities, community colleges and the major national charities, should focus on ‘widening participation’ for older as well as younger age groups.
p
Health and social care programmesorientated to professionals working with older people: these could run from foundation degrees through to modules for continuing professional development, with the theme of maintaining ‘active ageing’ as a key
component.
10 Specific areas for development in universities might include:
p
Piloting new undergraduate curriculum areasrelevant to a cadre of service professionals working on behalf of older people: the demand for undergraduate programmes in
gerontology is untested in the UK context but is a major area in the United States.
p
Developing modules on ‘active ageing’ as acomponent in professional training for health and social care professionals: this could be a core or ‘elective’ on undergraduate programmes and/or part of continuing professional
development.
p
Developing outreach programmes targeted atolder people: this could be done in
partnership with further education colleges or as a feature of new university centres within local communities.
p
Establishing centres/institutes for learning inretirement in geographical areas with substantial ageing populations: these could be co-funded ventures working with primary care trusts, further education colleges and local authorities. They could combine health promotion and educational issues. They could build upon the existing adult education tradition but develop new programmes appropriate to a cohort of older people with an extended period of initial and higher
education.
p
Developing educational programmes that1.4 In the UK, consideration of older learners has remained largely absent from debates about the future of higher education.4
Only a small proportion of those aged 50-plus is involved in formal educational study. Much of the growth in the numbers of mature students on part-time undergraduate and postgraduate courses has been taken up by students in their 30s and 40s, with 50 remaining a dividing point at which educational activity goes into sharp decline (see section 7). This remains the case with formal educational activity; there is a more positive picture of informal activity, however, with the growth of various voluntary and self-help organisations (see section 9).
1.5 The fall in educational activity among those aged 50-plus has considerable significance for key areas within social and economic policy. UK public policy has embraced the concept of ‘active ageing’5
defined as: ‘the process of optimising opportunities for health, participation and security in order to enhance the quality of life of people as they age’.6
Within this approach, lifelong learning is identified as contributing to the social environment by supporting people in later life (see section 4).
1.6 When it comes to economic policy, promoting the employability of older workers has been a key development, with moves to increase pension ages and remove incentives for early retirement or early exit from the workforce (see section 5).7
Attempts to extend working life for women and men in their 50s and 60s highlight a major challenge for improving the quality of work-based training (discussed in section 6); educational institutions have had to consider how they might provide appropriate forms of support.
1.7 Patterns of employment are also changing among a significant proportion of the population aged 50 and over. Many people are switching careers, with a trend towards self-employment and an interest in flexible working.8
Those in transition between different types of
employment are likely to contribute to demands for new types of education and training in order to achieve their career objectives.
1.1 In 2007, for the first time ever in the UK, the percentage of the population aged under 16 dropped below those of state pension age. In the same year there were 20.7 million people aged 50 and over. By 2032 there will be around
1 million more people among those aged 50 to 64, and a rise of around 1.5 million among those 65 and 69.1
Even more striking is the projection that the majority of babies born since 2000 in the UK (and across most developed countries of the world) is likely to reach their 100th year.2
These trends suggest that social institutions will need to find fresh ways of adapting to and supporting an ageing population. This report examines the contribution of higher education to this process.
1.2 The report examines the involvement of older learners (defined as those aged 50 and over) in training and higher education, and potential changes in patterns of demand given the expansion of this group over the coming decades. Educational activity covers a broad spectrum of programmes. Studying full-time for a degree in order to progress to a career is a substantially different activity to learning a foreign language for a few hours a week primarily as a leisure interest. Educational activity also encompasses a wide range of learning environments, from universities to vocational and professional training undertaken at local colleges, community centres or the workplace. These different types of educational pursuits, the environments within which they are undertaken and the duration of the course (for example, full- or part-time) can be considered as highly diverse market sectors within the
education system.
1.3 Since the 1970s, there has been a rapid
expansion of higher education, with the student population increasing from 621,000 to 2.4 million over the period 1970/01 to 2007/08. This
development reflects the entry of previously under-represented groups (notably women) into the university system and the diversification of institutions, with the recognition of colleges and polytechnics as universities. At the same time, discussions have continued around the
1.10 As the cohort of people born immediately after the Second World War – the baby boomers – enters retirement, there is increased interest among policymakers in whether individuals within it will challenge traditional notions of ageing. The possibility of a break with the past arises in several different fields. As pioneers of the expansion in consumer culture during the 1960s, it may well be that baby boomers will continue to play a key role in shaping patterns of consumption as they move into old age.14
Active ageing and associated leisure pursuits may become more commonplace and extend into late old age, with education a significant dimension. Higher rates of divorce and separation after the age of 50 may lead individuals to redefine their social identity with educational involvement an important element in this process.15
These expectations, and the ways in which the first of the post-1945 birth cohorts are currently engaging in lifestyles different from those of previous cohorts, have important consequences for future educational activity among older learners.
1.8 Education policy documents such as Building a
society for all ages9
and The learning revolution10
have focused on increasing access to education by older people. The Inquiry into the future of
lifelong learning drew attention to the
significance of demographic change, with the final report emphasising the importance of education for those aged 50-plus.11
The higher education sector’s interest in older learners has also been strengthened by the projected decline in undergraduate student numbers (especially among those aged 18–20) due to take place over the period 2009/19.12
1.9 A limited number of surveys is available reviewing trends in learning among older people (see section 2). Although this research provides information on important areas, such as the types of subjects studied and the courses available, it falls short in several ways. First, most surveys focus on the supply side of
2.4 The National Institute of Adult Continuing Education (NIACE) undertakes annual surveys of adult participation in learning, the results of which have been drawn upon in this report.17
We have also used data from the 2005 survey published as What older people learn.18
NIACE’s definition of learning is: ‘Learning can mean practising, studying or reading about something. It can also mean being taught, instructed or coached. This is so you can develop skills, knowledge, abilities or understanding of something. Learning can also be called education or training. You can do it regularly (each day or month) or you can do it for a short period of time. It can be full-time, or part-time, done at home, at work, or in another place like college. Learning does not have to lead to a qualification. We are interested in any learning you have done, whether or not it was finished’. Following this definition, NIACE creates two indicators – the percentage of respondents who are currently undertaking some learning activity (NIACE 1) and the percentage who are currently doing some learning activity or have done some learning activity in the last three years (NIACE 2). This distinction is highlighted in chart 7.
2.5 We have undertaken secondary analyses of existing data sources to supplement the NIACE studies and other official sources. These have been drawn from the English Longitudinal Study of Ageing (ELSA), a dataset that contains
information on approximately 12,000 persons aged 50 and above, the Survey of Health, Ageing and Retirement in Europe (SHARE), the British Household Panel Survey (BHPS) and the Annual Population Survey.
2.5.1 Data from ELSA are taken from the Waves 1–3 (Wave 1, 2002/03; Wave 2, 2004/05; Wave 3, 2006, 2007). The data are presented cross-sectionally. In each Wave, respondents were given a show card and asked: ‘Did you do any of these activities during the last month?’ The listed activities included ‘attended a formal education or training course’. Respondents were also specifically asked: ‘Did you attend a formal education or training course in the last 12 months?’ We have combined these two sources of information to give a single variable ‘attended a formal education or training course in the last 12 months’.
2.1 There are not many direct sources of data on the current participation levels of older learners in educational activities. The Higher Education Statistics Agency (HESA) groups together
mature and older learners in the category age 30 and above. Regular reports on the profile of universities, such as Patterns of higher education
institutions in the UK16
, do not provide separate figures for the age group 50 and over. We have drawn upon a wide range of published sources, as well as secondary analysis of survey data, to illustrate the involvement of older people within the educational system. We also commissioned a more detailed breakdown of the age composition of undergraduate and postgraduate students from HESA (see further below). These data sources, however, use different definitions of adult learning. For this reason, we include in this section those definitions that the reader should refer to when interpreting the tables and figures throughout the report.
2.2 The main sources of government and official data are the Office for National Statistics and the Government Actuary’s Department. These are used, together with data from the Learning and Skills Council, to provide information on educational qualifications in the general
population. Relevant data have also been drawn from the publication Social trends, which is produced annually by the Office for National Statistics. Data from the Labour Force Survey have been extracted to provide information relating to training issues and older workers.
2.3 New data was also commissioned from the Higher Education Statistics Agency to provide a more detailed breakdown of age groups on
undergraduate and taught postgraduate, full- and part-time courses. The selected years used in this report are 1998/99, 2002/03 and 2007/08.
2.3.1 The relevant tables refer to students on full-time and part-time modes of study. Full-time and sandwich/full-time students are those normally required to attend an institution for periods amounting to at least 24 weeks within the year of study, on thick or thin sandwich courses, and those on a study-related year out of their
2.5.2 Data from the Survey of Health, Ageing and Retirement in Europe is taken from Wave 1 (2002/03). Respondents were given a show card and asked: ‘Did you do any of these activities during the last four weeks?’; the activities included ‘attended a formal education or training course’.
2.5.3 Data from the British Household Panel Survey are taken from Wave O (2005/06). As in previous years, respondents were asked about their participation in training schemes or courses. The precise question was: ‘(Apart from the full-time education you have already told me about) have you taken part in any other training schemes or courses at all since 1 September 2005 or completed a course of training which led to a qualification? Please include part-time college or university courses, evening classes, training provided by an employer either on or off the job, government training schemes, Open University courses,
correspondence courses and work experience schemes (excluding leisure courses, but including continuing courses started)’. The interviews were undertaken between September 2005 and April 2006, meaning that respondents who answered positively to this question had taken part in a training scheme or course within the past six months.
2.5.4 The Annual Population Survey comprises
variables from the Labour Force Survey, with key topics including education, employment, health and ethnicity. The 2008 survey has been drawn upon for analysis of the type of learning programmes undertaken across different age groups.
2.6 We also made an extensive search of relevant national and international websites for material about education and older learners and drew on a review of this area by Anderson19
, produced for the Association of Educational Gerontology. A report published by the American Council on Education20
3.1 The ageing of populations was one of the most important developments of the 20th century and will raise major challenges for life in the 21st. The proportion of the UK population aged 65 and over has increased steadily over the past 30 years: from 13 per cent of the population in 1971 to 16 per cent in 2008 and projected to reach around 20 per cent by 2026. Projected growth in the UK population over the next 10 and 20 years was revised substantially upwards with the release of 2006-based population projections (table 1). By 2033, 23 per cent of the population is projected to be aged 65 and over compared to 18 per cent aged 16 or younger.
3.2 Population ageing will vary among the countries of the UK and within each country. In
England, the Audit Commission21
highlighted the fact that although all local authorities will be affected by demographic change, some will be affected more than others. For example, in 2009, West Somerset Council had the highest proportion of people aged 50 or more (53 per cent), while the London Borough of Tower Hamlets had the lowest (16 per cent). In 2019, the proportion of people aged 50 or more in Tower Hamlets will remain low at 17 per cent, while the proportion in West Somerset will have grown to 60 per cent. Localised variations may be highly significant for some universities when planning their approach to demographic change.22
[image:12.652.69.559.642.734.2]Taking the period 2009–2019, for example, the biggest increase in the proportion of people aged 50 and over will affect South Staffordshire Council, with an increase from 42 per cent to 49 per cent (reaching 51 per cent by 2029). The City of Bristol’s population will show the smallest change between 2009 and 2029. The area’s population of people aged 50 or more will be around 28 per cent in 2009, and is set to remain at less than 30 per cent by 2029.
Table 1
UK population growth projections, 2006
3.3 The increasing number of older people is accompanied by greater diversity. At age 65, average life expectancy in the UK stands at 17.4 years for men and at 20 years for women. With the lengthening of the typical lifespan, experiences of later life now vary hugely from the late 50s to the 90s. The older population is also becoming more ethnically diverse, with the early waves of post-war immigrants now well into retirement. Equally, there are substantial variations in lifestyles, reflecting the influence of gender and social class over the life course. At the same time, the number of people with severe disabilities is rising, reflecting the extent of medical advances over recent decades and improvements in survival rates from serious illness.23
The fastest growing age group in the population is those aged 80 and over, increasing by over 1.1 million between 1981 and 2007 or from 2.8 to 4.5 per cent as a proportion of the total population.
3.4 An important driver of population change over the next 20 years is the combination of the increase in fertility rates that took place in separate waves between 1945 and 1973, commonly referred to as the ‘baby boom’, and the continuing increases in life expectancy. In England (and the UK generally), fertility rates rose dramatically around 1946, declined until around 1953, and then rose again to reach a peak around 1964. This has led commentators to refer to ‘early’ and ‘late’ boomers, with early boomers having been born immediately after the second world war, and late boomers during the late 1950s and early 1960s (chart 1).13
2018 2028
Growth over next Revision since Growth over next Revision since
10 years 2004 20 years 2004
Over 50s 3.5m (17%) +100k 6.2m (30%) +430k
Over 65s 2.3m (24%) +100k 4.9m (49%) +350k
Over 80s 640k (25%) +120k 2.2m (79%) +330k
Chart 1
Fertility rates in England, 1935–2000
Source : Institut National d’Etudes Démographiques (INED) www.ined.fr/en/pop_figures/developed_countries/situation/one_indicator/
3.5 These two peaks of the baby boom will have a significant impact on the population of 50–59 year olds (a key group of older learners) over the next 20 years. In 2008, the ‘early’ baby boomers started to reach retirement age and it is likely, given the higher qualifications among this group, that they will have greater expectations than previous generations in areas such as leisure and education. However, between 2008 and 2019, the ageing of the ‘late’ baby boomers will
significantly boost the number of 50–59 year olds. The number of 50–54 year olds in the population is set to increase from 2008 to 2018, and the number of 55–59 year olds is set to increase from 2010, reaching a peak in 2023. Moving down to those in their mid to late 40s – where there may be a substantial demand for part-time higher
education – the number of 45–49 year olds in the population is set to increase over the period up to 2013 (chart 2).
Chart 2
Population projections of the UK (thousands by age band), 2008–31
Source: Office of National Statistics, Government Actuary’s Department, Online data base,
http://www.gad.gov.uk/Demography_Data/Population/Index.asp
3.6 Similar trends can also be seen in chart 3. Whereas the major increase in the population of 55–64 year olds will take place between 2011 and 2021 (for men, from 3.6 million to 4 million; for women, from 3. 8 million to 4. 2 million), the population of 45–54 year olds will decrease slightly between the years 2011 and 2021.
Chart 3
Population by sex and age, United Kingdom, 2001/21
Source: Social Trends, 37, Office for National Statistics, 2007
3.7 In 2021 there will be nearly 1 million more adults between the ages of 55–64 than in 2011. If predictions concerning the changing aspirations of the late baby boomers are correct and lifelong learning becomes established as an individual aspiration as well as part of government policy, then the growth of this segment of the
population could have a significant impact on educational policy. 3.5 3.0 2.5 2.0 1.5 1.0 0.5 0.0
1935 1940 1945 1950 1955 1960 1965 1970 1975 1980 1985 1990 1995 2000
5,000 4,500 4,000 3,500 3,000 2,500
2008 2010 2012 2014 2016 2018 2020 2022 2024 2026 2028 2030
45-49 50-54 55-59 60-64 65-69 5,000 4,500 4,000 3,500 3,000 2,500 2,000 1,500 1,000 500 0
2001 2005 2011 2021
5,000 4,500 4,000 3,500 3,000 2,500 2,000 1,500 1,000 500 0
2001 2005 2011 2021
3.8 The various age groups will demand different activities. Among those aged 45–54, the demand for job training and professional courses is likely to increase, since many people in this age group will still have a substantial number of working years to complete before they are eligible for a pension. Current employment patterns are often characterised by either forced or desired
employment and career changes (see section 5). If this pattern continues, as appears likely, there could be sufficient demand from those affected to stimulate new forms of participation within higher education. Among those aged 55–64 (currently under-represented in higher education) it is reasonable to assume (given pressures to extend working life) that there will be a demand for employment-related as well as leisure-based forms of education.11
3.9 An expansion in demand for educational activities among the 65-plus population is also likely. In 2007, nearly 50 per cent of the age cohort 50–54 had a Level 3 qualification or above. In 2021, this cohort will be in their mid to late 60s. Given that previous levels of education influence further demands over the life course, it is reasonable to assume that many of these newly retired and well-educated individuals will seek leisure-related educational activities, particularly revolving around the arts and related areas. Much of this will be driven by ideas around active ageing that began to receive attention in European social policy from the late-1990s onwards.24
4.3 Winning the generation game highlighted the ‘sharp decline in the number of people working in their 50s and early 60s, with two out of five of those in their 50s either unemployed or economically inactive’. It focused on ‘enabling and encouraging the over-50s to stay in work’ and ‘helping and encouraging displaced workers to re-enter work’. Its practical policy suggestions included providing career information for older displaced workers, reducing incentives for early retirement, encouraging lifelong learning and promoting flexibility in employment.
4.4 Opportunity age set out a government strategy for active ageing, emphasising a ‘…vision where later life is as active and fulfilling as the earlier years, with older people participating in their families and communities’ [para 30]. Learning and continuing education was viewed as an important element in achieving this objective, with evidence showing how education could ease major transitions in the second half of life. The document proposed:
p
removing the age limit attached to educationalloans
p
prioritising public funds and help for thosewith no qualifications to achieve a Level 2 qualification
p
protecting learning for personal interest,while indicating that some groups of older people would have to pay more for their courses in the longer term (paras 3.26 and 3.28).
4.5 The successor document, Building a society for
all ages, continued to emphasise the importance
of learning but mainly through ‘informal’
networks as an ‘essential social activity’ (para 23) rather than involving formal institutions such as universities or further education colleges.
4.6 An important aspect of social policy has been concerned with challenging social exclusion, defined as the process whereby groups such as older people are marginalised from key areas and institutions within society. Although the link with learning and active ageing was not
developed within this policy, in 2006 the final report of the Social Exclusion Unit (SEU) A sure
start to later life: ending inequalities for older people30identified lifelong learning as an area to
be tested in pilot programmes aimed at empowering older people within communities. Age Concern England31and Help the Aged32(now
merged as Age UK) have also both stressed the value of lifelong learning and the role of
education in tackling social exclusion. 4.1 The concept of ‘active ageing’ emerged during
the United Nations’ Year of Older People in 1999 with subsequent elaboration by the European Union24
and the World Health Organisation (WHO).6
Walker25
suggests that the idea built upon an earlier debate in the United States around notions of ‘successful’26
and ‘productive’ ageing.27
The notion of ‘successful ageing’ focused upon the need to replace new roles and relationships for those lost in middle age; the idea of ‘productive ageing’ developed the theme of older people maintaining activities that would defray some of the costs associated with ageing. The idea of ‘active ageing’ recasts the issues of adjustment in later life by focusing on older people maintaining a broad spread of relationships and activities.
4.2 Education can provide a major contribution to improving the quality of later life. For example, the WHO6
report maintains that social policies which support active ageing will result in fewer disabilities associated with chronic diseases in older age and will lead to more people enjoying a positive quality of life. Opportunities for
education and lifelong learning are cited as part of the social environment contributing to maintaining the health and security of people as they age. The WHO report underlines the association between the employment problems of older workers and low levels of education, stressing the need for continuous training in the workplace and lifelong learning opportunities in the community. The report also highlights the potential of ‘intergenerational learning’ (see section 9) to help bridge age differences and enhance the transmission of cultural values.
4.2.1 Within England and Wales, the theme of active ageing underpins three government policy documents: Winning the generation game:
improving opportunities for people aged 50–65 in work and community activity, published in 2000 by
the Performance and Innovation Unit (PIU) of the Cabinet Office28
, the Department for Work and Pensions’ Opportunity age: meeting the challenges
of ageing in the 21st century’, published in 200529
, and its follow-up Building a society for all ages9
, published in 2009.
4
4.10 Feinstein and colleagues suggest, however, that despite this rhetoric ‘… the Government’s commitment to achieving this objective has focused on the demand by and provision for young full-time learners following on from school or in further education settings’. And they highlight the point that, ‘More recent policy documents focus on the value of lifelong
learning that develops skills that have an obvious labour market objective rather than lifelong learning that promotes wider benefits such as personal development and citizenship…’ (page 3).37
4.11 Learning in later life might be seen as a significant contributor to active ageing, given the evidence about its role in improving the quality of life in old age. Its contribution has been identified at three different levels:
p
assisting transitions through middle and laterlife
p
postponing or delaying some of the physicaland mental problems associated with ageing
p
developing social contacts and support in oldage.
4.12 Adult learning may be especially important in boosting self-confidence about the ability to cope with the social changes associated with ageing. Dench and Regan38, in a study commissioned by
the then Department for Education and
Employment, investigated the impact of learning on older people. They reinterviewed 336
respondents aged between 50 and 71 who had first been interviewed in 1997 for the National Adult Learning Survey (NALS). Respondents reported that learning had led to increases in their self-confidence, enjoyment and
satisfaction with life, positive changes in how they felt about themselves and their ability to cope with everyday living.
4.7 The Audit Commission has assessed the success of local authorities in promoting active ageing21
, as expressed in Opportunity age.29
The
commission concluded that only about a third of councils in England were well prepared for an ageing population and that older people tend to experience councils as organisations that focus on their care needs rather than seeing them as having any wider aspirations and supporting them as learners and volunteers. It called for services that would focus on the underlying causes of dependency in later life.
4.8 The idea of active ageing has been a significant policy initiative, one with considerable
implications for the field of education. However, the precise role of education has yet to be fully articulated, with higher education in particular rarely mentioned in relevant policy documents. This absence of focus on higher education is reinforced by the fact that arguments about the importance of learning for older people have tended to come more from government departments and agencies linked to employment, health and social care, with training and education viewed as important in promoting employment in later life.33
It is also relevant to note here that the Public Service Agreement covering people aged 50 and over (PSA 17) makes no mention of education as an area that might promote ‘independence and wellbeing’ among older people.34
4.9 Active ageing might also be linked to the policy of ‘lifelong learning’, which gathered momentum in educational and social policy thinking through the 1990s.35
On the surface, adopting this perspective might have encouraged a focus on the needs of older learners. The 1988 Green Paper The learning age36
emphasised the
importance of widening access to learning in the following terms:
4.15 More research is needed on the potentially beneficial role of mental stimulation in later life, with evidence suggesting that it can assist in reversing memory decline42
, as well as promoting wellbeing and life satisfaction.43
Mental capital and wellbeing, the report of the Foresight
Project44
, highlighted the extent to which ‘the talents, skills, and experiences of older adults are vastly under-used, and this can affect both their mental wellbeing and the maintenance of their mental capital and capacity’ (page 214). The report noted that, despite evidence about the potential of learning to protect against cognitive decline, current educational policies were overwhelmingly focused on younger people and those in employment.
4.16 Education may also play an integrative role in securing access to new social ties. Social networks in the form of friends and associates have been identified as an important source of life satisfaction and wellbeing in old age.45
Educational activities, provided through formal and informal routes, may be important both in maintaining as well as replacing relationships depleted through retirement and the death of close friends. Age Concern England31
concluded that:
‘…learning can be a way of moving into a new phase of life and making new social ties. One of the reasons people can have negative feelings… [about]…retirement is a fear of isolation and a lack of purpose to life without employment. Learning therefore provides not only a meaningful activity in itself, but also the social networks to replace those of the
workplace. It can help retired people adapt their skills to play a constructive role in society, whether in voluntary activity or through the pursuit of interests that has meaning to the individual’ (page 15).
Help the Aged32
has identified the importance of learning as a means of tackling inequality, concluding that ‘Learning for learning’s sake and the acquisition of new skills are not necessarily different things but there needs to be an awareness of the new types of skills – such as financial literacy, ICT literacy, health literacy and citizenship literacy – older people need to prevent them drifting into isolation and exclusion’ (page 1).
4.17 The potential role of education –and higher education in particular – in developing active ageing is addressed in section 10. The next section reviews changes in work and employment that underpin many of the assumptions behind policy initiatives about older people.
4.13 There is some research that supports the suggestion that education delays some of the physical and mental problems associated with ageing. Jagger39
, drawing on the longitudinal Medical Research Council Cognitive Function and Ageing Study , reported higher levels of education to be associated with increasing longevity and increased years free of disability. Findings from the study pointed to the important link between initial full-time education and impaired mobility in later life:
‘…having nine or less years of full-time education compared to those with 12 or more years was associated with being 70 per cent more likely to become mobility disabled in men and 50 per cent more likely in women. These differences were adjusted for the greater disease burden in the lower educated and thus inequalities in disability were not solely due to poorer health in the lower educated. With regard to recovery, men and women at lower educational levels were significantly less likely to recover from mobility disability although in women this accounted for the greater burden of other health problems’ (page 9).
Jagger argued that education may be a factor helping people ‘adapt to increasing disability either through modifying tasks or employing technical aids’, and that ‘later life could be an opportune time to provide education about strategies to compensate for failing function’ (page 9). The potential of using learning in later life to ‘compensate for ageing’40
raises significant issues both for training future professional workers and for older learners themselves.
4.14 Sorenson41
made similar points about dementia, suggesting that ‘people with a higher level of educational achievement experience the onset of dementia later than people with lower
educational achievements’. She noted, however, that dementia once diagnosed appears to progress much faster in people with higher educational achievement: ‘This has lead
5.4 Policymakers’ focus on older workers has reflected several issues:
p
labour market pressures arising from theincrease in older people in the workplace (projections indicate that around 32 per cent of the working age population will be aged 50 and over by 2021)
p
pension reforms (for example, the 2007Pensions Act) aimed at extending working life and encouraging greater flexibility about when to retire
p
concern over the desirability of earlyretirement, with the social and personal costs emphasised in documents such as Winning the
generation game and Opportunity age.
5.5 People entering their 50s, however, face a number of changes. Moen48identified an
emerging life stage between the years of career building and old age, a period stretching roughly from 50 to 75. She perceived this new phase as creating a mixture of uncertainties and
opportunities: the uncertainties reflected in pressures and insecurities in the workplace (with downsizing and compulsory early retirement); the opportunities developed through a broadening in the range of productive activities (with combinations of work, caring and leisure activities). Schuller and Watson11
highlighted the importance of a ‘third stage’ within the life course, reflected in ‘alternative careers, new interests, a new mix of paid and unpaid work, [and] new family patterns’ (page 95).
5.6 Some of these developments are reflected in the emergence of so-called ‘bridge jobs’, along with the rise of self-employment, these becoming increasingly common among women and men in their 50s and 60s. Research by Cahill and colleagues49, using data from the US Health and
Retirement Study (HRS), found that most older Americans leaving full-time career employment (about 60 per cent of those leaving a full-time career job after 50 and about 53 per cent of those leaving after the age of 55) moved first to a ‘bridge job’ rather than directly out of the labour force. Analysis of the UK British Household Panel Survey, examining job changes among men in their 50s, indicated that around one in five had had spells of part-time, bridging forms of employment.50
5.1 An important context for active ageing,
especially in relation to education, has been the changes affecting work and retirement. In recent years, issues relating to older workers and retirement have become major influences in the development of economic and social policy. In part this has reflected significant changes to retirement as a social institution. Donald Hirsch46
has observed that, throughout the 20th century, the idea of a fixed point of leaving work – at age 60 or 65 – developed as one of the great certainties of life, especially for men. Modern retirement policy was itself a product of the late 19th century, as large private companies and branches of the civil service adopted pension policies of different kinds. Subsequently, at certain periods in the 20th century (during, for example, periods of economic depression), pension provision was extended to a wider range of groups. Modern states became responsible not only for the income maintenance of
substantial sections of the older population but also for determining the rules governing access to different pathways into retirement.47
5.2 Over the past 10 years these ‘pathways’ or ‘transitions’ have become more diverse:
p
Of people leaving full-time permanent jobsbetween 50 and state pension age, as many now enter part-time or temporary positions or become self-employed as leave work
altogether.
p
While men (more than women) are much morelikely to leave work before state pension age than a generation ago, policies now
emphasise later rather than earlier retirement.
5.3 Changes to retirement as an institution have been one element driving a number of significant debates within economic and social policy. Early retirement, while accepted (and indeed in part promoted by government policy) over the course of the 1980s and early 1990s, came under scrutiny from the late 1990s onwards.
Government and pressure groups such as The Age and Employment Network (TAEN) argued for limiting the withdrawal of people aged 50 and over from the workplace, and encouraging those economically inactive back into work.29,9
5.11 How far can education and training provide support during the transitions associated with extended working life or the new forms of engagement associated with family and
community life? The main sections of this report address this issue, beginning with evidence about the extent of support from employers. 5.7 On the one hand, such movements might be
taken as signs of increasing choice for
individuals in reshaping the ending of their work careers. The reality, however, may be otherwise, with many workers moving into ‘bridge
employment’ out of financial necessity and often into contingent or ‘non-core’ areas of the
workforce.49
On the other hand, people may be withdrawing from the workforce because they want to find a new direction to their lives. In the survey by Humphrey and colleagues51
, almost a quarter (23 per cent) of those who had taken early retirement had done so to ‘enjoy life while they were still fit and young’. Among those intending to retire early, 83 per cent gave this response.
5.8 A trend among professional and managerial groups to view their 50s as an appropriate point to ‘take stock’ and possibly leave full-time employment was identified by Scales and Scase52
in their report Fit and fifty, published by the Economic and Social Research Council (ESRC). They found that by the end of the 1990s some groups harboured a firm ‘expectation of early retirement’, with a desire for building a new life beyond their main careers – even in the face of potential financial pressures. This study pointed to changes in priorities over the life course, with an increasing number of people wanting a different direction to their lives. Higher
education, especially for the ‘baby boom’ cohort, could play a major role in reinforcing this trend.
5.9 Whether expecting to retire early will be a brief phenomenon (characteristic of the first baby boom generation) or will become more permanent has important implications for attempts to extend people’s working lives as well as for training and education. Changing attitudes to early retirement may encourage flexible working of different kinds. People may, however, resist taking on the sort of work which they perceive as failing to add to the quality of daily life in middle and older age53
.
5.10 Active ageing may become embedded in the life course in two main ways through:
p
the desire or necessity to maintain one’sexisting career or employment
p
the move (again through choice or necessity)Chart 4
Percentage of employees who would like work-related training
Source: BHPS, Wave O (2005); authors’ analysis
6.3 Humphrey and colleagues51found that while
most employees received some encouragement to learn more job-related skills, this
encouragement tended to fade after 50–54. Thus among men, 58 per cent had received a ‘great deal’ or a ‘fair amount’ of encouragement, this compared with 41 per cent for those aged 60–64 and 35 per cent for those who were 65–69. Among women, the equivalent figures for the 50–54 and 60–64 age groups were 63 per cent and 40 per cent.
6.4 Lissenburgh and Smeaton’s55analysis of Labour
Force Survey data confirmed the link between increased age and declining access to training. Logistic regression models suggested that men and women in part-time and temporary
employment were especially disadvantaged. Humphrey51also found that part-time
employees were less encouraged to learn more job-related skills than full-time colleagues: a third of part-time employees were offered no encouragement, compared with a quarter of full-time employees. Comparative data also show Britain performing below the OECD (Organisation for Economic Co-operation and Development) average for expected hours in job-related education and training.56Analysis of
data from the Survey of Health, Ageing and Retirement in Europe also supports this (chart 5).
6.1 The benefits of learning and training, across all age groups, are now widely acknowledged. The former Department for Education and Skills54
pointed to evidence that ‘older people can benefit substantially from continuing to learn and gain new skills’ (para 210). Given the plans to put back retirement age, the expectation must be that older workers will have the same opportunity as younger people to take part in different types of training and learning. However, evidence suggests that older workers continue to be disadvantaged when it comes to receiving training while employed.
6.2 Table 2 confirms the gradual decline in
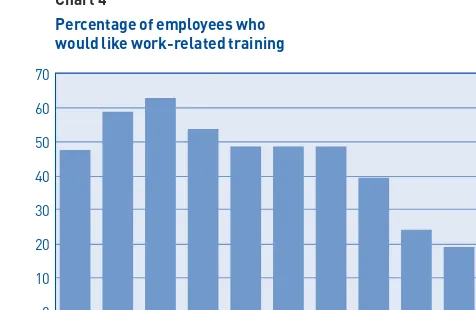
job-related training over the life course. Chart 4 reveals, however, that the decline is not
[image:20.652.325.563.101.256.2]necessarily because of a drop in demand for work-related training, with this holding up in particular for those in the 40–55 age group. The falling away after age 55 though is noteworthy, reflecting both discrimination in access to training as well as negative attitudes among older workers themselves.
Table 2
Employees receiving job-related training1by age and sex, United
Kingdom, 20082
Percentages
Men Women
16–17 26.4 15.6
18–24 19.0 19.8
25–34 14.6 17.2
35–49 11.9 16.6
50–59/643
9.2 12.9
1 Employees (those in employment excluding the self-employed, unpaid family workers and those on government programmes) who received job-related training in the four weeks prior to interview 2 Data are at Q2 (April–June) and are not seasonally adjusted 3 Men aged 50–64 and women aged 50–59
Source: Social Trends 39 Office for National Statistics, 2009
70
60
50
40
30
20
10
0
6.6 Employers vary considerably in their approach to training. McNair and colleagues62
found that in large firms people continued to develop skills more regularly than those in small and medium-sized enterprises. Some occupational sectors (notably managerial and professional groups) were more likely to provide training than others (for example those in elementary occupations). And level of skill and qualification (or human capital) appears critical – those with higher degrees and/or professional qualifications were more likely to participate in training later in working life than those with lower level qualifications. For professional/managerial groups, external pressure to extend working life may not be a major issue given that higher qualifications and socio-economic class are strong predictors of longer working life.62
For some manual groups, lack of training may be difficult to make up for in later life, especially given limited workplace opportunities and depressed expectations about learning.
6.7 Among unemployed and economically inactive people, Newton and colleagues58
found that less than one in 10 reported involvement in training and that training participation declined rapidly with age. The likelihood of someone aged 55 and over participating in training was 50 per cent less compared with an adult aged 35–44. McNair and colleagues62
found that levels of support given to those changing their job declined with age. Older workers were less likely than younger ones to receive any help during a job transition (37 per cent of older workers, against 47 per cent of those under 50). They were less likely to receive training from their employers, help from their workmates and colleagues, or support from a government agency. They were also less likely to have sought out support for themselves, either through the internet or other informal sources.
Chart 5
Percentage aged 50-plus who have attended a formal education or training course during the last month by age cohort, Europe
Source: Survey of Health, Ageing and Retirement in Europe (SHARE), Wave 1; ELSA, Wave 2; authors’ analysis
6.5 We do not know enough about why older workers fail to take up opportunities for education and training. They may lack confidence about learning new skills57or feel that acquiring them
is unnecessary or may go unrewarded58. Taylor
and Urwin’s59research suggested that declining
participation in training was linked to employers’ decisions rather than an individual preference not to undertake training. Urwin60, on the other
hand, argued that not only may training be less likely to be offered to older individuals, but also that ‘large proportions of this group have not taken up the opportunity to train’. Moss and Arrowsmith61concurred, suggesting that
‘attitudinal barriers’ can limit responses to training: ‘…some [Jobcentre] customers may either feel that it is too late in their life to learn basic skills that they have managed to survive without for so long, or, if they have worked before, that they do not need a course that offers basic employability skills’ (page 24).
Switzerland Sweden Denmark Belgium Netherlands England Germany France Greece Austria Spain Italy
0 5 10 15 20 25 30 35
6.8 Against the above, largely negative findings, must be balanced more positive developments which may be important over the medium and longer term. Future generations of older
workers can be expected to have higher levels of basic numeracy and literacy skills and this should have a major impact on areas such as participation in continuing education and training. Dixon63
noted from the Labour Force Survey the strong relationship between level of qualification and the likelihood of undertaking job-related training; those with higher existing qualifications were also more likely to be studying for a new qualification. She concluded that ‘these relationships suggest that
age-specific differentials in learning activity could flatten in future as the fraction of older workers who have not completed secondary education gradually declines’ (page 74).
6.9 Evidence suggests that older people are just as willing to invest in learning new skills as younger age groups. Taylor and Urwin59
found that, despite the shorter time horizons of those in the 50–64 age group, a similar proportion to those in the 25–39 and 40–49 age groups (20 per cent) had self-financed their own training. Economic growth in the second half of the 1990s may have had some impact in reducing training
differentials between age groups. Urwin60
suggested some ‘catch-up’ in the period 1992–2002 when comparing the training received by older and younger workers, reflecting a cyclical component with improved economic prospects allowing firms to increase the amount of money allotted to formal
education and training. Conversely, periods of economic recession may introduce new forms of discrimination against older workers, especially in areas such as training and education.64, 65
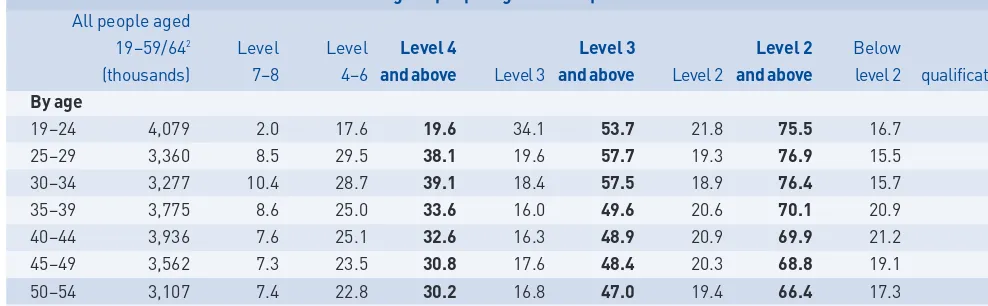
Table 4 illustrates this point through NVQ levels: around one in three people in their late 40s and early 50s has a level 4 qualification or above; and nearly one in two level 3 and above. Conversely, 16 per cent of those aged 50–54 and 20 per cent of those aged 55–64 are recorded as having ‘no qualifications’.
7.1 This section examines participation by older learners in formal education and higher education in particular. We have drawn on a variety of sources, most of which focus on different age groups in the 50-plus age band, but with some analysis of younger age groups for comparison.
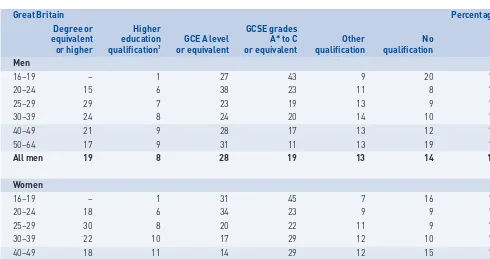
7.2 The level of older learners’ qualifications has an obvious impact on their access to higher education. Table 3 shows that 17 per cent of men aged 50-64 and 12 per cent of women aged 50-59 have a degree or equivalent or higher; among those aged 40–49 the figure for men is 21 per cent and for women 18 per cent.
7
[image:23.652.66.556.331.590.2]Responses to older workers and older learners within formal education
Table 3
Highest qualification held1by
sex and age, 20052
Great Britain Percentages
Degree or Higher GCSE grades
equivalent education GCE A level A* to C Other No
or higher qualification3
or equivalent or equivalent qualification qualification All
Men
16–19 – 1 27 43 9 20 100
20–24 15 6 38 23 11 8 100
25–29 29 7 23 19 13 9 100
30–39 24 8 24 20 14 10 100
40–49 21 9 28 17 13 12 100
50–64 17 9 31 11 13 19 100
All men 19 8 28 19 13 14 100
Women
16–19 – 1 31 45 7 16 100
20–24 18 6 34 23 9 9 100
25–29 30 8 20 22 11 9 100
30–39 22 10 17 29 12 10 100
40–49 18 11 14 29 12 15 100
50–59 12 12 12 21 16 27 100
All women 17 9 18 27 12 15 100
1 Men aged 16 to 64, women aged 16 to 59
2 January to December. See Appendix, Part 4: Annual Population Survey 3 Below degree level
7.4 Among part-time students, however, the 50-plus group is better represented, comprising 15 per cent of all first-year part-time undergraduates in 2007/08 (a similar proportion to 1998/99) and 10 per cent of first-year part-time
postgraduates. This adds up to nearly 62,000 students across the UK (an increase of around 18,400 since 1998/99). Those aged 60 and over comprise 6 per cent of first-year students in the UK, a total of nearly 20,000 students (a slight fall though in percentage terms since 1998/99). The 50-plus sub-divide into three groups:
p
those undertaking professional/vocationalqualifications (sometimes supported by their employer)
p
those taking non-vocational courses (forexample, in adult and continuing education) – an important market for those aged 60 and over
p
those studying for a degree but preferring a7.3 Set against the data on qualifications, how many older people are there in higher education? HESA statistics were commissioned for this report to examine participation on
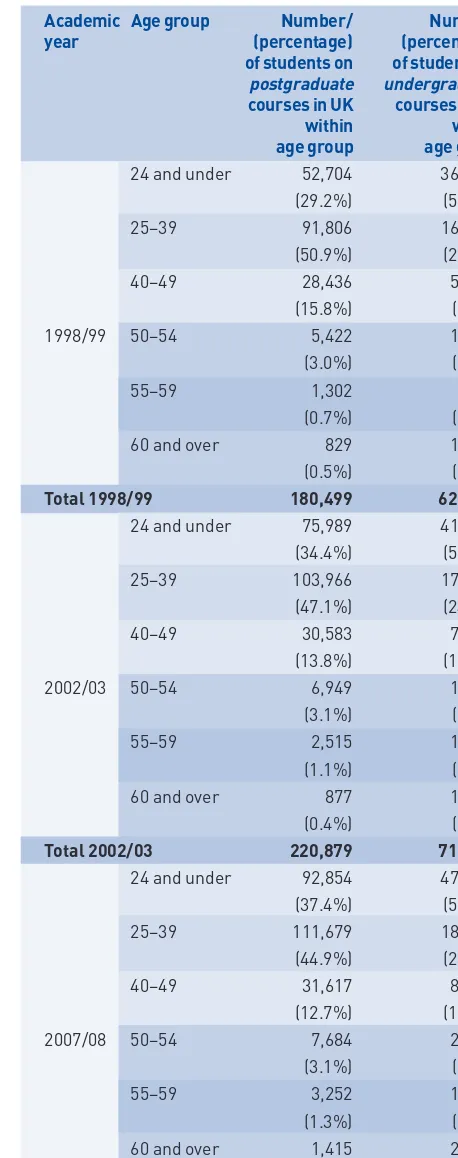
undergraduate and postgraduate taught programmes, full- and part-time. Tables 5-7 examine trends from 1998/99 to 2007/08 for first-year undergraduate (full- and part-time) and first-year postgraduate (taught only full- and part-time) students, across all age groups. The findings confirm the sharp drop after age 50 in these various modes of study. Full-time 50-plus students remain a tiny group within UK
[image:24.652.68.562.159.312.2]universities, with fewer than 4,000 first-year students on undergraduate and postgraduate courses in 2007/2008 (an increase of around 1,400 from 1998/1999).
Table 4
Level of highest qualification held by people aged 19–64 in England, 2007
Percentage of people ages 19–64 qualified at each level1 All people aged
19–59/642 Level Level Level 4 Level 3 Level 2 Below No
(thousands) 7–8 4–6 and above Level 3 and above Level 2 and above level 2 qualifications
By age
19–24 4,079 2.0 17.6 19.6 34.1 53.7 21.8 75.5 16.7 7.8
25–29 3,360 8.5 29.5 38.1 19.6 57.7 19.3 76.9 15.5 7.6
30–34 3,277 10.4 28.7 39.1 18.4 57.5 18.9 76.4 15.7 7.9
35–39 3,775 8.6 25.0 33.6 16.0 49.6 20.6 70.1 20.9 9.0
40–44 3,936 7.6 25.1 32.6 16.3 48.9 20.9 69.9 21.2 9.0
45–49 3,562 7.3 23.5 30.8 17.6 48.4 20.3 68.8 19.1 12.2
50–54 3,107 7.4 22.8 30.2 16.8 47.0 19.4 66.4 17.3 16.3
55–64 4,505 6.5 19.9 26.4 17.9 44.2 19.2 63.5 16.4 20.1
1 Qualifications at level 7–8 include higher degrees, postgraduate level professional qualifications and NVQ level 5
Level 4–6 qualifications include foundation or first degrees, recognised qualification degree-level professional qualifications, NVQ level 4, teaching or nursing qualifications, HE diploma, HNC/HND or equivalent vocational qualification
Qualifications at level 3 include either two A-levels grade A–E, four AS levels graded A–E, an advanced GNVQ or NVQ level 3 or equivalent vocational qualification
Trade apprenticeships have been assigned to level 3 and level 2 in the ratio 50:50
Level 2 qualifications include either five GCSEs grade A*–C (or equivalent), an intermediate GNVQ, two AS levels, an NVQ level 2 or equivalent vocational qualification
Qualifications below level 2 include one or more GCSE grade G or equivalent (but less than five grades A*–C), BTEC general certificates, YT certificates, other RSA certificates, other City and Guilds certificates or NVQ level 1. Key Skills and Basic Skills qualification are also classified here Those qualifications that do not fit into the existing pre-code list are recorded as ‘Other’ qualifications, along with all foreign qualifications and any other professional qualifications. People with an ‘Other’ qualification as their only, and therefore highest, qualification level are assigned to level 3, level 2 and below level 2 in the ratio 10:35:55
Table 5
First-year students (excluding postgraduate research students) in the UK by selected academic year, age group and level of study, 2007/08
Academic Age group Number/ Number/
year (percentage) (percentage)
of students on of students on
postgraduate undergraduate
courses in UK courses in UK within within
age group age group
24 and under 52,704 366,343
(29.2%) (58.8%)
25–39 91,806 161,630
(50.9%) (26.0%)
40–49 28,436 55,984
(15.8%) (9.0%)
1998/99 50–54 5,422 15,193
(3.0%) (2.4%)
55–59 1,302 7,722
(0.7%) (1.2%)
60 and over 829 15,726
(0.5%) (2.5%)
Total 1998/99 180,499 622,598
24 and under 75,989 416,623
(34.4%) (58.3%)
25–39 103,966 175,996
(47.1%) (24.6%)
40–49 30,583 71,730
(13.8%) (10.0%)
2002/03 50–54 6,949 18,444
(3.1%) (2.6%)
55–59 2,515 12,362
(1.1%) (1.7%)
60 and over 877 19,939
(0.4%) (2.8%)
Total 2002/03 220,879 715,094
24 and under 92,854 470,235
(37.4%) (59.6%)
25–39 111,679 184,185
(44.9%) (23.3%)
40–49 31,617 81,350
(12.7%) (10.3%)
2007/08 50–54 7,684 20,164
(3.1%) (2.6%)
55–59 3,252 12,873
(1.3%) (1.6%)
60 and over 1,415 20,164
(0.6%) (2.6%)
Total 2007/08 248,501 789,271
[image:25.652.326.555.163.742.2]Source: HESA Student record 1998/99 to 2007/08 7.5 Tables 8-11 show what types of courses the
50-plus group and those aged 40-49 are taking, with information on the five most popular subject areas for first-year students. For full-time students who are 50-plus, the top two categories are in education and in subjects allied to
medicine, reflecting the importance of teaching and nursing. Otherwise, there is a broad steer towards studies in the arts, humanities and social sciences. For part-time students, the ‘combined’ category comes top, with students (for example, in continuing education) studying programmes across a range of subject
categories. The importance of language studies reflects personal interests and lifestyle changes associated, for example, with overseas travel among this group.13
7.6 Although the focus of this report is on those aged 50 and over, the importance of the age group immediately below is especially noteworthy. The number of first-year full-time students aged 40–49 in UK universities reached just over 17,000 in 2007/08, compared with nearly 13,000 in 1998/99. Numbers of first-year part-time
Table 6
First-year students (excluding postgraduate research students) on full-time and sandwich courses in the UK by selected academic year, age group and level of study, 2007/08
Academic Age group Number/ Number/
year (percentage) (percentage)
of students on of students on full-time and full-time and
sandwich sandwich
postgraduate undergraduate
courses in UK courses in UK
24 and under 43,108 325,353
(51.2%) (85.0%)
25–39 35,710 47,268
(42.4%) (12.4%)
40–49 4,547 8,204
(5.4%) (2.1%)
1998/99 50–54 613 1,055
(0.7%) (0.3%)
55–59 146 379
(0.2%) (0.1%)
60 and over 101 308
(0.1%) (0.1%)
Total 1998/99 84,225 382,567
24 and under 64,526 360,658
(53.8%) (85.5%)
25–39 48,837 48,555
(40.7%) (11.5%)
40–49 5,463 10,497
(4.6%) (2.5%)
2002/03 50–54 787 1,373
(0.7%) (0.3%)
55–59 271 543
(0.2%) (0.1%)
60 and over 112 372
(0.1%) (0.1%)
Total 2002/03 119,996 421,998
24 and under 78,191 396,852
(56.5%) (86.4%)
25–39 53,028 48,800
(38.3%) (10.6%)
40–49 5,786 11,159
(4.2%) (2.4%)
2007/08 50–54 929 1,573
(0.7%) (0.3%)
55–59 329 575
(0.2%) (0.1%)
60 and over 191 340
(0.1%) (0.1%)
Table 7
First-year students (excluding postgraduate research students) on part-time and other courses in the UK by selected academic year, age group and level of study, 2007/08
Academic Age group Number/ Number/