o
Q LU en σι en
New enterprises
m C EC ¡η
1997
54
1.Ρ . ζ
D a t a 1 9 9 5 - 1 9 9 7
* * E U R O P E A N
C O M M I S S I O N
eurostat
ΈίΔ
THEME 4
Our mission is to provide the
European Union
with a highquality statistical information service
EurOStat's Collections are adapted to the needs of all users. You will find them in each of the nine themes proposed by Eurostat.
¿3
gjj
m
1 General statistics 2 Economy and finance
3 Population and social conditions 4 Industry, trade and services
5 Agriculture and fisheries
Ä
6 External trade 5 L ~ 7 Transport
8 Environment and energy
9 Research and development
Graphs ■»: Tables Comments C o n t e n t
Press releases: Eurostat publishes around 100 press releases every year in connection with the release of new data. The press releases include the key figures on the EL), the Member States and their partners. They are provided free of charge. They are also available on the Internet as soon as they are published: http://europa.eu.int/eurostat.html
F o r m a t
Paper Html PDF
Statistics in focus: This collection is published regularly by Eurostat and provides uptodate summaries of the main results of statistical surveys, studies and analyses. It covers all themes and consists of about four to eight pages per issue. Eurostat issues around 150 Statistics in Focus per year. Available as single copies or on subscription.
Paper PDF
Key indicators: This collection provides the main indicators on a theme or subtheme in an easytocarry booklet of up to 100 pages. Available as single copies or on subscription.
Panorama of the European Union: This collection highlights the features and trends of a multisectoral theme or a sectoral subtheme. The publications consist of around 200 pages and include analysis as well as tables and graphs. Available as single copies or on subscription.
Ini»
Paper Htmli
Paper CDROMMethods and nomenclatures are intended for specialists who want to consult the methodologies and nomenclatures used for a theme, a subtheme or a sector. Available as single copies.
Paper CDROM
1 Detailed tables are intended for specialists. They present part, or all, of the statistical data compiled on a theme, subtheme or sector. Available as single copies or on subscription.
Paper CDROM
Studies and research summarise the results of European statistical studies and research and are intended for specialists. Available as single copies or on subscription.
Paper CDROM
Catalogues provide rapid access to concise information on Eurostat's products and services. They are free of charge and include the Mini guide, a selection of Eurostat products and services, and Statistical references, the quarterly newsletter on Eurostat's latest products and services.
2 O
Q LU Oí Oí
New enterprises
m C EC in 1997
Data 1995-1997
E U R O P E A N
C O M M I S S I O N
eurostat
Immediate access to harmonized statistical data
E u r o s t a t D a t a S h o p s :
A personalised data retrieval service
In order to provide the greatest possible number of people with access to high-quality statistical information, Eurostat has developed an extensive network of Data Shops (').
Data Shops provide a wide range of tailor-made services:
-A- immediate information searches undertaken by a team of experts in European statistics;
* rapid and personalised response that takes account of the specified search requirements and intended use;
* a choice of data carrier depending on the type of information required.
Information can be requested by phone, mail, fax or e-mail.
(') See list of Eurostat Data Shops at the end of the publication.
I n t e r n e t :
Essentials on Community statistical news
* Euro indicators: more than 100 indicators on the euro-zone; harmonized, comparable, and free of charge;
* About Eurostat: what it does and how it works;
* Products and databases: a detailed description of what Eurostat has to offer;
* Indicators on the European Union: convergence criteria; euro yield curve and further main indicators on the European Union at your disposal;
* Press releases: direct access to all Eurostat press releases.
For further information, visit us on the Internet at: h t t p : / / e u r O p a . e U . i n t / e u r O S t a t . h t m l
A great deal of additional information on the European Union is available on the Internet. It can be accessed through the Europa server (http://europa.eu.int).
Cataloguing data can be found at the end of this publication.
Luxembourg: Office for Official Publications of the European Communities, 1999
ISBN 92-828-8374-4
© European Communities, 1999
Printed in Luxembourg
STATISTICAL OFFICE OF THE EUROPEAN COMMUNITIES
L-2920 Luxembourg — Tel. (352) 43 01 -1 — Telex COMEUR LU 3423 e u r O S t a t Rue de la Loi 200, B-1049 Bruxelles — Tel. (32-2) 299 11 11
Eurostat is the Statistical Office of the European Communities. Its task is to provide the European Union with statistics at a European level, that allow comparisons to be made between countries and regions. Eurostat consolidates and harmonizes the data collected by the Member States.
To ensure that the vast quantity of accessible data is made widely available, and to help each user make proper use of the information, Eurostat has set up a publications and services programme.
This programme makes a clear distinction between general and specialist users and particular collections have been developed for these different groups. The collections Press
releases, Statistics in focus, Panorama of the European Union, Key indicators and
Catalogues ate aimed at general users. They give immediate key information through
analyses, tables, graphs and maps.
The collections Methods and nomenclatures, Detailed tables and Studies and research suit the needs of the specialist who is prepared to spend more time analysing and using very detailed information and tables.
All Eurostat products are disseminated through the Data Shop network or the sales agents of the Office for Official Publications of the European Communities. Data Shops are available in 12 of the 15 Member States as well as in Switzerland, Norway and the United States. They provide a wide range of services from simple database extracts to tailor-made investigations. The information is provided on paper and/or in electronic form via e-mail, on diskette or CD-ROM.
As part of the new programme Eurostat has developed its website. It includes a broad range of on-line information on Eurostat products and services, newsletters, catalogues, on-line publications as well as indicators on the euro-zone.
m
New Enterprises in Central European Countries in 1997eurostat
SUMMARY OF 1997 RESULTS
During 1997 approximately 554 000 new enterprises, excluding agricultural enterprises, were registered and were still active in September 1998 in eleven central European countries (CECs). The countries are: Albania, Bulgaria, the Czech Republic, Estonia, Hungary, Latvia, Lithuania, Poland, Romania, Slovakia and Slovenia. This compares with an estimate of 3 851 000 enterprises that were carrying out activities in the same eleven countries at the beginning of 1995. It corresponds to a creation rate of approximately 14 per cent during 1997. This is lower than the creation rates in 1995 and 1996, a pattern seen in all countries except Estonia. The 1996 creation rate was artificially high because of a change in the law in Poland; for the ten countries excluding Poland the creation rate in 1996 was 14 per cent, the same level as seen in 1997.
This is the overall picture from the third survey of newly created enterprises, which was carried out during September and October 1997 by the statistical offices of the eleven CECs with assistance from Eurostat and funding from the European Union's PHARE programme. A pilot survey was undertaken in the Former Yugoslav Republic of Macedonia as part of this survey.
This report examines the structure of these newly created enterprises in 1997 and compares this with information from previous surveys on enterprises which were newly created in 1995 and 1996, and all active enterprises in the business registers in each of the participating countries in January 1995.
PREVIOUS SURVEY RESULTS
This publication describes the results of the third survey of newly created enterprises (the third "B" survey). A previous survey of all existing businesses (the "A" survey) was followed up to provide longitudinal data at the same time as the second Β survey was run. Results of all these surveys have been published, and there are summary volumes from the first (A), second (B1) and third (B2) surveys, a summary volume of longitudinal data, and a detailed analysis (in electronic format only) of the first (A) survey. The publications are available from Eurostat Data Shops and inquiries can be made to
Arto Luhtio Eurostat D1 Bâtiment BECH
rue Alphonse Weicker, 5 L2721 Luxembourg
E-mail: [email protected] Telephone: (+352) 4301-34466
New Enterprises in Central European Countries in 1997
m
eurostat
TABLE OF CONTENTS
1. Main results for enterprises created in 1997 5
2. General comparison of new enterprises with those existing at January 1995 5
3. Main trends for individual countries 9
4. Methodology and coverage 12
Appendix A: Tables
Table 1 : Number of active enterprises, creation rate and GDP per capita 17
Table 2: Distribution of active enterprises by type of unit 17 Table 3: Average employment of active enterprises by type of unit 18
Table 4: Distribution of active enterprises by method of creation 18
Table 5: Distribution of active enterprises by size class 19 Table 6: Share of total employment by enterprise size class 19 Table 7: Share of total employment by type of employment 20 Table 8: Distribution of active enterprises by number of local units 21 Table 9: Distribution of active enterprises by principal place of activity 21
Table 10: Distribution of active enterprises by zone 22 Table 11 : Distribution of active enterprises by region 22 Table 12: Distribution of active enterprises by sector of activity 23
Table 13: Distribution of active enterprises by number of activities 24 Table 14: Share of total employment of enterprises with foreign capital participation 24
Table 15: Distribution of active enterprises according to perceived trading difficulty 25 Table 16: Distribution of active enterprises with perceived supply side difficulties
by type of difficulty 26 Table 17: Distribution of active enterprises with perceived demand difficulties
by type of difficulty 27 Table 18: Distribution of active enterprises by age of the founder/manager 28
Table 19: Distribution of active enterprises by sex of the founder/manager 28 Table 20: Distribution of active enterprises by educational background
of the founder/manager 29 Table 21 : Distribution of active enterprises by previous socio-professional
category of the founder/manager 30 Table 22: Percentage of active enterprises making investments 31
Table 23: Status of recorded units 31
New Enterprises in Central European Countries in 1997
m
eurostat
NEW ENTERPRISES IN CENTRAL
AND EASTERN EUROPE IN 1997
1. Main results for enterprises created in 1997
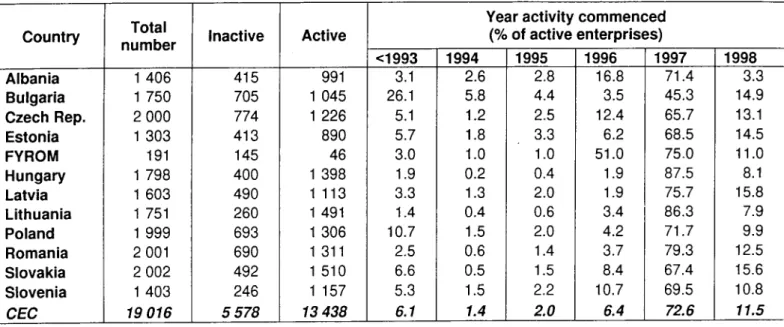
The total number of newly created enterprises in the twelve countries involved in this project is shown in Table 1 of Appendix A, and the creation rate is shown in Figure 1. The four surveys on which the estimates are based covered registrations of nonagricultural enterprises on the business registers of each country during the corresponding time periods. Public administration and private nonprofit enterprises were also excluded. A pilot survey in the Former Yugoslav Republic of Macedonia (FYROM) was included, and general results are given in tables 1 and 23, but the small sample size does not support the more detailed analysis in the other tables. Further details of the coverage of the surveys and the definition of the creation rate are given in section 4.
The rate of creation of new enterprises continues to differ between countries but has fallen in ten of the eleven CECs included in the survey between 1996 and 1997only Estonia shows an increase in the rate of creations. In theory as the economies develop, the creation rates should reduce, and there is some evidence that this is happening from these surveys.
However, 1997 was the beginning of a slowdown in economies worldwide, and it is difficult to say what has caused the general fall in creation rates. Poland shows a high creation rate in 1996 particularly, but also carried forward into 1997, due to a change in the law on registrations causing many existing but unregistered enterprises to register. Excluding the figures for Poland, the average creation rate for the remaining ten CECs is 11 per cent in 1997, down from 14 per cent in 1996, and considerably lower than a revised 19 per cent (including Poland) in 1995.
GDP per capita for each of the twelve countries covered in this study is also shown in Table 1.
2. General comparison of new enterprises with those already existing
In comparing the results for enterprises which were newly created in 1997 (survey B3) with those for enterprises existing at 1 January 1995 (survey A) and those created in 1995 (survey B1) and 1996 (survey B2), it should be noted that the surveys were carried out at one year intervals, so any differences in the corresponding estimates are most likely due to real differences in the types of new enterprises being created in each country. Other possible reasons for general differences are described in section 4, and some specific changes to the registration laws or business registers in some of the countries are detailed in the country summaries in section 3.
F i g u r e 1 : E n t e r p r i s e c r e a t i o n rate (%)
A l b a n i a
B u l g a r i a
C z e c h R e p .
E s t o n i a
H u n g a r y
Latvia
L i t h u a n i a
P o l a n d
R o m a n i a
S l o v a k i a
S l o v e n i a
C E C s
I τ
j
I
J I
F =
I iI
A
~\ I
J
ï " " ■
I
μ
-Ι —
0—
5 10
j
15
1
1
20
1
ZD
25
1
Π Created in 1 995
■ Created in 1 996 ^ C r e a t e d in 1997
Wh
eurostat
New Enterprises in Central European Countries in 1997
A framework for comparing results
In developed countries a balance usually exists between newly created enterprises and those ceasing business activity. New enterprises will typically be smaller in size than those that have existed for some time, and will generally have simpler structures. For the transitional countries covered by this study there is likely to be a mixture of both completely new enterprises and privatisations of older enterprises. Furthermore it can be expected that the rate of creation of new enterprises is significantly higher in transitional countries than in developed countries. However, most other differences between the characteristics of new and existing enterprises will depend on the particular circumstances within each country.
correspond to two types of creations small natural person enterprises of a similar size to existing sole proprietorships, and large legal entities mostly from the privatisation of existing enterprises.The anticipated reduction in size of large legal entities, expected because the largest privatisations were mostly completed before 1996, has not been demonstrated. However, the proportion of businesses formed from privatisation continues to decline (Table 4), and was lower in all countries except Slovenia.
The proportion of enterprises created from privatisations has fallen noticeably over all countries, with only Slovenia showing a slight increase. Albania and Latvia still maintain the highest rates of privatisation in this project, but they are now the only two countries with a rate over 5%.
Legal structure and enterprise size
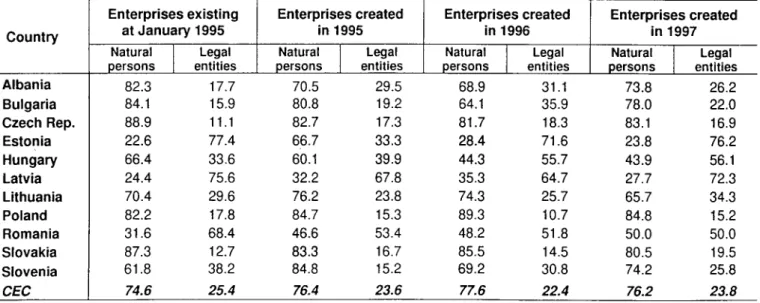
The overall proportion of enterprises in CECs which are natural persons has remained about the same in the three surveys, with Estonia, Hungary, Latvia and Romania having the lowest proportions (Figure 2). The smallest proportion of natural person enterprises is apparently decreasing from 32% for enterprises created in 1995 to 28% in 1996 and 23% in 1997, but the largest proportion is more stable at 85%.
The size of these natural person enterprises remains small, In fact smaller in 1997 than in previous surveys (Table 3). The size of new legal entities created in 1997 is similar to the size of 1995 and 1996 creations overall, although this masks some large changes in individual countries. New creations in 19951997
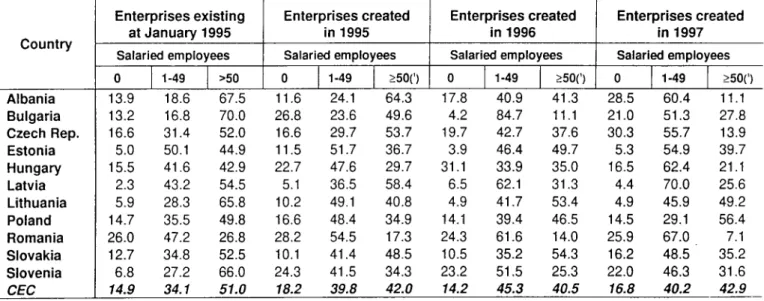
The distribution of enterprises by size and their share of total employment stayed broadly the same from 1995 to 1997 (Tables 5 and 6), with the exception of Bulgaria, Estonia and Lithuania. In Bulgaria this is the result of changing to a new register and doesn't reflect a true change (see section 3). The distribution in Estonia and Lithuania is different for enterprises created in 1995, but the 1996 and 1997 creations show signs of settling into a regular pattern; in Estonia this pattern also corresponds with the distribution of enterprises existing on 1 January 1995.
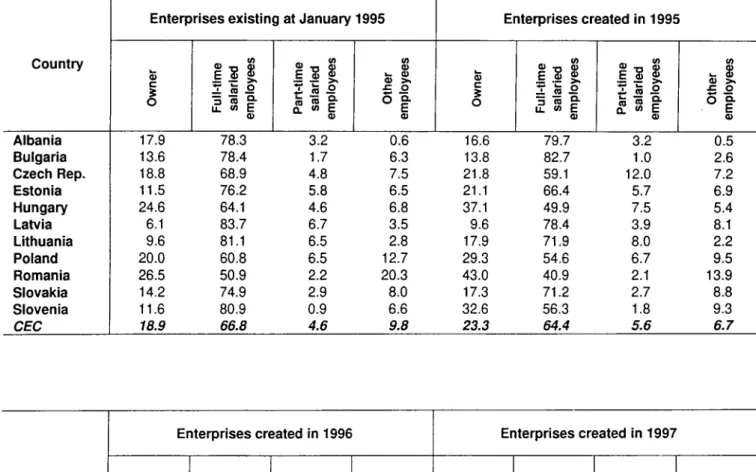
The share of total employment made up by fulltime salaried employees continues to fall slightly overall, while the share of total employment made up by the owner is increasing, especially in Albania and the Czech Republic.
A I b a n i a
Β u I g a r i a
C z e c h R e p
E sto n ia
Η u n g a r y
L a t v i a
L i th u a n ia
P o l a n d
R o m a n ia
S l o v a k i a
S lo ve n ia
C E C
F i g u r e 2 : N a t u r a l p e r s o n s (%)
s&L
S 3 S K 2 Ì .
□ c r e a t e d 1 9 9 7 ■ c r e a t e d 1 9 9 6 ■ c r e a t e d 1 9 9 5 LJ e x i s t i n g 19 9 5
New Enterprises in Central European Countries in 1997
ΞΤΆ
eurostat
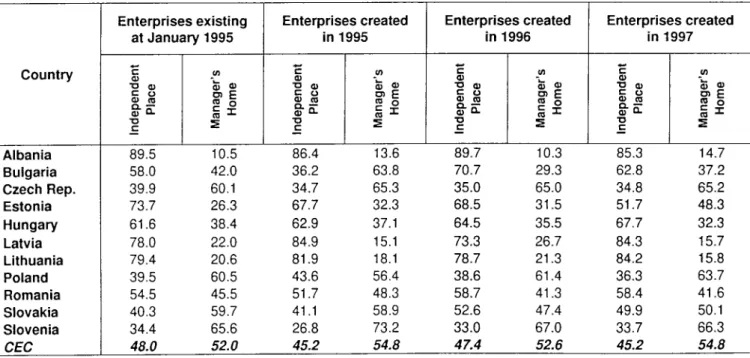
Location
Nearly all new enterprises in all countries have only one local unit (Table 8), except in Bulgaria where the number of multi-site enterprises was increased for businesses created in 1996 by a new registration scheme. The overall proportion of new enterprises where the principal place of activity is the manager's home remains at slightly over 50% (Table 9).
The distributions of enterprises between urban and rural areas (Table 10), and between the capital and other regions (Table 11) continue to be consistent across all creations. The relationship between proportion of creations in the capital region and the countries surface area is shown in Figure 3. The change in the urban/rural division in Albania found for enterprises created in 1995 and 1996 is even more pronounced for enterprises created in 1997. The proportion of new enterprises in 1997 in urban areas ranged from 65 per cent in Lithuania and Slovenia to 88 per cent in Bulgaria, and the proportion of new enterprises in 1996 in the capital region ranged from 8 per cent in Poland to more than 50 per cent in Albania and Latvia.
Sector of Activity
The distribution of new active enterprises in 1997 across the six main sectors (manufacturing; construction; distributive trade; transport; hotels, restaurants and catering; and other services) is
approximately the same as the distribution of enterprises existing at the beginning of 1995 and enterprises created in 1995 and 1996, although there are a few differences (Table 12). The highest proportion of creations continues to be within the distributive trade sector (more than a third of all creations), with proportions ranging from 26 per cent to 56 per cent across the eleven countries. The second highest proportion of creations is in the other services sector.
It can also be seen that most new enterprises have a single activity (Table 13), the higher proportion found in businesses created in 1996 being continued in 1997 creations. Most countries show a similar level to 1996, but there has been a noticeable increase in multiple-activity creations in Hungary, returning to the levels found in the survey of 1995 creations.
Foreign capital participation
The share of employment in new enterprises with foreign capital participation is roughly the same over all CECs, but this is formed from a range of movements in individual countries (Table 14). The three countries which showed a large increase in the share of employment among new enterprises assisted by foreign capital in 1996, Albania, the Czech republic and Latvia, have all seen large falls in the proportion in enterprises created in 1997, back to less than 20%. However, these results should be treated with caution because of the high sampling error associated with
If
CO
"o_
cc υ
co
reatio
n
gio
n
O CD
5
Φ
-,—»
ω o
λ
-ο o_
601
40-
20-■ Albania
■ Latvia ■ Estonia
Lithuania
■ m Hungary
■ Slovenia
Bulgaria ■ ■ Slovakia
■ Czech Rep
100000
Surface
Figure 3:
Relationship between per cent new creations in the capital region and surface area in km2 for CECs.
■ Romania
Poland ■
Wh
eurostat New Enterprises in Central European Countries in 1997
these data for example the high employment in enterprises created in 1997 with foreign capital participation in Slovenia was due mostly to the inclusion of one large business in the sample (see also section 4).
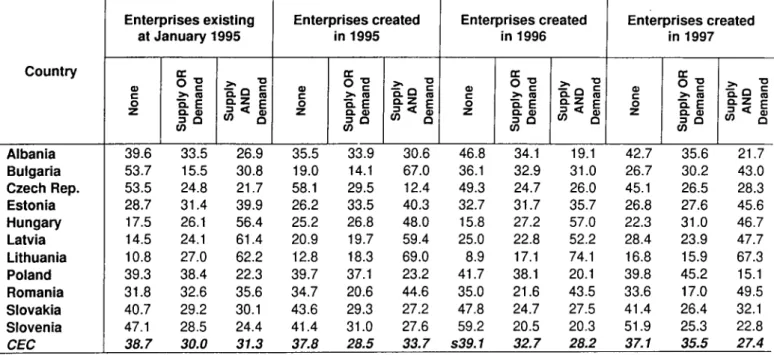
Supply and demand
The proportion of new enterprises experiencing supply and/or demand side difficulties is similar to the proportion in 1996; the largest changes are in Bulgaria where more new enterprises are experiencing difficulties, and Lithuania, where fewer businesses are reporting difficulties (Table 15). There is a wide range of proportions of new enterprises reporting trading difficulties, from less than 50% in Slovenia to more than 80% in Lithuania. Of those enterprises that had experienced supply side difficulties, the most frequent reason continues to be a lack of funds (Table 16). The most frequent reasons for the perceived demand side difficulty were too much competition and a shortage of customers with sufficient funds to buy goods and services. The competition factor has become important in successive surveys (Table 17).
Characteristics of the founder/manager
There is a noticeable increase in the proportion of founder/managers of enterprises created in 1997 under the age of 30. Such people are in charge of almost a third of all new enterprises in 1997, which is radically different from the profile for businesses existing in 1995, where they formed less than an eighth (Table 18). The proportion of business with a founder/manager over 50 is consequently smaller for business created in 1997, with the 30-49 age groups little changed. In all countries the founder/ manager is under 40 years old in at least half of the enterprises created in both 1996 and 1997.
The countries which showed a significantly greater proportion of female founder/ managers for enterprises created in 1995 and 1996 than for enterprises existing at January 1995, namely Bulgaria, the Czech Republic, Estonia, Latvia, Romania, Slovakia and Slovenia, show a continuation of this pattern for enterprises created in 1997, although with some evidence of a decrease in the proportion of female founder/managers in Slovakia (Table 19). In contrast, over half of new enterprises in Estonia in 1997 had female founder/managers. Over all the countries in this survey, the proportion of female founder/ managers for enterprises created in 1997 is about the same as for those for enterprises created in 1995 and 1996.
All the countries show a similar pattern of distribution
of enterprises according to the educational background of the founder/ manager over all three surveys (Table 20). The apparent swing from primary education to basic vocational education for Albania is an artefact of the survey procedure. Comparison by socio-professional category of the founder/manager of new and established enterprises is not possible because the response categories differed in survey A (Table 21). However, the distribution of new enterprises created in 1995, 1996 and 1997 is approximately the same except in Estonia (where the proportion of founder/managers who were previously senior managers was high for businesses created in 1996) and Bulgaria (where the proportion of founder/managers who were previously manual workers is much higher for business created in 1997 than in previous years). In all countries except Lithuania, the founder/manager is most likely to have been in the "manual workers and others" category before starting a new enterprise.
Investment
Comparing enterprises created in 1997 with those created in 1996 and 1995, the proportion making investments (Table 22) has stayed about the same overall. Albania, Bulgaria, Romania and Slovakia, which all showed changes in enterprises created in 1996, have returned to a middle position for enterprises created in 1997. All countries except Albania and Bulgaria had at least 20 per cent of enterprises making investments in 1997, and in Estonia, Hungary and Slovenia the proportion was more than 40 per cent. Note that there are no estimates for the active enterprises existing at 1 January 1995 since a different question on invest-ment was asked in survey A.
State of activity
New Enterprises in Central European Countries in 1997
Wh
eurostat
3. Main trends for individual countries
In this section a brief comparison of enterprises created in 1997 with enterprises created in 1995 and 1996 and enterprises existing at the beginning of 1995 is made for each of the eleven countries. One indicator of the stage of transition is the rate of creation of new enterprises given in Table 1. These figures show a very similar picture in 1996 to that seen in 1995 (except for Poland), with Hungary and Slovenia showing the most evidence of transition to a market economy and Bulgaria the least.
Albania
7996 comments
The number of creations from privatisations has fallen considerably between 1995 and 1996 (Table 4), but the share of employment of enterprises with foreign capital participation has risen again (Table 14). A higher proportion of employment Is also accounted for by the owners of newly created enterprises than in previous surveys (Table 7). There has been a larger proportion of creations in the capital region than in previous surveys (Table 11).
1997 comments
The Albanian economy has been dominated by the civil war in 1997, with the result that the creation rate has plummeted (Table 1). Most businesses were created in the capital region and urban regions (Tables 11 and 10), and the proportion in the capital region shows a notable reversal from the information collected on enterprises created in 1996. For similar reasons the proportion of employment of enterprises with foreign capital participation is low (Table 14). In Table 20, the switch between primary and basic vocational qualifications in the educational background of the founder/ manager is an artefact of the survey process.
Bulgaria
In Bulgaria a new business register has been used for surveys B1, B2 and B3. In particular in B3 this has produced an unusual sample distribution of year of commencement of activity (Table A) caused by the registration of dormant enterprises which had not re-registered at the time the new register was set up. An unusual sample distribution was also obtained in survey B2, so comparisons between years of Bulgarian data should be made with caution.
1996 comments
There was a large increase in the proportion of newly created enterprises which were planning to invest in the following year (Table 22), and this was consistent
with the fall in the proportion of businesses experiencing trading difficulties (Table 15). The investment figure is now much more like the figures for other CECs than was the case for enterprises created in 1995. Also a much higher proportion of the enterprises created in 1996 seemed to operate from their own premises (Table 9).
1997 comments
The sample for 1997 included information from three large privatised businesses which have been zero-weighted to avoid distortion of the data presented in the tables. In conjunction with the significant proportion of new registrations being from re-registrations of existing businesses on the new system (more than a quarter of new registrations were of businesses existing in 1993, table A), the data for 1997 should be treated with caution.
The share of employment in enterprises with foreign capital participation is much higher for enterprises created in 1997 than previously (Table 14), but the proportion of newly created enterprises which are investing in the following year has fallen below 20% (Table 22). This may be linked to the increase in newly created businesses experiencing both supply and
demand side difficulties, which have risen by over 10% compared with 1996 creations.
Bulgaria is one of the countries showing a large increase in the proportion of younger founder/ managers, with 30% under the age of 30, compared with < 20% in previous surveys.
Czech Republic
1996 comments
The distribution of existing and new enterprises within the Czech republic has been consistent over all three of the surveys. The only notable change for enterprises created in 1996 is that there is a higher share of employment from enterprises where there is foreign capital participation (Table 14). The Czech republic also has a very high proportion of younger founder/managers for enterprises created in 1996, with over 40% below the age of 30 (Table 18).
1997 comments
Wh
eurostat New Enterprises in Central European Countries in 1997
More enterprises are experiencing difficulties because their customers pay late or not at all; this now affects half of all new enterprises.
Estonia
Several tables show that creations in Estonia in 1996 and 1997 are more similar to the distribution of existing enterprises than were the creations in 1995 (Tables 2, 5, 6, 7 and 13). The data on creations in 1995 were affected by a delay of several years in the registration of a significant proportion of small enterprises.
1996 comments
There was a large drop in the share of total employment of enterprises with foreign capital participation (Table 14), from the highest value of any of the eleven countries for 1995 creations to one of the lowest for 1996 creations. The proportion of founder/ managers aged less than 40 also rose to 60% (Table 18).
1997 comments
Estonia is the only country involved in this project to show an increased creation rate in 1997 over 1996 (Table 1). The characteristics of the new creations have changed somewhat, with almost half now being based in the manager's home (Table 9), and over half of all founder/managers being female (Table 19) - the highest rate of female founder/managers of newly created enterprises among the CECs. The age of the founder/manager is also different from other CECs with the smallest proportion under 30 (17%), and the largest proportion, more than 20%, aged 50 or over (Table 18).
Former Yugoslav Republic of Macedonia
The Former Yugoslav Republic of Macedonia (FYROM) was included in the project for the first time in 1997, when a small pilot survey was run to test the methods and obtain some general information. Results on active, dormant and dead enterprises are included in Table 23, but these are based on a very small sample compared with other countries.
Hungary
1996 comments
The estimates from the B2 survey showed a similar distribution to previous surveys. Enterprises created in 1996 in Hungary were on average smaller than in all the other countries (Tables 3, 5 and 6) with almost 80 per cent having no salaried employees. Hungary continues to have the highest proportion of enterprises
which are planning to make investments in the year following their creation (Table 22).
1997 comments
The series of estimates in all tables is stable for Hungary, and this is carried forward into creations in 1997. For the third successive survey, Hungary has the highest proportion of enterprises planning to make investments in the year following their creation. The only notable shift is in the proportion of enterprises with no salaried employees, which has fallen to just over half (Table 5) and hence the share of total employment of these enterprises (Table 6). The proportion of newly created enterprises with multiple activities has doubled from 1996 to 1997 (Table 13), and is now the highest among the eleven countries.
Latvia
1996 comments
The distribution of enterprises created in 1996 in Latvia was similar to the distribution of enterprises created in 1995 in most cases. There was a small decrease in the proportion of enterprises with multiple activities (Table 13), and owners working in their own business accounted for a higher proportion of employment (Table 7). The average size of legal entities approximately halved (Table 3) and the share of employment in enterprises with >50 employees was also considerably smaller (Table 6). The share of employment of enterprises with foreign capital participation increased (Table 14).
1997 comments
The series of estimates in all tables is stable for Latvia, with creations in 1997 little different from creations in 1996. There has been a small fall in the share of total employment of enterprises with foreign capital participation (Table 14). Latvia also has the highest sample proportion among CECs of enterprises created in 1998 (Table A), indicating enterprises registering in advance.
Lithuania
In several tables the data for businesses created in 1996 show an unusual pattern, with 1995 and 1997 data being more similar; the 1996 data should be treated with caution.
1996 comments
The proportion of enterprises registering in 1996 which were found to be definitely dead was unusually high (Table 23) and this may have been affected by difficulties in coding businesses not contacted during the survey. Other notable changes included a slightly lower proportion of new enterprises in the distributive
New Enterprises in Central European Countries in 1997
Wh
eurostat
trades in 1996 and a correspondingly higher proportion in transport (Table 12), and a slightly higher proportion of enterprises experiencing both supply and demand side difficulties (Table 15) than was found for new enterprises in 1995.
1997 comments
There has been a large change in the proportion of enterprises registering in 1997 found to be active, at 84% the highest proportion in the CECs, and very different from the figure for 1996 creations which was the lowest in the CECs. In line with this, the proportion of businesses found to be definitely dead has fallen dramatically (Table 23), and there is a small decrease in the proportion of enterprises experiencing trading difficulties from lack of funds (Table 16), the biggest cause of such difficulties.
Poland
In Poland a new Law on Official Statistics was introduced in 1995, which resulted in an artificial increase in the number of newly registered businesses.
1996 comments
Changes in the regulations on registration had the effect of increasing the number of new registrations of small enterprises in 1996. This did not seem to affect the results of the survey, which show a consistent distribution of new enterprises in 1995 and 1996.
1997 comments
The number of new registrations continues to be inflated by the change in the registration law, though this is less pronounced than in 1996. This is shown in Table A where the sample distribution of enterprises contains many enterprises which were active before 1994 but which only registered in time for the B3 survey. This has contributed to Poland maintaining the highest creation rate of the CECs (Table 1). The characteristics of enterprises created in 1997 are consistent with earlier surveys. There is a slight reduction in the proportion of businesses experiencing both supply and demand side difficulties (Table 15), but the proportion experiencing some difficulty is largely unchanged.
Romania
1996 comments
For enterprises created in 1996, Romania had the highest proportion of employment, 40 per cent, made up of owners working in the business (Table 7). This was similar to the results for enterprises created in 1995. The share of employment in enterprises with foreign capital participation has risen for enterprises
created in 1996, but remains one of the lowest values of the eleven countries (Table 14).
1997 comments
The patterns seen in 1996 are carried on into 1997. There has been a small fall in the proportion of employment in enterprises with foreign capital participation (Table 14). Romania has the lowest level of enterprises created by privatisation of the eleven CECs (Table 4).
Slovakia
1996 comments
There was an increase in the proportion of founder/managers under the age of 40 for enterprises created in 1996 to more than 60 per cent (Table 18). A higher proportion of new enterprises in 1996 than in 1995 is also using their own premises to trade (Table 9).
1997 comments
The proportion of founder/managers under the age of 40 continues to increase and is now over 70 per cent (Table 18). The proportion of employment in newly created enterprises made up by the owner has increased to almost one in four, at the expense of salaried employees (Table 7). The proportion of employment in newly created enterprises with foreign capital participation has also risen slightly (Table 14).
Slovenia
1996 comments
The data from the B2 survey (enterprises created in 1996) contained a high proportion of missing values, and hence the results for Slovenia are likely to be more variable than for the other countries. The proportion of enterprises experiencing supply and/or demand side difficulties has decreased for enterprises created in 1996 (Table 15) with 59 per cent of enterprises reporting that they have no difficulties. The share of total employment accounted for by enterprises with foreign capital participation has also risen considerably for new enterprises in 1996 (Table 14).
1997 comments
Note that a higher proportion of employment in large enterprise creations, as indicated by Table 6, may influence the tables which have an employment basis (see also section 4). Slovenia is the only one of the eleven countries to show a noticeable fall in the proportion of employment made up by the owners of new enterprises (Table 7). Trading conditions in Slovenia seem relatively good; it is the only country where more than half of businesses are not experiencing trading difficulties (Table 15).
Wh
eurostat New Enterprises in Central European Countries in 1997
4. Methodology and coverage
These two projects have provided the unique opportunity to develop an extensive set of enterprise statistics with highly consistent definitions, which allows easy and meaningful comparisons both within and across the twelve CECs. In order to interpret these comparisons correctly it is important to have a clear understanding of the coverage and definitions used in the surveys. As more surveys are run, more information on the pattern of business activity in the CECs is built up, but some of the changes are the result of variability in the surveys. A further survey (B4) is being undertaken to look at businesses created in 1998, and a follow-up of previously surveyed businesses was undertaken alongside the B3 survey reported here, to provide longitudinal information.
The ¡deal situation would be to produce accurate estimates of the characteristics of both existing and newly created enterprises in all eleven countries. Without considerable effort in modelling or without waiting a long time for all new enterprises to be registered it would be impossible to do this, as the actual date of commencement of activity of the enterprise may precede its registration date. However, it is possible to produce estimates for units that are registered on the business registers of each country. Hence, survey A consisted of a sample selected from all non-agricultural enterprises that appeared on each country's business register in January 1995, with the exclusion of public administration and private non-profit making enterprises. Most statistics for this group of units, other than those in Table 23, refer to those enterprises that were active in September 1995 (when survey A was carried out). Survey B1 consists of a sample selected from all units registered in 1995 plus some additional enterprises registered before 1995, but which were not included in survey A due to timing difficulties. The state of activity for these enterprises was determined in September 1996. Survey B2 similarly consists of a sample selected from all units registered in 1996 plus some additional enterprises registered before 1996 but which were not included in survey B1 or A. The state of activity of the enterprises in survey B2 was determined in September 1997. The current survey (B3) followed the same pattern, a sample of all enterprises registered in 1997 with some additional unsurveyed earlier registrations, with survey activity commencing in September 1998.
To gain some idea of the time lag between creation and registration, Table A below shows the sample distribution for survey B3 by the year activity commenced (for active units only). As can be seen, in some countries there is a considerable time lag between creation and registration. Provided registration procedures have not changed significantly and that creation rates are relatively static from one
year to the next, the composition of both sets of enterprises should be approximately the same. In this case, estimates produced from registered units would be about the same as estimates produced for active units in the corresponding time period. Actually, it is possible to make the weaker assumption that creation rates do not change in a differential manner across the population.
It should be noted that the results in Tables 2-23 are derived from the businesses included in the surveys only. That is, there is no attempt to adjust these results using information from later surveys about businesses with delayed registrations. The data in Table 1, however, have been updated to take account of this information. So Table 1 gives our "current best estimate" of the numbers of creations, while Tables 2-23 contain information derived from a snapshot of new enterprise registrations in the given year.
The creation rate in Table 1 is calculated as the estimated number of enterprises added to the business register in 1995 (for survey B1) and in 1996 (for B2), divided by the best estimate of the true number of active enterprises on 1 January 1995. This estimate of the enterprises active on 1 January 1995 has been revised in this publication to include additional enterprises identified from the B3 survey. Note that the base from which creation rates are calculated is the same (1 January 1995) for creation rates in 1995, 1996 and 1997, since no survey information (on how many enterprises registered before 1995 ceased activity during 1995) is available to determine the number of enterprises active on the 1 January 1996. This also means that a complete picture of enterprises active in 1996 cannot be constructed from the tables in Appendix A.
In most countries, there was continuity of registration procedures over the surveys. The three notable exceptions to this are in Bulgaria where a significantly improved new business register was used to provide business address information in survey B1 and as the basis for the whole surveys for B2 and B3, in Estonia where there was a delay of several years in the registration of a significant proportion of small enterprises which affected survey B1 and in Poland where a new Law on Official Statistics came into force. As mentioned in section 3, indications are that this has not affected the comparability of the Bulgarian estimates. However, the comparability of some Estonian estimates may have been affected. The effect on the Polish data is mainly to reduce the proportion of dead units registered.
Besides the possibility of changing registration procedures affecting the comparison of the results from the three surveys, changes in survey methodology can also have some effect. However, every effort has been exercised to maintain identical
New Enterprises in Central European Countries in 1997
Wh
eurostat
survey methodologies in the three surveys and it is most unlikely that this has been the cause of differences between estimates.
Finally, in comparing the results it should be noted that since estimates are based on a sample rather than a complete census of all enterprises, small differences of only a few percentage points may well be due to the particular sample drawn and may not be a real under-lying difference. In describing results in sections 2 and 3 it has been assumed that small differences are not
statistically significant. The sampling is not controlled for business size, and so some adjustment for large outliers has been necessary; in some cases larger businesses have been identified as resulting from changes in the registration processes, in which case their weight has been set to 0 (they have been excluded); in other cases their weight has been set to 1 (that is, they have been made self-representing). This only has a major effect in the tables based on employment (Tables 3, 6, 7 and 14), the information in which should be treated with caution.
Table A: Sample distribution for survey B2 of enterprises by year of commencement of activity
Country
Albania Bulgaria Czech Rep. Estonia FYROM Hungary Latvia Lithuania Poland Romania Slovakia Slovenia
CEC
Total number
1 406 1 750 2 000 1 303 191 1 798 1 603 1 751 1 999 2 001 2 002 1 403
19 016
Inactive
415 705 774 413 145 400 490 260 693 690 492 246
5 578
Active
991 1 045 1 226 890 46 1 398 1 113 1 491 1 306 1 311 1 510 1 157
13 438
<1993 3.1 26.1 5.1 5.7 3.0 1.9 3.3 1.4 10.7 2.5 6.6 5.3
6.1
Year activity commenced (% of active enterprises) 1994
2.6 5.8 1.2 1.8 1.0 0.2 1.3 0.4 1.5 0.6 0.5 1.5
1.4
1995 2.8 4.4 2.5 3.3 1.0 0.4 2.0 0.6 2.0 1.4 1.5 2.2
2.0
1996 16.8
3.5 12.4 6.2 51.0 1.9 1.9 3.4 4.2 3.7 8.4 10.7
6.4
1997 71.4 45.3 65.7 68.5 75.0 87.5 75.7 86.3 71.7 79.3 67.4 69.5
72.6
1998 3.3 14.9 13.1 14.5 11.0 8.1 15.8 7.9 9.9 12.5 15.6 10.8
11.5
New Enterprises in Central European Countries in 1997
Wh
eurostatAPPENDIX A
Tables
New Enterprises in Central European Countries in 1997
Wh
eurostatGeneral notes
3.
The data in all tables except Table 1 for businesses existing at January 1 1995, created in 1995, or created in 1996 do not include any adjustment for late registrations (that is, they use information from the relevant survey only); updated data including information obtained about late registrations from subsequent surveys are included in Table 1.
It is not possible to get a picture of all enterprises existing in 1996 or in 1997 from the tables; adding the columns overcounts by ignoring businesses which have ceased trading after 1 January 1995.
The data for Bulgaria are distorted by a new register introduced before survey B1. See page 9 for more details.
Table 1 : Number of active enterprises, creation rate and GDP per capita
Country Albania Bulgaria Czech Rep. Estonia Hungary Latvia Lithuania Poland Romania Slovakia Slovenia CEC Enterprises existing at January 1995 39 535 332 689 707 968 29 381 562 311
27 335 67 764
1 400 717 387 840 226 227 69 500
3 851 267
Enterprises created in 1995 Number 9 476 98 987 148 084 7 750 74 878 6 499 15415 267 907 68 772 36 779 11 784 746 331 Creation rate (') 24.0 29.8 20.9 26.4 13.3 23.8 22.7 19.1 17.7 16.3 17.0 19.4 Enterprises created in 1996 Number 6 160 72 847 95 640 4 484 63 093 5 621 11 802 393 336 51 290 36 180 7015 747 468 Creation rate (') 15.6 21.9 13.5 15.3 11.2 20.6 17.4 28.1 13.2 16.0 10.1 19.4 Enterprises created in 1997 Number
1 727 35 544 69 160
4 904 50 524
4 937 11 692 289 333 48 631
31 816
5 952
554 220 Creation rate (') 4.4 10.7 9.8 16.7 9.0 18.1 17.3 20.7 12.5 14.1 8.6 14.4 GDP per capita in 1997 (2)
600
1 100
4 500
2 800
4 000
2 000
2 300
3 100
1 400
3 200
8 100
(') see section 4 for definition of creation rate
C) the latest available figure for FYROM Is 1 600 in 1996
Source: Eurostat, CEC
Table 2 : Distribution of active enterprises by type of unit (%)
Country Albania Bulgaria Czech Rep. Estonia Hungary Latvia Lithuania Poland Romania Slovakia Slovenia CEC Enterprises existing at January 1995 Natural persons 82.3 84.1 88.9 22.6 66.4 24.4 70.4 82.2 31.6 87.3 61.8 74.6 Legal entities 17.7 15.9 11.1 77.4 33.6 75.6 29.6 17.8 68.4 12.7 38.2 25.4 Enterprises created in 1995 Natural persons 70.5 80.8 82.7 66.7 60.1 32.2 76.2 84.7 46.6 83.3 84.8 76.4 Legal entities 29.5 19.2 17.3 33.3 39.9 67.8 23.8 15.3 53.4 16.7 15.2 23.6 Enterprises created in 1996 Natural persons 68.9 64.1 81.7 28.4 44.3 35.3 74.3 89.3 48.2 85.5 69.2 77.6 Legal entities 31.1 35.9 18.3 71.6 55.7 64.7 25.7 10.7 51.8 14.5 30.8 22.4 Enterprises created in 1997 Natural persons 73.8 78.0 83.1 23.8 43.9 27.7 65.7 84.8 50.0 80.5 74.2 76.2 Legal entities 26.2 22.0 16.9 76.2 56.1 72.3 34.3 15.2 50.0 19.5 25.8 23.8
Source: Eurostat, CEC.
Wh
eurostat
New Enterprises in Central European Countries in 1997
Table 3 : Average employment of active enterprises by type of unit
Country Albania Bulgaria Czech Rep. Estonia Hungary Latvia Lithuania Poland Romania Slovakia Slovenia CEC Enterprises existing at January 1995
U) — V) ¡O c 3 °
B <n
a
s
Z Q . <
40.2 1.4 7.0 56.9 2.1 9.7 40.2 2.8 6.8 16.0 6.1 13.9 13.6 1.9 6.0 19.8 4.0 16.0 39.6 3.1 14.2 30.4 3.0 7.5 7.4 1.4 5.6 39.5 3.0 7.4 23.3 2.5 11.2 21.5 2.6 7.4
Enterprises created
_ <Λ «1 «
II
0) 24.5 47.7 11.9 13.0 6.0 19.9 18.3 17.6 4.9 26.4 9.7 15.8 in 1995— <n ra c
3 S
ζ fc 1.5 1.8 4.0 2.5 1.5 2.9 2.2 2.3 1.8 2.3 2.0 2.5 < 8.3 10.6 5.4 6.0 3.3 14.4 6.0 4.7 3.5 6.3 3.2 5.6 Enterprises created
_ «0
Ii
0) 11.5 7.4 15.4 11.7 3.1 10.0 7.1 28.9 5.2 32.1 6.5 13.3 in 1996— CO
ra c 3 °
B <n
ζ *
z a. 1.5 3.9 2.0 2.5 1.1 2.5 9.0 2.9 1.6 2.6 1.6 2.8 < 4.6 5.2 4.5 9.1 2.2 7.3 8.5 5.7 3.5 6.9 3.1 5.2
Enterprises created
Vt
II
O) 7.3 12.2 9.0 9.5 6.5 7.8 19.5 27.4 4.9 15.4 7.9 14.5 in 1997— U) ra c 3 °
B m
ζ *
z o. 1.5 2.1 1.7 1.8 1.4 2.7 2.5 1.8 1.7 2.1 1.8 1.8 < 3.0 4.3 2.9 7.7 4.2 6.4 8.3 5.7 3.3 4.7 3.4 4.8
Source: Eurostat, CEC
Table 4 : Distribution of active enterprises by method of creation (%)
Country Albania Bulgaria Czech Rep. Estonia Hungary Latvia Lithuania Poland Romania Slovakia Slovenia CEC
Enterprises existing at January 1995
c o υ tu 3 Η
ο α. ο α>
05 is
tn ra
I s.
■- oα ö -o
CU x: O
68.4 26.7 4.9 96.0 0.2 3.8 86.1 4.6 9.3 81.9 5.1 13.0 84.5 2.2 13.3 83.2 7.4 9.4 75.4 5.5 19.1 88.6 3.2 8.2 95.8 1.1 3.1 92.6 3.6 3.8 75.7 2.1 22.2
88.3 3.2 8.5
Enterprises created
e o 1— υ 3 1-72.2 99.1 87.3 79.7 88.1 76.4 88.7 87.8 97.1 83.7 82.2 89.6 in 1995
O Q .
o cu <n ra
I 3.
— o α. o υ 21.8 0.6 1.8 3.2 2.5 12.4 5.7 2.9 1.8 8.1 5.7 2.9 SZ O 6.1 0.3 10.8 17.1 9.4 11.2 5.6 9.3 1.1 8.2 12.1 7.5Enterprises created
c o υ 3 h-88.7 92.1 87.4 87.0 77.8 83.9 92.0 86.0 97.5 90.2 88.9 87.2 in 1996
o Έ. c «°
o c
¡η ra
1 s.
~ o Q. O υ 7.7 4.6 2.4 4.1 6.0 6.8 3.7 2.3 0.7 5.5 4.0 3.0 o c O 3.6 3.3 10.1 8.9 16.2 9.3 4.3 11.7 1.8 4.3 7.1 9.8Enterprises created
c g o Q) 3 Η 90.8 96.9 94.6 88.7 86.1 88.7 92.1 89.7 97.7 93.1 87.4 91.6 in 1997
O CL
O β)
<° 'S <n ra
I
8-• Q. o O υ 5.8 1.0 1.8 3.4 1.3 5.5 2.8 1.5 0.1 2.1 4.3 1.5 ω f O 3.4 2.1 3.7 7.9 12.6 5.8 5.1 8.8 2.2 4.7 8.3 6.8Source: Eurostat, CEC
New Enterprises in Central European Countries in 1997
Wh
eurostatTable 5 : Distribution of active enterprises by size class (%)
Country Albania Bulgaria Czech Rep. Estonia Hungary Latvia Lithuania Poland Romania Slovakia Slovenia CEC Enterprises existing at January 1995 Salaried employees 0 79.6 81.0 72.9 27.9 61.1 16.5 51.6 64.6 64.8 66.2 50.6 66.2 1-49 19.1 17.1 25.7 68.5 37.9 78.7 44.0 34.1 34.3 32.2 47.0 32.4 >50 1.3 1.9 1.4 3.6 1.0 4.8 4.4 1.3 0.9 1.6 2.4 1.4 Enterprises created in 1995 Salaried employees 0 70.7 82.1 76.4 54.3 61.9 29.4 51.7 61.9 59.3 56.1 71.1 66.9 1-49 25.9 17.3 22.6 44.2 37.5 67.0 46.4 37.5 40.2 42.5 28.3 32.3 >50 3.4 0.5 1.0 1.5 0.6 3.6 1.9 0.5 0.6 1.4 0.6 0.8 Enterprises created in 1996 Salaried employees 0 67.4 14.6 72.4 29.2 79.4 28.3 39.2 64.7 57.0 59.4 62.2 60.1 1-49 31.1 85.1 26.9 69.2 20.3 69.8 58.8 34.4 42.6 39.1 37.1 39.1 >50 1.4 0.4 0.7 1.6 0.3 1.9 2.0 0.9 0.4 1.5 0.7 0.8 Enterprises created in 1997 Salaried employees 0 64.7 62.0 75.3 33.6 53.3 19.9 37.6 70.1 55.7 64.1 64.7 65.9 1-49 34.9 37.0 24.4 65.7 46.3 78.6 60.7 28.6 44.2 34.7 34.7 33.2 >50 0.3 1.0 0.3 0.6 0.4 1.5 1.7 1.2 0.1 1.2 0.6 0.9
Source: Eurostat, CEC
Table 6 : Share of total employment by enterprise size class (%).
Country Albania Bulgaria Czech Rep. Estonia Hungary Latvia Lithuania Poland Romania Slovakia Slovenia CEC Enterprises existing at January 1995 Salaried employees 0 13.9 13.2 16.6 5.0 15.5 2.3 5.9 14.7 26.0 12.7 6.8 14.9 1-49 18.6 16.8 31.4 50.1 41.6 43.2 28.3 35.5 47.2 34.8 27.2 34.1 >50 67.5 70.0 52.0 44.9 42.9 54.5 65.8 49.8 26.8 52.5 66.0 51.0 Enterprises created in 1995 Salaried employees 0 11.6 26.8 16.6 11.5 22.7 5.1 10.2 16.6 28.2 10.1 24.3 18.2 1-49 24.1 23.6 29.7 51.7 47.6 36.5 49.1 48.4 54.5 41.4 41.5 39.8 >50(') 64.3 49.6 53.7 36.7 29.7 58.4 40.8 34.9 17.3 48.5 34.3 42.0 Enterprises created in 1996 Salaried employees 0 17.8 4.2 19.7 3.9 31.1 6.5 4.9 14.1 24.3 10.5 23.2 14.2 1-49 40.9 84.7 42.7 46.4 33.9 62.1 41.7 39.4 61.6 35.2 51.5 45.3 >50(') 41.3 11.1 37.6 49.7 35.0 31.3 53.4 46.5 14.0 54.3 25.3 40.5 Enterprises created in 1997 Salaried employees 0 28.5 21.0 30.3 5.3 16.5 4.4 4.9 14.5 25.9 16.2 22.0 16.8 1-49 60.4 51.3 55.7 54.9 62.4 70.0 45.9 29.1 67.0 48.5 46.3 40.2 >50(') 11.1 27.8 13.9 39.7 21.1 25.6 49.2 56.4 7.1 35.2 31.6 42.9
(') These columns have a large statistical error and have been corrected for outliers. The data should be handled with caution.
Source: Eurostat, CEC
Wh
eurostat New Enterprises in Central European Countries in 1997
Table 7 : Share of total employment by type of employment (%)
Country Albania Bulgaria Czech Rep. Estonia Hungary Latvia Lithuania Poland Romania Slovakia Slovenia CEC
Enterprises existing at January 1995
tu c 5 O 17.9 13.6 18.8 11.5 24.6 6.1 9.6 20.0 26.5 14.2 11.6 18.9 Full-tim e salarie d employee s 78.3 78.4 68.9 76.2 64.1 83.7 81.1 60.8 50.9 74.9 80.9 66.8 Part-tim e salarie d employee s 3.2 1.7 4.8 5.8 4.6 6.7 6.5 6.5 2.2 2.9 0.9 4.6 Othe r employee s 0.6 6.3 7.5 6.5 6.8 3.5 2.8 12.7 20.3 8.0 6.6 9.8
Enterprises created in 1995
w CD C 3 O 16.6 13.8 21.8 21.1 37.1 9.6 17.9 29.3 43.0 17.3 32.6 23.3 Full-tim e salarie d employee s 79.7 82.7 59.1 66.4 49.9 78.4 71.9 54.6 40.9 71.2 56.3 64.4 Part-tim e salarie d employee s 3.2 1.0 12.0 5.7 7.5 3.9 8.0 6.7 2.1 2.7 1.8 5.6 Othe r employee s 0.5 2.6 7.2 6.9 5.4 8.1 2.2 9.5 13.9 8.8 9.3 6.7 Country Albania Bulgaria Czech Rep. Estonia Hungary Latvia Lithuania Poland Romania Slovakia Slovenia CEC
Enterprises created in 1996
eu c 5 O 27.1 22.2 27.2 6.7 34.7 14.8 10.5 24.0 39.9 16.7 36.1 24.3 Full-tim e salarie d employee s 62.2 56.3 59.6 83.3 65.3 70.7 78.7 61.8 33.5 70.6 53.7 61.1 Part-tim e salarie d employee s 9.0 10.1 3.7 5.1 0.0 7.6 10.5 5.0 2.6 1.8 2.2 5.1 V) a>
>- 0)
cu >.
c o
δ
g-cu 1.6 11.3 9.6 4.9 0.0 6.8 0.3 9.2 24.0 10.9 8.0 9.5
Enterprises created
ι -Ο) c 5 O 42.5 36.3 39.6 11.4 32.3 12.6 9.9 22.1 42.4 24.0 35.4 26.2 Full-tim e salarie d employee s 51.3 51.9 43.9 76.1 59.5 71.1 79.8 63.6 35.0 58.7 51.6 59.4 α> E CO Q . in 1997 en
■8 S fe o râ g· <n E 5.8 2.7 3.3 8.4 4.3 7.9 9.9 6.5 1.2 1.9 1.1 5.3 CO
*. s
0) ><
π o
δ ι
S) 0.4 9.2 13.2 4.1 3.9 8.4 0.5 7.9 21.5 15.4 11.9 9.1Source: Eurostat, CEC.
New Enterprises in Central European Countries in 1997
Wh
eurostatTable 8 : Distribution of active enterprises by number of local units (%)
Country Albania Bulgaria Czech Rep. Estonia Hungary Latvia Lithuania Poland Romania Slovakia Slovenia CEC Enterprises existing at January 1995 Number of local
units 1 > 1
98.0 2.0
96.8 3.2
94.6 5.4
91.3 8.7
95.1 4.9
85.1 14.9
93.5 6.5
92.9 7.1
94.8 5.2
94.2 5.8
94.0 6.0
93.4 6.6
Enterprises created in 1995 Number of local
units 1 > 1
98.1 1.9
98.7 1.3
95.6 4.4
94.6 5.4
97.9 2.1
91.2 8.8
96.1 3.9
92.1 7.9
95.8 4.2
96.5 3.5
97.6 2.4
95.2 4.8
Enterprises created in 1996 Number of local
units 1 > 1
98.3 1.7
84.8 15.2
96.4 3.6
92.8 7.2
na na
93.2 6.8
94.1 5.9
95.5 4.5
95.4 4.6
96.5 3.5
97.8 2.2
94.4 5.6
Enterprises created in 1997 Number of local
units 1 > 1
97.8 2.2
96.9 3.1
96.4 3.6
93.7 6.3
95.3 4.7
91.8 8.2
94.9 5.1
96.6 3.4
94.7 5.3
96.9 3.1
98.1 1.9
96.3 3.7
na: not available
Source: Eurostat, CEC
Table 9 : Distribution of active enterprises by principal place of activity (%)
Country
Albania Bulgaria Czech Rep. Estonia Hungary Latvia Lithuania Poland Romania Slovakia Slovenia CEC Enterprises existing at January 1995
c cu *D Q)
C CJ Φ π
Ss:
■σ c
y
ff E
ra o ¡S =
5
89.5 10.5
58.0 42.0
39.9 60.1
73.7 26.3
61.6 38.4
78.0 22.0
79.4 20.6
39.5 60.5
54.5 45.5
40.3 59.7
34.4 65.6
48.0 52.0
Enterprises created in 1995
c ω "D φ
c υ cu π 8s: ■σ c 86.4 36.2 34.7 67.7 62.9 84.9 81.9 43.6 51.7 41.1 26.8 45.2 co
Φ cu
ff ε
ra 0 ra ^ 13.6 63.8 65.3 32.3 37.1 15.1 18.1 56.4 48.3 58.9 73.2 54.8 Enterprises created in 1996 c φ "O φ
C o φ π
& E
Τ3 C 89.7 70.7 35.0 68.5 64.5 73.3 78.7 38.6 58.7 52.6 33.0 47.4 y
Φ Φ ff ε ra o 5 x
S 10.3 29.3 65.0 31.5 35.5 26.7 21.3 61.4 41.3 47.4 67.0 52.6
Enterprises created in 1997
c φ
Ό φ C o Φ ra & Ε ■o c 85.3 62.8 34.8 51.7 67.7 84.3 84.2 36.3 58.4 49.9 33.7 45.2 y
Φ Φ
ff ε
ra o
S =
2 14.7 37.2 65.2 48.3 32.3 15.7 15.8 63.7 41.6 50.1 66.3 54.8
Source: Eurostat, CEC