Statistics
•
in
focus
•••••••••••••••••••
POPULATION AND
SOCIAL CONDITIONS
THEME 3 - 16/2000
POPULATION AND LIVING
CONDITIONS
Contents
EU population continues to
increase slowly, irregularly ... 1
. .. and differently ... 3
Live births increasing again .... 4
Number of deaths
remains
almost unchanged ... 5
Net migration increases ... 6
(*:
[3!n~
L---*-*_*
- - - Jeurostat
f
D
Manuscript completed on: 14/12/2000
ISSN
1024-4352
Catalogue number: CA-NK-00-016-EN-C
Price in Luxembourg per single copy
(excl. VAT): EUR 6
© European Communities, 2000
A
First demographic estimates for 2000
•••••••••••••••••••••••••••••••••••••••••••
After a period of decline, the net inflow of international migrants (immigration
minus emigration) to the European Union increased from 578 OOO in 1998 to
720 OOO people in 1999. Based upon monthly data available at the end of
2000, latest forecasts and expert opinions, net migration is expected to show
a further increase in 2000 to a level of 816 OOO people
.
The total number of live births is expected to increase slightly, whilst the
number of deaths will barely change. Natural population growth (live births
minus deaths) is forecast to increase from 277 OOO in 1999 to 343 OOO in
2000 .
Consequently, total population growth is estimated to reach a level of well
over 1.1 million, b
r
inging the EU population on 1 January 2001 to 377.6
million.
For the first time, figures for the 12 candidate countries are also presented
here.
EU population continues to increase slowly, irregularly ...
During the last 50 years
,
the population o
f
the present EU has grown from 295
to almost 378 million (F
i
gure
1). In 1953
,
EU's population size exceeded 300
million. Thereafter
i
t took 10
,
13 and 22 years to shelter another 25 million
inhabitants. So, population growth started to slow down during the last 2-3
decades.
With an estimated population growth of just over 1 million people
,
2000 fits
fairly well in this latter general trend. Although during the second half of the
1990s
l
ower levels were recorded,
t
his
i
ncrease
i
s much smaller than those
observed around 1992 (well over 1.5 million) or during the 1960s (on average
2.5 million a year).
In relative terms, the EU population is expected to grow by 0.31
%
in 2000 .
Again compared w
i
th the late 1990s, this level is slightly higher, but from a
more long-term perspective
,
it is a rather modest growth (Figure 2)
.
MILLIONS
400~~~~~~~~~~~~~~~~~~~~~~~~~~
[image:1.592.8.578.265.858.2]1950 1960 1970 1980 1990 2000
Table 1: Population change in 2000 (first estimates)
Population Live Deaths Natural Net Total Population Live Deaths Natural
Net
TotalCOUNTRY 1.1.2000 births increase migration increase 1.1.2001 births increase migration increase
(1000) per 1 OOO population
EU-15 376455.3 4054.9 3 712.3 342.6 816 1158.7 377614.0 10.8 9.8 0.9 2.2 3.1 EUR-11 292 094.8 3115.7 2829.7 286.0 618 904.2 292 999.1 10.7 9.7 1.0 2.1 3.1 Belgium 10 236.1 114.0 103.6 10.4 20 30.4 10 266.5 11.1 10.1 1.0 2.0 3.0
Denmark 5330.0 66.4 57.7 8.7 10 18.7 5348.8 12.4 10.8 1.6 1.9 3.5
Germany
82163.5 760.0 860.0 -100.0 200 100.0 82263.5 9.2 10.5 ·1.2 2.4 1.2Greece
10545.7 103.0 104.0 -1.0 25 24.0 10 569.7 9.8 9.9 -0.1 2.4 2.3Spain 39441.7 386.5 359.3 27.2 40 67.2 39508.9
9.8
9.1 0.7 1.0 1.7France 1> 59226.0 778.0 534.3 243.7
50
293.7 59519.7 13.1 9.0 4.1 0.8 4.9Ireland 3776.6 55.4 30.5 24.9 25 49.9 3826.5 14.6 8.0 6.5 6.6 13.1
Italy
57679.9 560.1 563.8 -3.7 200 196.3 57876.2 9.7 9.8 -0.1 3.5 3.4Luxembourg 435.7 5.7 3.7 2.0 5 7.0 442.7 13.0 8.5 4.6 11.4 16.0
Netherlands 15864.0 206.3 140.8 65.5 52 117.7 15 981.6 13.0 8.8 4.1 3.3 7.4
Austria 8102.6 78.6 76.7 1.9 12 13.6 8116.1 9.7 9.5 0.2 1.4 1.7
Portugal 9997.6 115.5 107.9 7.6 11 18.6 10 016.2 11.5 10.8 0.8 1.1 1.9
Finland 5171.3 55.8 49.1 6.7 3 10.0 5181.3 10.8 9.5 1.3 0.6 1.9
Sweden 8 861.4 89.7 94.1 -4.4
23
18.5 8879.9 10.1 10.6 -0.5 2.6 2.1United Kingdom 59623.4 680.1 626.8 53.3 140 193.3 59 816.7 11.4 10.5 0.9 2.3 3.2
Iceland 279.0 4.3 1.8 2.5 1.4 3.9 282.9 15.2 6.5 8.8 5.0 13.8
Liechtenstein 32.4 0.4 0.2 0.2 0.2 0.4 32.8 12.3 6.1 6.1 6.1 12.3
Norway 4478.5 60.0 45.0 15.0 15 30.0 4508.5 13.4 10.0 3.3 3.3 6.7
EEA 381245.3 4119.6 3759.3 360.3 833 1 193.0 382438.3 10.8 9.8 0.9 2.2 3.1
Switzerland 7164.4 76.7 61.5 15.2 25 40.2 7204.7 10.7 8.6 2.1 3.5 5.6
Bulgaria 8190.9 71.3 113.2 -41.9
-20
-61.9 8129.0 8.7 13.9 -5.1 -2.5 -7.6 Czech Republic 10 274.1 90.0 106.1 -16.1 9 -7.0 10 267.1 8.8 10.3 -1.6 0.9 -0.7 Hungary 10 043.2 95.9 133.6 -37.7 0.1 -37.6 10005.6 9.6 13.3 -3.8 0.0 -3.8Poland 38647.0 376.7 370.8 5.9 -22 ·16.3 38630.7 9.7 9.6 0.2 -0.6 -0.4
Romania 22455.5 234.6 257.8 -23.1 -4 -27.2 22428.3 10.5 11.5 -1.0 -0.2 -1.2 Slovak Republic 5398.7 56.0 54.1 1.9 1.4 3.3 5402.0 10.4 10.0 0.4 0.3 0.6
Slovenia 1 987.8 17.5 18.5 -1.0 2 1.0 1 988.8 8.8 9.3 -0.5 1.0 0.5
Estonia 1 439.2 13.0 18.7 -5.6 -0.8 -6.4 1 432.8 9.1 13.0 -3.9 -0.6 -4.5
Latvia 2424.2 20.0 31.6 -11.6 -3 -14.1 2 410.1 8.3 13.1 -4.8
·1.0
-5.8
Lithuania 3698.5 33.5 39.2 -5.8 0.9 -4.9 3693.6 9.1 10.6 -1.6 0.2 -1.3
Cyprus 666.7 7.9 5.2 2.7 0.7 3.3 670.1 11.8 7.8 4.0 1.0 5.0
Malta 380.2 4.0 3.2 0.8 0.5 1.3 381.5 10.5 8.4 2.1 1.3 3.4
1
> Population at 1.1.2000 is based upon population census 1990 and live births, deaths and net migration estimates during the period 1990-1999. According to population census 1999, total population at 1 January 2000 amounted 58 7 47 OOO persons (estimate at 6 November 2000)
•
Statistics in focus -
Theme 3-16/2000 - - - -
I
=Vi1
eurostat
... and differently
1 2 . . - - - ~
1 0 + - - - l
§
I
8§
ie++-~-t-t---=-tr-1+---1
0 + - - - . - - - - . - - - , - - - , - - - - . . . - '
1950 1960 1970 1980 1990 2000
Figure 2: Total population growth, EU-15, 1950-2000
LU
IS
IE LI
NL NO
CH
CY FR DK
MT IT
UK EEA
EUR-11 EU-15 BE GR SE
FI
PT
ES
AT DE
SK SI
Pl.
cz
RO
LT
HU
EE
LV
BG
-10 ·5 0 5 10 15 20
I•
NATURAL INCREASE • NET MIGRATION
I
PER 1000 POPULATIONFigure 3: Crude total population growth rate, 2000
Table 1
and
figure 3
demonstrate that (also) in 2000 EU
Member States will experience quite different rates of
population growth. The population of both Luxembourg
and Ireland will continue to grow with a speed of well
over 1
%,
whereas Germany just exceeds a rate of
0.1%.
These first estimates confirm that international migration
is still an important component of population change.
For example, without migration, Germany, Greece, Italy
and Sweden would experience a population loss and
Austria and Spain would barely grow.
Two thirds of the EU countries are expected to see an
increase in their population growth in 2000
(Figure
4).
Notably Italy and Sweden are experiencing a relatively
strong increase in their population growth due to
significant net inflows of migrants.
LU
LI
IS
IE
NO NL
CH
CV
SI
MT
FR
UK
DK
EEA
EU-15 EUR-11 AT GR
FI
BE
PT
DE
ES
IT
SK SE PL LT
RO
cz
EE BG HU LV
[image:3.587.29.275.86.281.2]-10 -5 0 5 10 15 % 20
Figure
4:
Population growth, relative change from
1999 to 2000
[3!B
eurostat
[image:3.587.30.548.348.736.2]Live births increasing again
1950 1960 1970 1960 1990 2000
Figure 5: Live births, EU-15, 1950-2000
IS IE NO
FR
LU NL
OK
LI CY PT UK BE EEA FI EU-15 CH EUR-11 MT
RO
SK SE ES GR PL IT
AT
HU DE EE LT SI
cz
BG LV
4 6 8 10 12 14 16
PER 1000 POPULATI~
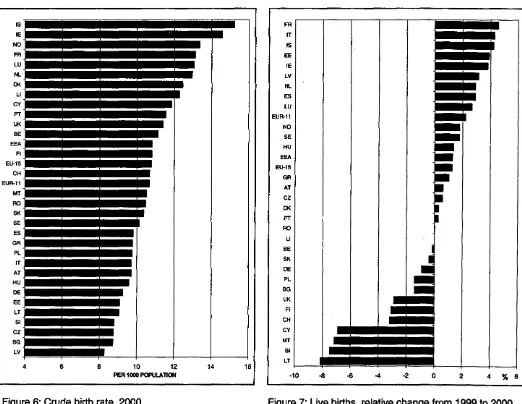
Figure 6: Crude birth rate, 2000
In 2000 the number of live births is expected to reach a
level of 4.05 million, which is about 1.3% more than in
1999. Levels have not been that high since 1994, but a
real millennium baby boom did not occur. In the
mid-1960s the annual number of babies was over 2 million
higher, but during the period 1965 to 1975 fertility
dropped dramatically
(Figure
5).
Crude birth rates are forecast to remain highest in
Ireland and lowest in Germany
(Figure 6).
Only four EU countries will probably see a decrease in
live births
(Figure
7),
with Finland facing the strongest
change (-3%). France, on the other hand, is expected to
be the EU country with the strongest rise (well over
4%).
FR IT IS EE IE LV NL ES LU EUR-11 NO SE HU EEA EU-15 GR AT
cz
OK
PT
RO
LI BE SK OE
PL
BG UK FI CH CY
MT
SI LT
·10 -8 -6 -4 -2 0 2 4
%
Figure 7: Live births, relative change from 1999 to 2000
•
Statistics In focus - Theme 3 -
16/2000
[image:4.593.40.562.334.738.2]Number of deaths remains almost unchanged
MIWONS
1 - - - ~
1950 1980 1970 1980
Figure 8: Deaths, EU-15, 1950-2000
BG
HU LV
EE RO
CK
PT LT SE UK OE
cz
BE SK NO GR EU-15 EEA IT EUR-11 PL FI
AT
SI
ES FR NL
CH
LU MT
IE
CV
-1990 2000
IS=~_L_L_l_L_J
LI4 6 8 10 12 14 16
PER 1000 POPULATION
Figure 9: Crude death rate, 2000
In 1976 the number of deaths in the EU reached a
post-war high of almost 3.8 million. Thereafter, the annual
number of deaths fluctuated and decreased somewhat
to ultimately a level of around 3. 7 million (Figure 8). The
impact of a growing number of elderly people on deaths
was fully compensated by decreasing death rates. For
2000, it is also expected that the effects of population
ageing will be counterbalanced by a further decrease in
mortality rates.
Due to an aged population and a relatively less
favourable mortality pattern Denmark will continue to be
the EU Member State with the highest crude death rate
(Figure
9). Ireland with its relatively young population is
the Member State most likely to have the lowest level.
About two-thirds of the EU countries have had a
relatively 'good' year (Figure 10), with Ireland in the lead
(±4% less deaths). Germany is forecast to be
confronted with a rise in the number of deaths of about
2%.
SI
MT SK CV
DE
BG
EE GR NO NL PT LI
EUR-11 EU-15 EEA FI UK
SE IT BE
FR
AT
LT LU ES
CK
PL
RO
cz
LV
IE IS
CH
HU
[image:5.594.23.551.339.766.2].a
-6 -4 -2 0 2 4 6 % 8Figure 1 O: Deaths, relative change from 1999 to 2000
Net migration increases
•WONS
1 . 5 - - - ,
- 1 . o ~ - - - 1
- 1 . 5 " - - - '
1950 1980 1970 1980 1990
•> Including corrections due lo population censusM, reglsler counts, ale. which cannot be
clas8Hied . . births, daalhll Of nigralion
2000
Figure 11: Net migration
1>, EU-15, 1950-2000
IT
cz
EE SE AO BE LV IE IS EUA-11 NL EU-15 EEA MT PL LU DK PT ES
HU
BG
FR GR
DE SK FI LI
CH
UK NO LT
AT
SI CV
-500 ·400 ·300 -200 ·100 0 100 % 200
After a period of rather strong decline, the net inflow of
international migrants to the EU increased from 578 00
in 1998 to 720 OOO in 1999 (Figure 11). For 2000 net
migration is expected to increase further to a level of
816 OOO people. This is slightly higher than observed in
1995.
Germany, Italy and United Kingdom together will
receive around two-thirds of this net inflow (Figure 12),
although Luxembourg remains the EU country with the
relative highest net migration per 1 OOO inhabitants (see
Figure 3). Finland, France and Spain, on the other
hand, seem to grow less due to net migration than one
would expect considering their population size.
Italy is by far the country with the strongest growth in
net migration (Figure 13) due mainly to a new,
comprehensive
programme
of
regularisation
of
undocumented migrants in 2000.
BE DK
[image:6.592.40.551.350.768.2]U. I A
Figure 12: Net migration by Member State, 2000
Figure 13: Net migration, relative change from 1999 to 2000
•
Statistics In focus
-Theme 3 - 1 6 / 2 0 0 0 - - - -
I
=V!1
eurostat
l
Table 2: Information base for 2000, first estimates
1
)
Monthly data availability (up to and including)
COUNTRY
Live
Deaths
Immigration
Emigration
births
Belgium
July
July
-
3)-
3)Denmark
September
September
September
September
Germany
-
2)-
2)-
3)-
3)Greece
-
2)-
2)-
3)-
3)Spain
December
December
-
3)-
3)France
September
September
-
3)-
3)Ireland
March
March
-
3)-
3)Italy
April
April
-
3)-
3)Luxembourg
September
September
_3)-
3)Netherlands
September
September
September
September
Austria
August
August
_2)-
2)Portugal
June
June
-
3) _3)Finland
October
October
October
October
Sweden
September
September
September
September
United Kingdom June
June
-
3)-
3)Iceland
September
September
September
September
Liechtenstein
-
-
-
-Norway
September
September
September
September
Switzerland
July
July
September
41September
41Bulgaria
December
December
-
3)-
3)Czech Republic September
September
September
September
Hungary
September
September
_4) _4)Poland
September
September
-
2) _ 2 )Romania
June
June
-
3) _3)Slovak Republic June
June
June
June
Slovenia
July
July
June
June
Estonia
October
October
September
September
Latvia
September
September
September
September
Lithuania
August
September
September
September
Cyprus
April
April
September
September
Malta
-
-
-
-11
Estimates are primarely based upon provisional monthly data series available around
1 December 2000. Technical details about the methodology used for live births and deaths
can be found in Eurostat Working Paper E4/1997-7. The forecast methods applied for
lntemational migration and asylum applications will be published shortly in the same series
2
1
National estimates
31
National estimates solely on net migration
4
>
Non-nationals only
51
Including family members
81
Excluding family members
I
=V/1
Further information:
)-
Databases
New Cronos, Domain DEMO
To obtain information or to order publications, databases and special sets of data, please contact the
Data Shop
network:
BELGIQUE/BELGIE DANMARK DEUTSCH LAND ESPANA FRANCE ITALIA- Roma
Eurostat Data Shop DANMARKS STATISTIK STATISTISCHES BUNDESAMT INE Eurostat Data Shop INSEE Info Service ISTAT
Bruxelles/Brussel Bibliotek og lnfonnation Eurostat Data Shop Berlin Paseo de la Castellana, 183 Eurostat Data Shop Centro di lnfonnazione Statistica
Planistat Belgique Eurostat Data Shop Otto-Braun-Strarie 70-72 Oficina 009 195, rue de Berey Sede di Roma, Eurostat Data Shop
Rue du Commerce 124 Sejr0gade 11 (Eingang: Karl-Marx-Allee) Entrada por Estebanez Calderon Tour Gamma A Via Cesare Balbo, 11 a Handelsstraat 124 DK-2100 K0BENHAVN 0 D-10178 BERLIN E-28046 MADRID F-75582 PARIS CEDEX 12 1-00184 ROMA
B-1 OOO BRUXELLES / BRUSSEL Tlf. (45) 39 17 30 30 Tel. ( 49) 1888 644 94 27 /28 Tel. (34) 91 583 91 67 Tel. (33) 1531788 44 Tel. (39) 06 46 73 31 02/06
Tel. (32-2) 234 67 50 Fax (45) 3917 30 03 Fax (49) 1888-644 94 30 Fax (34) 91 579 71 20 Fax (33) 1 53 17 88 22 Fax (39) 06 46 73 31 01/07
Fax (32-2) 234 67 51 E-mail: bib@dstdk E-Mail: datashop@statistik-bund.de E-mail: datashop.eurostat@ine.es E-mail: datashop@insee.fr E-mail: dipdiff@istat.it E-mail: datashop@planistat.be
ITALIA- Milano LUXEMBOURG NEDERLAND NORGE PORTUGAL SCHWEIZ/SU ISSE/SVIZZERA
ISTAT Eurostat Data Shop Luxembourg STATISTICS NETHERLANDS Statistics Norway Eurostat Data Shop Lisboa Statistisches Amt des Kantons
Ufficio Region ale per la Lombardia BP 453 Eurostat Data Shop-Voorburg Library and Information Centre INE/Servi~o de Difusao Ziirich, Eurostat Data Shop
Eurostat Data Shop L-2014 LUXEMBOURG Postbus 4000 Eurostat Data Shop Av. Antonio Jose de Almeida, 2 Bleicherweg 5 Via Fiene 3 4, rue Alphonse Weicker 2270 JM VOORBURG Kongens gate 6 P-1000-043 LISBOA CH-8090 Zorich 1-20123 MILANO L-2721 LUXEMBOURG Nederland Boks 8131 Dep. Tel. (351) 21 842 61 00 Tel. (41-1) 2251212 Tel. (39) 02 80 61 32 460 Tel. (352) 43 35-2251 Tel. (31-70) 337 49 00 N-0033 OSLO Fax (351) 21 842 63 64 Fax (41-1) 22512 99 Fax (39) 02 80 61 32 304 Fax (352) 43 35-22221 Fax (31-70) 337 59 84 Tel. (47) 22 86 46 43 E-mail: data.shop@ine.pt E-mail: datashop@zh.ch
E-mail: mileuro@tin.it E-mail: dslux@eurostatdatashop.lu E-mail: datashop@cbs.nl Fax (47) 22 86 45 04 Internet: http://www.zh.ch/statistik E-mail: Datashop@ssb.no
SUOMI/FINLAND SVERIGE UNITED KINGDOM UNITED KINGDOM UNITED STATES OF AMERICA
STATISTICS FINLAND STATISTICS SWEDEN Eurostat Data Shop Eurostat Data Shop HAVER ANAL YTICS Eurostat Data Shop Helsinki lnfonnation service . Enquiries & advice and Electronic Data Extractions, Eurostat Data Shop
Tilastoklrjasto Eurostat Data Shop publications Enquiries & advice - R.CADE 60 East 42nd Street
Pt.28 Karlavagen 100 -Box 24 300 Office for National Statistics 1 L Mountjoy Research Centre Suite 3310
FIN-00022 nlastokeskus
S-104 51 STOCKHOLM Customers & Electronic Services Unit University of Durham NEW YORK, NY 10165
Tyiipajakalu 13 8, 2. Kerros, Helsinki
P. (358-9) 17 34 22 21 Tfn (46-8) 50 69 48 01 1 Drummond Gate -B 1 /05 DURHAM DH1 3SW USA
F. (358-9) 17 34 22 79 Fax (46-8) 50 69 48 99 LONDON SW1V 2QQ United Kingdom Tel. (1-212) 986 93 00
Sahkoposti: E-post: infoservice@scb.se United Kingdom Tel: (44-191) 374 73 50 Fax (1-212) 986 69 81
datashop.tilastokeskus@tilastokeskus.fi lnternet:http://www.scb.seftnfo/datasho Tel. (44-20) 75 33 56 76 Fax: (44-191) 384 49 71 E-mail: eurodata@haver.com URL:
p/eudatashop.asp Fax (44-1633) 81 27 62 E-mail: r-cade@dur.ac.uk hllp://www.blastokeskus.fi/tklkk/datashop.html E-mail: eurostat.datashop@ons.gov.uk Internet: http://www-rcade.dur.ac.uk
Media Support Eurostat (for professional journalists only).
Bech Building Office A3/48 • L-2920 Luxembourg • Tel. (352) 4301 33408 • Fax (352) 4301 32649 • e-mail: eurostat-mediasupport@cec.eu.int
For information on methodology
This publication has been produced by Harri Cruijsen and Harold Eding (Statistics
Netherlands). For further information, contact:
Frani;;ois-Carlos Bovagnet, Eurostat/E4, L-2920 Luxembourg, Tel. (352) 4301 33527, Fax (352) 4301 34029,
E~mail: francois.bovagnet@cec.eu.int
ORIGINAL
:
English
Please visit our web site at www.europa.eu.int/comm/eurostat/ for further informa
t
ion
IA list of worldwide sales outlets is available at the Office for Official
Publications of the
European
Communities.
2 rue Mercier- L-2985 Luxembourg Tel. (352) 2929 42118 Fax (352) 2929 42709 Internet Address http://eur-op.eu.int/fr/general/s-ad.htm
e-mail: info.info@cec.eu.int
BELGIQUE/BELGlt - DANMARK -DEUTSCHLAND - GREECE/ELLADA - ESPANA -FRANCE -IRELAND -ITALIA -LUXEMBOURG - NEDERLAND - OSTERREICH PORTUGAL -SUOMI/FINLAND - SVERIGE -UNITED KINGDOM - iSLAND -NORGE -SCHWEIZ/SUISSE/SVIZZERA- BALGARIJA-CESKA REPUBLIKA-CYPRUS
EESTI - HRVATSKA-MAGYARORSzAG-MALTA-POLSKA- ROMANIA- RUSSIA-SLOVAKIA- SLOVENIA- TORKIYE -AUSTRALIA-CANADA- EGYPT - INDIA
ISRAEL-JAPAN-MALAYSIA-PHILIPPINES- SOUTH KOREA-THAILAND -UNITED STATES OF AMERICA
-
-
--
-
-
-
-
--
--
----
-
-
-
----
--
-
----
-
--
-
--
--
-
-
----
-
-
-
-
---
-
--
--
-
-
-
--
-
-
-
--
--
-
-
--x-
--
-
----
-
-
-D
Please send me a
free copy of 'Eurostat Mini-Guide
'
(catalogue
Order_form
I
would
like
to subscribe to Statistics in focus (from 1
.
1.2000
to 31
.
12
.
2000)
:
(for
the Data
Shop and sales office addresses see above)
D
Formula 1
:
All 9
themes
(approximately 140 issues)
D
Paper:
EUR 360
D
PDF:
EUR 264
D
Paper+ PDF
:
EUR
432
Language
required:
D
DE
D
EN
D FR
D
Formula 2: One or more of
the
following seven
themes:
D
Theme
1
'General
statistics
'
D
Paper
:
EUR 42 D PDF
:
EUR
30 D Combined
:
EUR 54
D
Theme 2
'Economy
and finance'
D
Theme 3 'Population and social conditions'
D
Theme
4 'Industry
,
trade and services
D
Theme 5
'Agriculture
and fisheries
'
D
Theme 6
'External
trade'
D
Theme
8
'
Environment and
energy
D
Paper: EUR 84 D PDF: EUR 60
D
Combined
:
EUR 114
Language required
:
D
DE
D
EN
·
D FR
containing a selection of Eurostat products and services)
Language required
:
D
DE
D
EN
D
FR
o
I would like a
free subscription to
'
Statistical References
',
the information
letter on Eurostat products and services
Language required
:
D
DE
D
EN
D
FR
D
Mr
D
Mrs
D
Ms
{Please
use block capitals)
Surname
:
Company
:
_ _ _ _ _ _ _ Forename
:
_ _ _ _ _ _ _ Department:
Function: _ _ _ _ _ _ _ _ _ _ _ _ _ _ _ _ _ _ _
_
Address:
Post code
:
_ _ _ _ _ _ _ Town
:
_ _ _ _ _ _ _ _ _
_
Country:
Tel.
:
_ _ _ _ _ _ _ _ _ Fax:
E-mail: _ _ _ _ _ _ _ _ _ _ _ _ _ _ _ _ _ _ _
_
Payment
on receipt of invoice, preferably by:
D
Bank transfer
D
Visa
D
Eurocard
Card
No:
Expires on: _ _
!
__
Please
confirm your intra-Community
VAT number:
If no number is entered, VAT will be automati ally applied. Subsequent