RHEOLOGICAL PROPERTIES OF
WHEAT FLOUR DOUGH
A dissertation presented in partial fulfilment
of the requirements for the Master in
Food Technology of Massey University
ACKNOWLEDGEMENTS
I would like to express my sincere thanks and appreciation to my supervisors Dr Osvaldo Campanella and Mr Mark Morgenstern, for their invaluable help, support and guidance throughout this research.
I would also give my thanks to New Zealand Institute for Crop & Food Research Ltd in Lincoln for supporting me and providing financial assistance.
Thanks to all of staffs in Department of Food Science & Technology, Massey University, for their help and support.
Summary
Wheat flour dough is one of the most complex rheological systems, which has been studied by a number of cereal scientists, food technologists, and rheologists through many decades. Research on fundamental rheological properties of wheat flour dough appears to be increasing in importance recently because of the application of continuous and automatic food processing operations such as extrusion, MDD bread making, and sheeting in modern bakery industries.
Among all of the cereal flours only wheat flour dough has umque viscoelastic properties. These viscoelastic properties are necessary to produce the spongy structure of bread loaf after the flour is mixed with water, fermented by yeast and baked (Hoseney and Rogers, 1990). Also the unique properties of wheat flour make it suitable for breadmaking because gas cells can be retained in the dough during mixing and proofing (Janssen, 1995). Wheat cultivars often differ, however, in their breadmaking performances. Gluten proteins are largely responsible for these differences (Janssen, 1995).
A possible correlation between fundamental rheological properties of wheat flour dough and processing conditions during breadmaking, notably MDD mixing behaviour and sheeting, was focused on in this study.
Rheological measurements including Dynamic Oscillation, Shear Stress Growth Test, Relaxation Test, Planar Extensional Flow Test, and Extrusion Test were carried out to study the rheological properties of wheat dough.
warmed up. Non-mixing dough gave similar values of storage modulus than mixed doughs. However, moisture content of non-mixing dough was lower than that of mixed dough despite the same water absorption was used as the amount of ice utilised was calculated taking into account in density.
Results of large deformation tests, namely the Shear Stress Growth Test, the Planar Extensional Flow Test and the _Extrusion Test showed that there were significant differences among doughs prepared with different mixing conditions (under-mixed, optimum-mixed and over-mixed dough). The rheological properties were also depending on the type of flour used.
Slippage of the dough samples during the measurement was minimised by using sandpaper attached to the test plates. Serrated plates and smooth parallel plates were also used to compare with the results obtained using sandpaper.
It was found water absorption affects the fundamental rheological properties of dough dramatically. Decreasing water absorption increased the storage modulus G' and decreased the phase angle.
Confocal microscopy was used to observe the difference among Bakers (a strong flour) and Soft flour (a weak flour) dough prepared with various mixing conditions. A new deep frozen and cutting method was used to prepare the specimen. There were clear and significant differences between optimum MDD mixed dough and dough prepared with other level of mixing energy. Microscopy showed that optimum developed doughs had an uniform and well-developed structure.
Rheological Changes of Dough during Dough Development
TABLE OF CONTENTS
Acknowledgements
Summary
List of Illustrations List of Tables
Chapter One Introduction
1. 1.1 1.2
Introduction Background
The Object of this Study
Chapter Two Literature Review
2.1
2.2
2.3
Wheat Flour and Wheat Flour Dough
2.1.1 Wheat Flour Gluten and its Components 2.1.2 Wheat Starch and other Components
The Structure of Wheat Flour Dough
Factors Affecting the Properties of Wheat Flour Dough 2.3.1 Water Absorption
2.3.2 Dough Mixing Conditions
(a) (b) (c) Non-mixing dough Under-mixed dough Optimum-mixed dough
Table Contents
(d) Over-mixed dough 19
2.3.3 Temperature 19
2.3.4 Resting Time 19
2.3.5 Fermentation of Bread Dough 20
2.3.6 Use of Additives 20
(a) Effects of Salt and Sugar 20
(b) Effects of Oxidising agent (Ascorbic acid) 21
(c) Effects of Reducing agent (L-cysteine) 21
2.3.7 Effects of Emulsifiers, Oil and other Ingredients 22
2.4 Sheeting 23
2.5 Evaluation of the Quality of Dough 23
2.5.1 Empirical Rheological Methods 25
(a) Mixograph 27
(b) Farinograph 27
(c) Rheograph 29
(d) Mixatron 29
(e) Alveograph 30
(f) Extensograph 31
(g) Baking Test 32
2.5.2 Fundamental Rheological Methods 33
(a) Small Deformation Test-Dynamic Measurements 35
(b) Relaxation and Creep Tests 37
(c) Extensional Flow Tests-Large Deformation 38
(d) Planar Extensional Flow Test 40
2.6 Non-linear Behaviour of Flour-Water Dough 43
Rheological Changes of Dough during Dough Development
2.8 Confocal Laser Scanning Microscope
2.9 Preparation of Dough Sample for CLSM
Chapter Three. Materials and Methods
3.1 3.2 3.3 3.4 3.5 3.6 Materials
Flours (Bakers, Soft, Halo, and Beta flours), Water, Table Salt, Sugar, Vegetable oil, and Ascorbic Acid
Dough Preparation Equipment 3.2.1 50 g MDD system
3.2.2 The Hobart Mixer 3.2.3 The 1 kg MDD mixer 3.2.4 Sheeting
Rheological Instruments 3.3.1 Bohlin Rheometer
3.3.2 Instron Universal Test Machine (1) Planar Extensional Flow Test (2) Extrusion Test
3.3.3 Physica UDS200 Rheometer
Confocal Laser Scanning Microscopy
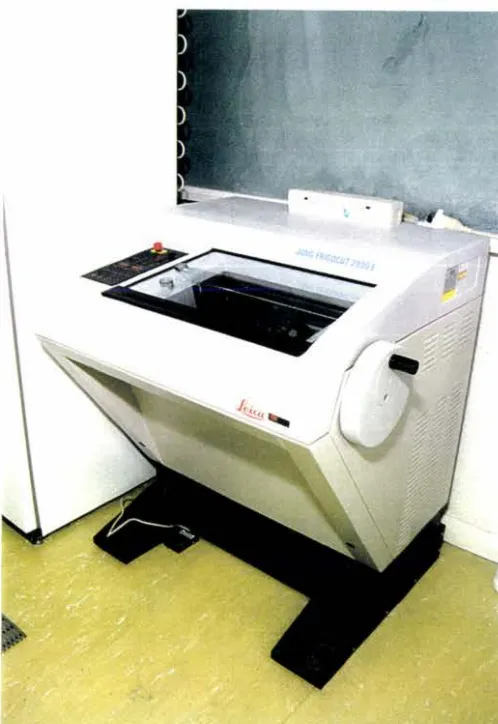
Cryostat Deep Frozen Cutting Machine
Methods
3.6.1 Dough Preparation
3.6.1.1 Non-mixing Dough
3.6.1.2 MDD Dough Preparation 66
3.7 Rheological Methods 68
3.7.1 Oscillation/Dynamic Test 68
3.7.2 Viscosity/Shear Stress Growth Tests 68
3.7.3 Relaxation Test 69
3.7.4 Planar Extensional Flow and Extrusion Tests 70
3.8 Water Content Measurement 70
3.9 Preparation of Dough for Confocal Microscope Observation 70
3.10 Baking Test 71
Chapter Four Results 72
4.1 Introduction 72
4.2 Rheological Measurements 74
4.2.1 Introduction 74
4.2.2 Determination of the linear viscoelastic region 74
4.2.3 Effect of gap 76
4.2.4 Relaxation experiments 77
4.3 Effect of Mixing 83
4.3.1 Mixing Behaviour of Bakers and Soft Flour 83
4.3.2 Empirical Fermentation Test results 86
4.3.3 The microstructure difference of Bakers and Soft flour dough 89 4.3.4 Effect of mixing on the dough rheological properties 98
(a) (b)
Small deformation test Large deformation test Shear Stress Growth Test
Rheological Changes of Dough during Dough Development
Results from Extrusion Test Planar Extensional Flow Test
Table Contents
112 118
4.4 Effect of dough ingredients & resting time on rheological properties of dough 121
4.5
4.4.1 Water Absorption
4.4.2 Effect of resting of wheat flour dough
4.4.3 Effect of vegetable oil replacing water absorption (Shear stress growth test)
Effect of sheeting 4.5.1 Introduction 4.5.2 Baking tests
4.5.3 Rheological measurements (Planar extensional flow test)
Chapter Five General Conclusions and Discussion
5.1
5.2
Conclusions
5.1.1 Small shear deformation test Effect of mixing
Effect of Water Absorption 5.1.2 Large deformation tests
5.1.2.1 Shear stress growth test
5.1.2.2 Planar extensional flow and extrusion tests 5.1.3 Effect of oil
5.1.4 Effect of resting time 5.1.5 Effect of sheeting
Discussions
5.2.1 Effect of Energy Input 5.2.2 Effect of Water Absorption
5.2.3 Effect of Resting Time 5.2.4 Effect of Sheeting
References
143
144
Rheological Properties of Wheat Flour Dough List of illustrations
LIST OF ILLUSTRATIONS
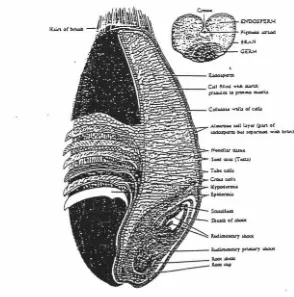
Fig. 2.1 A microscopic structure of the wheat kernel 8
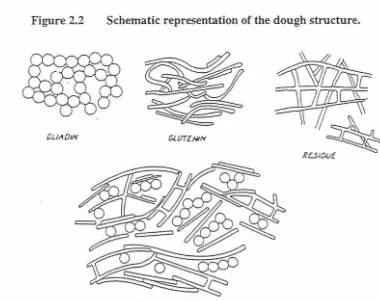
Fig. 2.2 Schematic representation of the dough structure 13
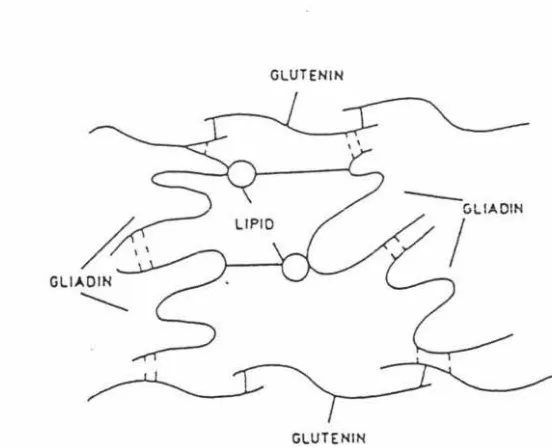
Fig. 2.3 Model of interactions of wheat protein in dough 13
Fig. 2.4 Possible location of lipids in the gluten network 14 Fig. 2.5 Possible location of lipids in the glutenin network 14
Fig. 2.6 Three stages of dough mixing 18
Fig. 2.7 A typical Mixograph of Bread dough 27
Fig. 2.8 A typical Farinograph of Bread Dough 28
Fig. 2.8 A typical Rheograph of Bread Dough 29
Fig. 2.9 A typical Alveograph of wheat flour dough 31
Fig. 2.11 A typical Extensograph of wheat flour dough 32
Fig. 2.12 Schematic view of shear deformation 34
Fig. 2.13 Schematic view of the geometry for an uniaxial compression test 40 Fig. 2.14(A) Schematic view of cross section of shear deformation set-up 42 Fig. 2.14(B) Diagram of the sheet deformation set-up with symbols used in the
equation 43
Fig. 3.1 A Mixograph of Bakers Flour 48
Fig. 3.2 A Mixograph of Soft Flour 48
Fig. 3.3 A Farinograph of Halo (weak) flour 49
Fig. 3.4 A Farinograph of Beta (strong) flour 49
Fig. 3.5 The 50-g MDD mixer 51
Fig. 3.6 A Hobart mixer 53
Fig. 3.7 The 1 kg MDD mixer 54
Fig. 3.8 Manual sheeter 55
Fig. 3.9 (a) Bohlin VOR rheometer 57
Fig. 3.10 The Instron 4500 Universal Test Machine Fig. 3.lla&b Planar Extensional test
Fig. 3.12 Fig. 3.13a Fig. 3.13b Fig. 3.14a Fig. 3.14b Fig. 4.1 Fig. 2.2a Fig. 2.2b Fig. 4.3 Fig. 4.4 Fig. 4.5 Fig. 4.6 Fig. 4.7 Fig. 4.8 Plate 4.1. Plate 4.2. Plate 4.3. Plate 4.4. Plate 4.5. Plate 4.6. Plate 4.7. Plate 4.8. Fig. 4.9a Fig. 4.9b
The Physica UDS200 rheometer
A Confocal Laser Scanning Microscope with its image system A Confocal Laser Scanning Microscope
A Cryostat Fast Deep Frozen Cutting Machine (Cutting Knife and Control Panel)
The Cryostat Fast Deep Frozen Cutting Machine
Strain sweep test, Physical UDS200, Bakers flour sandpaper Small deformation test, effect of gap in the G', Physica UDS200 Small deformation test, effect of gap in the
8,
Physica UDS200 Shear rate sweep test, Physica UDS200 Bakers flour, Std. Recipe Effect of shear strain in the relaxation modulus G, Bohlin VOR A typical 50g MDD Mixing Curve for Bakers flour dough A typical 50g MDD Mixing Curve for Soft flour dough Effect of mixing time (work input) on dough fermentationEffect of Work Input on the volume after 150 minutes fermentation
Microstructure of Non-mixing Bakers Flour Dough Microstructure of Under-mixed Bakers Flour Dough Microstructure of Optimal-mixed Bakers Flour Dough Microstructure of Over-mixed Bakers Flour Dough Microstructure of Non-mixing Soft Flour Dough Microstructure of Under-mixed Soft Flour Dough Microstructure of Optimal-mixed Soft Flour Dough Microstructure of Over-mixed Soft Flour Dough
Effect of work input (Bakers flour, dynamic oscillation test, G') Effect of work input (Bakers flour, dynamic oscillation test, 8)
Rheological Properties of Wheat Flour Dough List of illustrations Fig. 4.10 Fig. 4.lla Fig. 4.llb Fig. 4.12a Fig. 4.llb Fig. 4.13a Fig. 4.13b Fig. 4.13c Fig. 4.14a Fig. 4.14b Fig. 4.15a Fig. 4.15b Fig. 4.16a Fig. 4.16b Fig. 4.17 Fig. 4.18a Fig. 4.18b Fig. 4.19 Fig. 4.20 Fig. 4.21 Fig. 4.22 Fig. 4.23 Fig. 4.24 Fig. 4.25
Effect of work input (Soft flour, dynamic oscillation test, G' and o) 102 Effect of work Input (Bakers flour, shear stress growth test (Physica
UDS200 rheometer) 105
Effect of work Input (Bakers flour, shear stress growth test (Physica
UDS200 rheometer) 106
LIST OF TABLES
Table 3.1 Basic Parameters of wheat flours 50
Table 3.2 Parameters used for the Dynamid Oscillation Mode 56
Table 3.3 Parameters used for the Viscometry Mode 56
Table 3.4 Parameters used for Instron Instrument 63
Table 3.5 Basic Recipe of the Dough Samples 67
Rheological Properties of Wheat Flour Dough Chapter I Introduction
CHAPTER ONE
INTRODUCTION
1. Introduction
Among all cereals, wheat is the most abundant food crop worldwide. Wheat is commonly milled to wheat flour which could be further treated by other chemical methods depending on its utilisation. There are more than thousands bakery products using wheat flour as the main ingredient around the world. However, the most important use of wheat flour is for bread (Kokelaar, 1994). Due to its viscoelastic behaviour, which is not yet fully understood wheat flour doughs are complex systems that create great challenges in process engineering and product development research. Szczesniak (1988) gives the most striking definition of dough--'it is alive'--referring to its condition of a dynamic system continually changing due to physical and chemical factors.
Many scientists are interested in wheat flour dough rheology because wheat flour dough is unique and different from other flour doughs. Also, during breadmaking, dough undergoes different type of deformation in every phase of the conversion of wheat flour into baked products. During mixing, dough is subjected to extreme deformations that may exceed its rupture limit. During sheeting, fermentation, proofing, shaping and baking, the properties of wheat dough vary largely (Hoseney, 1986). All of these changes affect the final quality of baking products. If the rheological properties of wheat flour dough were fully understood it would facilitate quality control of baking products and improvement of the bread making
process.
affecting the rheological properties of dough. The relationship between rheological properties and baking performance still need to be researched.
Breadmaking is both a chemical and a physical process: chemical because of the formation of cross-links between protein chains by disulphide bonds. The action of oxidants, the reaction between different components in the dough and the transformation of sugars into carbon dioxide and ethanol by yeast, the development of flavours and the browning of the crust are also results of chemical reactions occurring during the breadmaking process (Janssen,
1995).
Breadmaking, however, can also be regarded as a physical process. Air bubbles are entrapped and subdivided in the dough mass during mixing. The composite material formed by the mixture of dough and air makes it be considered as a foam (Kokelaar, 1994). During fermentation and baking, yeast cannot produce new gas cells. That means that the mixing processing is a very important factor of the breadmaking process. In fact, the main purpose of the mixing may be considered as a process of entrapping air bubbles, enlarged it to a certain size during proofing, and keeping the holes to form a sponge-like structure towards the end of baking.
Viscoelastic properties of dough vary continuously during the baking processes as once the wheat flour is mixed with water and rested a strong gluten matrix is formed.
Viscoelastic properties of dough such as stiffness were usually measured by empirical methods. With the advance of new rheological instruments mechanical properties can be more quantitatively measured and viscoelastic properties can be determined. The meaning of these properties and how these can be measured will be described later in this thesis. Better knowledge of the viscoelastic behaviour of dough is necessary for quality control, improving processes such as baking or extrusion, and for elucidation of the interactions occurring among dough components (Navickis et al., 1982).
Rheological Properties of Wheat Flour Dough Chapter I Introduction
1.1 Background
Bread doughs is a viscoelastic material with explicit, non-linear shear thinning, thixotropic behaviour (Weipert, 1990) and strain hardening. The viscoelasticity of dough is a
result of the interaction between gluten proteins and water.
Wheat cultivars often differ in their breadmaking performances. Gluten proteins are largely responsible for these differences (Janssen, 1995). The breadmaking process, another important factor, also affects the quality of final products. The correlation between dough fundamental rheological properties and processing conditions (especially mixing intensity) is a key aspect to understand how quality of bread can be optimised and controlled. However, to understand rheological properties of bread dough and build up scientific methods to control the quality of bread is still the greatest challenge in the cereal science area (Szczesniak, 1988).
During breadmaking the mixing operation has two main functions: (1) mixing all the ingredients uniformly and (2) forming a viscoelastic dough which is necessary to form a loaf of bread. This process can be done automatically in short times using different levels of energy input. It is believed that mixing with different energy inputs can affect the final volume and structure of bread. In fact, many researchers and bakers have empirically proved this. But why and how do the things happen is not fully understood yet. The use of fundamental rheological properties may help to understand the basic behaviour and response of bread dough and will play an important role in the development of continuous automatic breadmaking processes.
Know ledge of basic principles on rheology and how is applied to other materials such as cheese and polymer will help to design new methods to determine rheological properties of dough and establish the links between dough performance and the breadmaking process. Unfortunately, although protein and polysaccharides are high-molecular-weight polymers, they are very different to polymers such as polyethylene, which is made up of a single monomer unit. The complexity of biopolymers makes rheological measurement more difficult
to carry out and interpret. Technologists and researchers have a good understanding of how to use empirical methods (e.g. Mixograph, Farinograph, Extensograph, etc) to determine the properties of the wheat flour dough and predict the quality of final bread which is commonly measured by carrying out baking tests. However, there is no a well-established correlation between empirical baking test and fundamental rheological properties. It is well known by bakers that wheat flour has to be mixed with water at an optimum work input to form a good visco-elastic dough. Empirical methods have shown that only the optimum mixed dough can provide a loaf of bread with good quality (both loaf volume and structure). Under mixed and over mixed dough can not provide bread with good quality. However, what's happening with the fundamental rheological properties when the wheat flour dough is mixed with different
work input or non-mixed is not fully understood.
Recently new rheological instruments have been developed. These rheometers can provide very small deformation to the sample. By measuring the stress and the deformation strain, these instruments can determine viscoelastic properties such as storage modulus G',
loss modulus G" and loss tangent 8. These instruments have been successfully used in studies related to the properties of polymers. For wheat flour dough, researchers ( eg Mani, et al. 1992) have started to carry out work but more information is still necessary.
Using fundamental rheology, researchers concentrated their effort on measurements of dough properties during mixing. By using an universal testing machine (Instron) and rheological equipment, considerable research has been carried out on fundamental rheological measurements of different dough flours. Some of the studies focused on the measurements of the rheological properties of dough prepared with different additives and water absorption, which were added into the flour dough to improve the quality of the bread or the production process (Kilborn, and Tipples, 1972). Weipert (1990) and Mani et al (1992) studied the effect of mixing conditions on dough behaviour.
Rheological measurements of dough are not very easy to be determined because of the
Rheological Properties of Wheat Flour Dough Chapter I Introduction
complex response of the bread dough at large deformations and the difficulties in setting up the measurement parameters. For small deformations, researchers mentioned that the dough
specimen would give a linear response at very small deformations (strain 2x10⁻⁴ - 2x10⁻⁵)
(Janssen, 1995; Mani, et al, 1992). Using dynamic rheometers, dough samples prepared with different mixing conditions can be tested under very small strain at different temperatures and resting times. It may be helpful to understand the properties of dough and build up links between industrial breadmaking and research work.
Another important tool to investigate the properties of dough is the microscope. The conventional microscopy needs considerable sample preparation which makes unsuitable for fresh dough. A new microscope, the Confocal Laser Scanning Microscope, is now available for microstructure research of food materials including dough.
1.2 The Objective of this research
Preliminary postgraduate research work (Zheng, 1997) showed that the rheological properties of dough measured at small deformations were not sensitive enough to differentiate doughs prepared with various mixing conditions. A biaxial compression test also did not show a significant difference between doughs prepared with different energy input. Improving measurement conditions such as elimination of slippage, reduction of temperature gradients and a better control of the sample resting time to improve reproducibility have been attempted in this project. Large deformation measurements including a shear stress growth test, a new planar extensional flow test and an extrusion test were included to measure the rheological properties of dough. In order to reduce slippage serrated and smooth plates coated with sandpaper were used for both small and large deformation. Other fundamental rheological measurements measured included shear stress relaxation.
Specific objectives of this work were the development of rheological and microscopical methods to study the effect of the following parameters on dough properties and
rnicrostructure:
•
Mixing Energy ( or Work Input)•
Type of flour•
Water Absorption•
Resting Time•
Oil Content•
Dough SheetingRheological Properties of Wheat Flour Dough Chapter 2 Literature Review
CHAPTER TWO
LITERATURE REVIEW
2.1 Wheat Flour and Wheat Flour Dough
Many types of wheat are grown around the world. A variety of methods for the classification of wheats have been developed. The three most important classification criteria are based on kernel texture (hard or soft), bran colour (red or white) and growth habit (spring or winter). Wheat is used for bread-type products for which strong elastic dough is needed. Other types of wheat are used to manufacture cookies, biscuits, crackers, cakes, or pasta. In general, the properties of wheat and its application depend on its texture which is controlled by a single gene (Bushuk, 1995).
Milling of wheat is accomplished by a gradual reduction system. In this system, wheat is ground on rolls and separated by sieving into many streams, each of which is generally ground again. The net result is a separation of the grain into its anatomical parts, i.e., pericarp, germ, aleurone, and endosperm. As a result of milling, the protein content of the resulting flour is reduced about 1 %, the minerals and vitamins are reduced, and essentially only starch is increased (Bushuk, 1995).
Usually wheat flours contain 70-80% starch, 8-15% protein, 11-14% moisture, 1.5-2.5% lipids, and a small content of minerals. Hard wheat flours tend to have higher protein content than soft wheat flours. Regarding the starch content, there is an inverse relationship between the amount of protein and starch (Janssen, 1995).
opaque. The cell structure of soft wheat is very weak and readily broken. Under a microscope, hard wheat flour appears to be quite hard and crystalline, whereas soft flour is quite "woolly" and not at all crystalline. In addition, the endosperm of soft wheat appears to adhere more strongly to the bran (Bass, 1988).
[image:23.564.164.458.338.635.2]There are a number of factors affecting the final quality of wheat flour during milling. They are wheat type, tempering, feed rate, and roll surface, roll speed, the presence of corrugation spirals, grinding pressure and roll temperature. Starch damage is a parameter frequently measured after milling in order to recognise differences between flour specifications because it can affect water absorption and gas production in fermenting doughs (Bass, 1988).
Figure 2.1
T..oc<du UQl.lc.dh K,?04cnllU qidcr.lW
:;.sz:...--~P,...,_,.
'-11----=~""
A microscopic structure of the wheat kernel
Rheological Properties of Wheat Flour Dough Chapter 2 Literature Review
mixing seems to be simple but various factors affecting the dough structure during mixing make the dough a complex system. A solid phase such as protein and starch, a liquid phase (water), and gas are all involved in the dough system. Different ingredients such as salt, sugar, yeast, fat oil, emulsifiers, oxidizing and reducing agents, and processing conditions such as temperature, resting time, and energy input to name a few, will also affect the system. For the sake of conciseness and organization each of these variables will be discussed separately.
2.1.1 Wheat Flour Gluten and its Components
There are five fractions of protein in the wheat flour: (1) albumin, soluble in water; (2) globulin, soluble in salt solutions; (3) gliadin, soluble in 70%(v/v) alcohol; (4) glutenin, soluble in dilute acid or alkali; and (5) a residual fraction, which is frequently considered to be part of glutenin (Janssen, 1995).
When flour-water dough is gently washed with an excess of water, a rubbery mass called gluten, can be obtained. Gluten is made up of two groups of proteins: gliadin and glutenin.
These are both complex mixtures of proteins. The gliadin, ranging from 30,000 to 100,000 Dain molecular weight, has been separated into some 50 different proteins. The outstanding characteristic of gliadin is that when isolated it is very sticky. They are apparently responsible for the cohesive property of gluten. The glutenin proteins are much larger than the gliadin, with an average molecular weight of about 3 x 10⁶ Da. Glutenin are physically resilient and not cohesive but rather short (not extensible). These proteins appear to give the gluten its elastic properties (Janssen, 1995).
hydrophobic interactions) between the protein fractions present in the gluten complex (Lasztity, 1996).
In practical terms, protein quality may be defined as the inherent ability of the flour protein for the production of bread. If two flours of the same protein content give different loaf volumes under optimised baking conditions, their proteins are said to be of different quality. The total amount of gluten protein in flour, the protein quantity, is also important. Normally, the flours with high gluten have a good bread making performance (Janssen, 1995). Janssen (1995) also reported that the ratio between gliadin and glutenin in the gluten from different wheat flour is an important effect on the breadmaking performance. Before of this finding researchers believed that no consistent relationship existed between the gliadin content of flour and its baking quality as judged by the loaf volumes obtained.
To explain the uniqueness of the protein in wheat flour, we should start with its amino acid composition. As is well known, proteins consist of about 20 different amino acids. Compared to other cereals, wheat gluten is unusual in that it contains a very large amount (35%) of glutamine. The neutral glutamine promotes hydrogen bonding because they can both accept and donate electrons (Hoseney and Rogers, 1990).
The next most abundant ammo acid in wheat gluten is proline (14%). One significant effect related to the presence of proline is that this amino acid has a ring structure. Therefore, the protein chain is not free to rotate around this position. In effect, the protein chain has a built-in link at each proline residue. Those links keep the protein from forming the type of three-dimensional structure that is typical for many proteins (Hoseney and Rogers, 1990).
Rheological Properties of Wheat Flour Dough Chapter 2 Literature Review 2.1.2 Wheat Starch and other Components
Wheat flour normally contains about 70%-80% starch. When wheat is milled into flour, starch granules are subjected to physical damage. Hard wheat flours usually contain higher damaged starch than soft wheat flours (Bushuk, 1995). The combined effect of starch damage and amylase activity is extremely important in determining the water absorption of flour. Normally, undamaged starch granules are relatively insoluble and absorb only half their own weight of cold water. Conversely damaged granules absorb considerably more water (twice their own weight).
Wheat flour also contains gums, water-soluble and water-insoluble pentosan. The water-soluble fraction of wheat flour has been shown to be important in producing an optimum loaf volume. The mechanism of its action is not clear but may be just an increase in the viscosity of the aqueous phase (Bushuk, 1995).
Lipids are also present in wheat flour. It is convenient to classify flour lipids into two groups, non-polar and polar lipids. The non-polar lipids are detrimental to loaf volume, whereas the polar lipids are beneficial. Bushuk (1995) mentioned that if flour can be defatted in a way that gluten is not damaged, the flour still produces a reasonable loaf of bread. However, if the lipids are added back to the flour, the bread volume increases. It is thought that polar lipids, particularly glycol lipids, were involved in this experiment (Bushuk, 1995).
2.2 The Structure of Wheat Flour Dough
From a colloidal point of view, dough is largely a continuous aqueous protein with dispersed phases of starch granules and air cells (Bohlin and Carson, 1980). There is a general agreement that gluten forms the framework of the dough structure. Starch is not simply a filler, but rather an active participant in determining the dough viscoelastic properties (Matsumoto, 1979). That means all of components of dough and added ingredients form a dynamic and complex system that contains air, free water, soluble components and insoluble solid material. This system is continuously changing once formed with various biochemistry and physical reactions happening during the whole process.
In order to understand the dough physical and rheological properties, is important to determine the interaction of gluten itself and with other components.
Although the idea that the dough structure based on three-dimensional network of protein subunits joined together by disulfide bonds seems to be phasing out and the role of other noncovalent binding, is being stressed there is no doubt that thiol groups and disulfide bonds play an important role in determining gluten and dough properties. Hydrogen bonds and hydrophobic interactions may also affect the rheological properties of dough.
Rheological Properties of Wheat Flour Dough Chapter 2 Literature Review
Figure 2.2 Schematic representation of the dough structure.
CLIAOW Gll/T£HIM
DOUGH Pl?DT[llr'S
[image:28.565.120.500.373.674.2]GLUTENIN
[image:29.565.168.444.424.648.2]GLUTENIN
Figure 2.4 Possible location of lipids in the gluten network (Lastztity, 1996)
GLUTENIN
GLUT[NIN
Rheological Properties of Wheat Flour Dough Chapter 2 Literature Review
2.3 Factors Affecting the Properties of Wheat Flour Dough
Bread doughs are viscoelastic materials. Viscoelasticity occurs because the gluten proteins are water compatible and thus in presence of water it will swell and interact each other. Doughs are also unique in the property of gas retention. This property appears to result from a slow rate of gas diffusion in the dough. The third major unique property of wheat flour doughs is their ability to set in the oven during baking, and thereby to produce a rigid loaf of bread. Although not clearly understood, this appears to be a heat-induced cross-linking of the gluten proteins (Hoseney and Rogers, 1990). Rheological properties of dough are very important "macroscopic" properties that can give a very good representation of the dough structure and how is affected by processing and ingredients.
2.3.1 Water Absorption
The amount of water that the baker add to a given weight of flour ( also known as water absorption) determines how much dough will be obtained and how stiff or slack the dough will be after mixing and, subsequently, at make-up. Dough consistency affects mixing time for optimum dough development. Slack dough containing more water takes longer to develop than stiff dough with less water, dough that contains too much water, and is too slack, causes problems during make-up, particularly at the dividing and moulding
stages.
The amount of water present in a wheat flour dough significantly affects both the rheological properties of the dough and the quality of the finished baked product (Abdelrahman and Spies, 1986: Hibberd 1970a, 1970b: Hibberd and Paker, 1975b; Navickis et al., 1982; Dresse et al., 1988).
Viscoelastic properties of dough can be described by an elastic response at short times and a viscous response at long times. The water content of doughs affects the dough viscoelastic behaviour during resting time. Dough optimally mixed, tested immediately and 30 minutes after mixed, showed that increased water absorption caused both the viscous and elastic responses of dough to change at different rates (Abdelrahman and Spies, 1986).
2.3.2 Dough Mixing Conditions
Dough mixing has two main purposes: uniform dispersion of ingredients into a homogeneous mixture, and adequate development of the gluten into a structure that has the necessary physical characteristics of pliability, elasticity and extensibility. These physical characteristics are collectively referred to as rheological properties. The mixing process may be separated in four distinct phases or steps: blending of ingredients, hydration of flour, development, and breakdown (Bushuk, 1995), all of which give different physical properties which may affect the final quality of bread.
When water is added to flour a sticky mass is obtained. It has been determined, with the aid of microscopy, that during mixing water hydrates the outside of the flour particles. Proteins form fibrils in excess of water, making the system viscous. With no mixing, the system changes very slowly. It takes time for water to diffuse into the dense flour particles. With mixing, however, the hydrated outer surfaces of the flour particles are stripped away, exposing a new layer of the flour particles to be hydrated. This continues until all the flour particles hydrate completely and disappear (Hoseney and Rogers, 1990).
Rheological Properties of Wheat Flour Dough Chapter 2 Literature Review
mixograph. At the beginning of mixing and during hydration of the flour an increase of the
dough consistency is observed. This is due to the formation of cross-linking and interaction
between proteins. After the hydration period the consistency of the dough reaches a maximum value (peak). The reason for this peak lies in the fact that after all the protein is fully hydrated further mixing produces de-polymerizition of the protein network formed
with the consequent decrease in dough consistency. That period, known as the breakdown
period, is dependent on the type of flour. Four different mixing levels can be considered:
i .
.
H'dD~
-I
·-1~·-I
·:- -.
-... '· . \
.. \ . .i.
Figure 2.6 Three stages of dough mixing
(a) Non-mixing dough
Non-mixing dough means under developed dough. However, it is different than that defined by many researchers as un-mixed dough and used to describe the process, in which
flour-water dough is mixed at a certain speed, stopped and remixed again. Non-mixing
temperature (-8°C) (Campos, et al 1996). The mixture is then slowly heated up to 32 °C without mechanical energy input. Non-mixing dough is a cohesive but undeveloped dough. The size of ice particles plays a very important role and may affect the hydration of wheat flour particles. This system provides a useful model system for the study of fundamental rheological properties of wheat flour dough. Non-mixing dough also could provide a means of comparing rheological properties of flours without considering the mixing energy as one of the variables.
(b) Under-mixed dough
This dough is mixed with a low level of mechanical energy input. Under-mixed dough produces a poor quality bread because the dough can not form a matrix that is able to retain gas bubbles during the fermentation process (Bushuk, 1982). If the dough is mixed initially at high mixing speed, then at low mixing speed, the dough produced can be under developed and is usually known as unmixed dough (Tipples and Kilborn, 1979). It is worth nothing that this concept is different than the one that will be used in this work to define under-mixed dough. In this work under-mixed dough is defined as the dough mixed with a low level of mechanical energy but constant speed.
(c) Optimal-mixed dough
Usually the dough is mixed up to the peak of the mixograph if the best quality bread is to be obtained. It is only after dough has been developed to its optimum point that the full breadmaking potential of that dough can be obtained. This is called optimum mixing. The mixing of dough at optimum conditions includes both the optimum water absorption and optimum energy input. To achieve optimum development of a dough, two basic requirements must be satisfied: Mixing intensity (impeller speed) must be above a minimum critical level that varies with both flour and mixer, and the work input to the dough must be at a critical amount dependent on the flour used (Kilborn and Tipples,
Rheological Properties of Wheat Flour Dough Chapter 2 Literature Review
(d) Over-mixed dough
Over-mixed dough means the dough is mixed to surpass the peak of the Mixograph, with a high-energy input exceeding the maximum requirements. If dough is over-mixed, its resistance to extension is decreased because disulphide bonds of the gluten proteins are broken and the gluten proteins are partially depolymerized. This results in greater solubility and lower viscosity (Hoseney, 1990). Over mixed dough does not have the ability of retain gas bubbles as well as optimally mixed doughs.
2.3.3 Temperature
Temperature, obviously, plays a very important role in the breadmaking process. The dramatic changes in the mechanical and rheological properties such as large increases in dough viscosity and elasticity at temperatures between 50 and 100 °C during baking are responsible in part, along with starch gelatinization, for the transformation from a predominantly viscous dough to a predominantly elastic baked crumb (Dreese et al., 1988a). Dreese et al. (1988b) also observed irreversible rheological changes due to the heating of dough to more than 55 °C. Elasticity of the dough increased rapidly between 55 and 75 °C. In general the ratio between the viscous and the elastic components drops significantly during heating in the range of 55-75 °C and the magnitude of the temperature-dependent rheological changes is proportional to starch content.
2.3.4 Resting Time
were reported by Piazza and Schiraldi (1997) and Watanabe et al (1998). Complex biochemical reaction and moisture loss make the dough hard to be tested. However, resting and its effect on rheological property measurement are a factor that needs to be studied and understood.
2.3.5 Fermentation of Bread Dough
Before bread dough can yield a light, aerated loaf of bread, it must be fermented for a sufficiently long time to permit yeast to act on available carbohydrates and convert them into alcohol and carbon dioxide as the principal end products.
The most apparent physical change during the course of dough fermentation is the steady increase in the volume of the dough mass. The dough expands four to five times its original volume before it recedes, assuming at the same time a light, spongy characteristic. The rheological properties of fermented dough are very difficult to determine because of the continuous change of dough properties with time. The fragility of fermented dough, which can be disturbed by very low stresses or deformations, makes very difficult the determination of its rheological properties.
It has been demonstrated that fermentation causes dough to become more elastic
(Cullen-Refai et al., 1988). As fermentation progresses, the ratio of elastic to viscous
components of the dough changes, with the elastic component becoming more dominant
(Hoseney et al., 1979; Hoseney, 1985).
2.3.6 Use of Additives
(a) Effects of Salt and Sugar
Rheological Properties of Wheat Flour Dough Chapter 2 Literature Review
(Bushuk, 1995). It also stabilises or regulates yeast fermentation and has a toughening effect on the gluten proteins. This, in tum, increases mixing requirements by as much as 10% to 20% (Bushuk, 1995). It has been also reported that increases in salt concentration produces increases in the dough elasticity (Abdelrahman, and Spies, 1986).
Sugar has a similar function than salt. Sugar can also be used as a substrate for the yeast. Usually sugar is added at levels of 0.5% to 1 %. Some bread may use more depending on the specification of the final product.
(b) Effects of Oxidizing Agent (Ascorbic Acid)
Ascorbic acid, an oxidising agent or improver, affects physical properties of dough, thereby improving loaf volume and crumb grain if it is added in appropriate amounts (Bushuk, 1995). Usually it was used in bread making in combination with potassium bromate in New Zealand. The use of potassium bromate has been discontinued due to safety considerations. Ascorbic acid makes the dough harder and elastic and also has a bleaching action. Normally it is used in concentrations of 10-100 ppm, depending on the breadmaking process and the flour utilised.
Potassium bromate was used m the past, and its fast-acting oxidant capacity increased the elasticity of the dough.
( c) Effects of Reducing Agent (L-cysteine)
Adding the thiol compound cysteine to dough reduces dough elasticity due to the blocking of disulphide bonds.
than a high-speed mixing process without cysteine. Frazier et al, (1975) found, using an Extensograph, that cysteine decreased the resistance and increased the extensibility of the dough.
As a reducing agent, L-cysteine is quite effective in shorten the m1xmg time. However, the dough can be mixed to breakdown quickly when too much L-cysteine is used, and good gluten would not be formed. (Bushuk, 1995).
2.3. 7 Effects of Emulsifiers, Oil and other ingredients
Lipids (both fat and oil) can be divided in two groups, polar and non-polar. The primary application of fats and oils is as lubricants. Fats and oils are also utilized for their unique ability to stabilize air cells in emulsions, fondants, and batters, thus providing a means of incorporating air into complex macromolecule networks and achieving desirable textural attributes in those products.
Researchers reported that lipids in wheat flour had little or no effect on the dough rheological properties. More-highly saturated fatty acids had little effect on Farinograph curves, and unsaturated fatty acids increased dough development times. Water-absorption is unaffected, and mixing tolerance was improved by adding non-polar or total lipids. Some researchers mentioned that adding up to 8% hydrogenated cottonseed oil, dairy butter, or lard significantly lowered water-absorption as measured by the Farinograph (Pomeranz,
1988).
Rheological Properties of Wheat Flour Dough Chapter 2 Literature Review
2.4 Sheeting
The sheeting of doughs is a commercially important unit operation in a wide variety of food processes. Repeated sheeting of under-developed dough results in its development (Kilborn and Tipples, 1974).
Basically, sheeting has the same function than mixing. The amount of energy necessary to develop dough by sheeting is about 15% of that required when the work is done by mixing (Levine, and Drew, 1990).
It was observed that the extractability of gluten increased, and the composition of the extracted gluten changed as the dough was processed, either by repeated passes through rollers or by decreasing the gap between the rollers (Levine, and Drew, 1990). Repeated sheeting results in the organization of a protein network within the dough. Excessive sheeting tended to break down this organization in the same way than overmixing does.
2.5 Evaluation of the Quality of Dough
Evaluation of bread quality and the dough that can produce it consists of two type of determinations (1) the volume of the bread and (2) structure of crumbs. The volume of bread is simply measured by a volume displacement technique whereas the assessment of the crumbs structure is highly subjective, and influenced by ethnic, cultural and personal preferences. The quality factors assessed and the standards applied may also vary with the type of bread being consumed. However, the ultimate measure of the quality of commercial breads must be the level of consumer satisfaction.
natural requirement to research the interrelationships among flour composition, added ingredients, process parameters and the characteristics of the loaf of bread (Szczesniak, et. al., 1983).
Through several hundred of years, bakers and researchers always wished to understand fully the principles and properties of wheat flour dough, but they do not completely understand the interactions involved in their formation or the factors affecting their properties, because dough is a difficult system to work with because exhibits both viscous and elastic behaviour. This viscoelastic behaviour tends to be non-linear. But many of the tests currently in use in bakeries are not based on fundamentally sound rheological principles (Spies, 1989). The difficulty of testing the basic rheological properties of a system as complex as wheat flour doughs largely explains the delay in the application of rheological principles in the bread making industry. The lack of adequate information on the rheological properties of doughs has forced bakers to rely on empirical measurements in quality control and research situations (Weipert, 1992).
Dough rheology research and empirical observations have enabled us to understand many events that take place during dough development. Dough development is the mixing of all ingredients into a homogenous mass. The bakery always hopes to shorten the production process time. Through a high-energy input, mechanical dough development (MDD) accelerates the process and sufficient gas retention is obtained by the mixing process and a short fermentation. The application of automatic machinery and computers is nowadays more and more common in the baking industry. Not only we need to accurate measure wheat flour dough parameters but also we need to set up methods to control and adjust the properties of the dough and the quality of final baked products.
Rheological Properties of Wheat Flour Dough Chapter 2 Literature Review established if we want to control the quality of bread in the future. Hopefully, an ideal tool, which is a simple and cheap apparatus, can help bakers to control the mechanical properties of the bread dough. The most important aspects of future research are to be able to transfer the results from fundamental measurements to practical tests in the bakeries. However, the first thing to be sorted out is to understand the changes of fundamental properties of the bread dough at the different production processing stages.
The flow and deformation behaviour of doughs is recognised to be central to the
successful manufacturing of bakery products.
Wheat flour dough is a complex composite biological material (Bloksma and Bushuk, 1988). In addition, controlled rheological measurements of wheat flour doughs are difficult and time consuming. Consequently, making reproducible measurements on dough is often a humbling experience. Despite the challenges, however, the progress in understanding flour and its biochemical components is obvious, as it is in the fields of colloid chemistry, rheology, polymer rheology, and instrumentation. Therefore, the challenge ahead is to use new technologies of these supporting sciences to increase our understanding of dough rheology.
The evaluation of dough in bakeries is very subjective as until today the consistency and physical properties of dough is tested by the operator using a " touch and feel approach". There are, however, empirical rheological methods used by the milling companies to determine the quality of the flours they are producing. This information is generally passed on to the bakers. Currently there is no much fundamental rheological methods used in the daily bakery operation. In general, methods to determine the rheological properties of dough can be classified in Empirical and Fundamental Rheological Methods. They are described below:
2.5.1 Empirical Rheological Methods
their contents of protein, ash, moisture, enzymatic activity, and in overall baking performance. It is essential for the baker to be aware of any changes that may have
occurred in these characteristics prior to placing flours into production. The purpose of individual flour tests is to disclose the specific property or character being tested for.
The intensive efforts over the past 60 years to arrive at an objective measurement of the rheological properties of wheat flour dough have resulted in the development of a number of precise and sensitive instruments that yield records of the mixing, water absorption, enzymatic activity, fermentation and oxidation characteristics of flours. The more widely used empirical testing methods can be divided into two broad categories: (1)
viscosity measuring instruments and (2) elasticity measuring instruments.
Most of the empirical rheological work made on doughs uses equipment that applies large deformations to the samples. These instruments, however, do not provide information regarding the sample's fundamental rheological properties, because the non-linearity of dough under such large deformations and because the deformation is not well
defined and uniform.
The advantages of empirical rheological testing, however, are:
• It is relatively easy and fast to perform. This makes it practical.
• It provides a great deal of heuristic knowledge, which has been accumulating over the past 50 years.
• The instruments needed to perform the tests are relatively inexpensive.
• Users do not require much training in physical sciences, since the methods are already established (Pyler, 1988).
Rheological Properties of Wheat Flour Dough Chapter 2 Literature Review
(a) Mixograph
The Mixograph is a miniature high-speed recording dough II11xer. A typical
Mixograph plot is shown in Figure 2.7. The plot illustrates the various empirical
parameters that can be determined from the curve. A Mixograph will provide a good
indication of the time required by flour to reach optimum dough development and will thus
differentiate between flours with short and long mixing times.
- - - B _ _ _ _.
...-- ,. - i
-A DOUGH ~El.OPWENT STAGE
..;._ _ _ _ _ 8 RAMO£ Or STABILITY
-C A!SSORPTION-P'flOTElN FACTOR lHE:lGfTl
---D
PEAKFigure 2.7 A typical Mixograph of bread dough
(b) Farinograph
The Brabender Farinograph has gained a wider acceptance in cereal laboratories
than any other experimental dough-testing instrument. The apparatus incorporates a
high-speed mixer and is designed to measure the resistance of the dough against a constant
mechanical shear. The instrument produces a real time graph that gives a visual record of
Figure 2.8 shows a typical Farinograph along with the principal empirical
parameters determined from the measurement.
WTI ->• av ~ E TlM(
'
-
·~r···
STAlll.lTT TIME 11.t ___,t••Figure 2.8 A typical Farinograph of bread dough
The dough development or peak time is an indication of protein quality, with
stronger flours normally requiring a longer development time than weaker flours. It also
reflects, to some extent, the level of water absorption used in the test. The stability time or
mixing tolerance is a primary index of flour quality and is one of the more significant
parameters measured by the Farinograph. All doughs eventually break on sustained mixing.
This phase is indicated in the farinograrn by the descending part of the curve. The sooner
this break occurs, the less fermentation and mechanical abuse the flour is likely to tolerate.
A heavy-duty version of the Farinograph, called the Brabender Do-Corder, is
available for estimating the performance of flours in continuous mixing and high-speed
Rheological Properties of Wheat Flour Dough Chapter 2 Literature Review
(c) Rheograph
The Rheograph represents an adaptation of a small-calibrated bench mixer provided with a three-pronged beater and a bowl. The mixer is housed in a cabinet with controlled temperature and humidity. Its beater is provided with a floating gear that is connected to a transducer that transmits its signal to the recording device. The flour-water dough is mixed until fully fatigued, i.e., unable to remain on the kneaded prongs. The time needed to reach this point gives a practical information about the flour's protein content, gluten quality,
water absorption, milling intensity, and optimum levels of ingredient usage. The device produces data that correlates flour composition with its baking performance. A typical Rheograph is illustrated in Figure 2.9.
28 26 2~. 22 20 18 16 14 12 . 10 8 6 2
Figure 2.9 A typical Rheograph of bread dough
( d) Mixatron
Attempts to determine dough consistency or to predict the absorption and mixing requirements of flour have generally followed two lines of approach. One is to use small recording dough mixers; e.g., the Farinograph or Rheograph described before, that yield
mixing curves from which valid conclusions regarding the practical mixing requirements of flour can be drawn. The other approach is to connect W attmeters to the mixer motor to measure the energy input into the dough. Wattmeters, however, are generally unsuited for measuring changes in dough consistency during the mixing cycle; they merely record or control the amount of energy required by the dough to achieve the optimum development. Changes in dough consistency that take place during the commercial mixer operation are recorded by using an apparatus known as the Paterson Mixatron. This is a precision electronic instrument that converts induced electric currents into watt-hour impulses. These impulses are then integrated into a single line curve that reflects the relative consistency of dough and plotted continuously against time. The chart, moving from left to right whenever the mixer is operated, provides an immediate record of dough consistency and the actual mixing time of each dough.
The advantages of the Mixatron include the following: (a) it simplifies the
determination of optimum absorption levels and mixing times of new flours; (b) it ensures uniformity; ( c) it permits a close control of the dough properties and hence to the maximum absorption capacities of the flour; and (d), it largely eliminates human and mechanical errors and failures in the mixer operation
( e) Alveograph
Rheological Properties of "Wheat Flour Dough
~ ; C 0 • - 0 c.
-5' ~
~.
: 3
t 3 C
3
p
Chapter 2 Literature Review
STANOAAD OJRVE
Average L
Figure 2.10 A typical Alveograph of wheat flour dough
The parameter of interest measured with the alveograph are the Peak force and the
extension to breakage indicated in the figure as P and L respectively
(f) Extensograph
Dough extensibility and resistance to extension can also be measured by the
Brabender Extensograph or Extensograph. A typical Extensograph along with the
::isoo1---,-,c..---+---~----(P
extensibility E
time
Figure 2.11 A typical Extensograph of wheat flour dough
(g) Baking Test
While the vanous physical and physicochernical flour testing methods provide
useful and often adequate information, it is ultimately the baking test the one that yields the
most reliable index to flour's potential performance in production. Since the baking test is
carried out under more or less standardised and controlled laboratory conditions, its results
must still be interpreted by taking into account the variables that normally are important into large-scale commercial production.
The type of test used will depend on a variety of factors. If the purpose of a baking test is to estimate the loaf volume and crumb grain potential of an unknown flour, then, as
Finney ( 1950) has amply demonstrated, both the test formula and mixing time must be optimised and balanced so that none of the added ingredients becomes limiting. If, on the
other hand, the aim of the baking test is to verify the uniformity of the flour and to evaluate
its suitability for production requirements of a bakery, to determine the effects of formula
changes, and/ or to test the efficacy of a new ingredient, a more standardised test baking
Rheological Properties of Wheat Flour Dough Chapter 2 Literature Review
2.5.2 Fundamental Rheological Methods
Rheology is defined as the study of the deformation and flow of matter. Deformation concerns to matter, which is solid, whereas flow to matter which is liquid. The rheological property of interest in solids is their elasticity whereas in liquids their viscosity. Foods, in general, cannot be categorised in a so clear-cut manner as solids and liquids.
From a rheological point of view, there are four different kinds of materials: (1)
liquids, (2) solids, (3) viscoelastic and (4) plastic. Liquids and solids deform irreversibly or reversibly respectively depending on the action of a force; plastics exhibit either liquid or solid behaviour depending on the magnitude of the applied force; and viscoelastic materials exhibit either liquid or solid behaviour depending mainly on the time during which the force is applied. Dough is a very classical example of a viscoelastic material.
In rheology it is more convenient to use stress and strain measurements rather than force and deformation or flow. Stress and strain for a component test are defined by equation (2.1) and (2.2).
Stress (cr)
Force F a = - - - =
Area A (2.1)
Strain (y)
Extension M.,
y = Original Strain
=
L (2.2)d.
. aa'
r=-=tana
ad
b
C
a.
r
I
c(
(2.3)
a.'
6'
r - - - , - - - - ,
C
Figure 2.12 Schematic view of shear deformation
In the simplest situation, stresses and strains set up are in one direction. However, it
should be apparent that, if the length increases, the cross-sectional area will decrease.
Therefore, stresses and strains will be set up in a direction at right angles to the main force.
If the material is prepared in the form of a thin wire, then the main stresses take place along
the wire, whereas, if the material is in the form of a cube, three-dimensional stresses will
occur. One-dimensional stress situation is much easier to handle than three-dimensional
situations. Thus, by careful choice of experimental conditions, the complex stress situation
can be simplified, enabling only one stress component to be considered.
Further definitions can be made by considering ideal materials. In an ideal solid
(Hookean) the resultant strain will be directly proportional to the stress placed on the
sample, but will be independent of the strain rate. Thus, for a solid material
cr = E y (2.4)
Rheological Properties of Wheat Flour Dough Chapter 2 Literature Review
For an ideal Newtonian liquid the stress will be proportional to the strain rate. Equation (2.5) can apply only for a shear deformation and the stress and strain are known as shear stress and shear rate.
.
cr=µy (2.5)
For the elastic solid, the energy used to deform the sample is totally recoverable, and when the stress is removed the sample will return to its original state. Conversely all the energy to deform the liquid is irreversibly lost.
(a) Small Deformation Test - Dynamic Measurements
Small Deformation Shear Tests or Dynamic measurements are used to determine rheological properties of viscoelastic materials. In this method the sample is either deformed or a stress applied using a sinusoidal varying waveform (either strain or stress) at deformations small enough to avoid the breakdown of the sample.
Assuming that a sinusoidal strain is applied
Wherero;
ro:
t:
y= Yo sin (rot)
amplitude of the strain
Angular frequency (rad/ sec) time (sec)
The resulting stress will be
't = 'to sin ( rot +3)
(2.6)
(2.7)
The phase angle or loss angle can be used to calculate two important viscoelastic
properties: the storage modulus G' and the loss modulus G" as:
G'(w)=
r
0cosc5 YoG" ( w) =
r
Osin
c5
Yo(2.8)
(2
.
9)
The ratio between the loss modulus and storage modulus 1s given by the following
equation.
G" ( m) tanc5 =
-G'(m) (2.10)
G' (storage modulus) is a measure of the sample elasticity, or energy stored in the
sample, during the deformation cycle, whereas, G" the loss modulus is a measure of
viscosity, or energy lost during the deformation cycle. The ratio of the moduli is a measure of the relative contributions of the viscous and elastic components to the rheological
characteristics of the sample and is expressed as the tangent of the angle by which the
stress and strain are out of phase:
In a purely elastic solid, stress and strain will be in phase, and in a purely viscous
fluid, stress and strain will be 90 degrees out of phase.
Viscoelastic properties of dough using small deformations have been studied by
several researchers. Faubion et al ( 1985) reviewed the results of these measurements. It was
Rheological Properties of Wheat Flour Dough Chapter 2 Literature Review
strain smaller than 2 x 10⁴ are needed to satisfy the requirement of linear viscoelastic behaviour.
The review of Faubion also details that water is the ingredient that has a major effect on the dough rheological properties. In general it was found that the increase of water content reduces the storage modulus but does not change the loss tangent. This would be indicating that water acts as a dilution rather than a plasticising agent.
A plasticiser agent would change the solid/liquid like behaviour of the dough,
which would be evidenced, by a change in the phase angle.
(b) Relaxation and Creep Tests
These tests, known as static tests, are commonly used to study the viscoelastic behaviour of food materials like dough and gain insight into their mechanical behaviour. These tests can use small and large deformations. Stress relaxation involves applying an instantaneous deformation to a body and keeping this deformation or strain constant throughout the test. The way that the resultant stress relax (or is alleviated) by the material is monitored as a function of time. Stress relaxation is commonly achieved by the use of a universal-testing machine by allowing the crosshead to compress the sample to a particular deformation, then stopping it. The constant strain is therefore maintained and the manner by which the sample attempts to alleviate the imposed stress is recorded. Stress relaxation can be performed under conditions of compression or tension. If rotational viscometers are used relaxation experiments under shear conditions can be used.