Ministry of Economic Affairs and
Communications
A Progress Report on the
Promotion and Use of Energy
from Renewable Sources
from the Republic of Estonia
to the European Commission
2
Contents
Summary ... 3
1. Introduction ... 4
2. Responses to template questions ... 5
2.1. Sectoral and overall share of renewable energy ... 5
2.2. Measures to increase the share of renewable energy... 9
2.3. Description of existing support measures... 11
2.4. Structuring of support schemes to take into account additional benefits ... 15
2.5. Description of the system for issuing guarantees of origin ... 15
2.6. Developments in the availability and use of biomass resources ... 17
2.7. Information on changes in commodity prices and land use ... 19
2.8. Biofuels made from wastes, residues, non-food cellulosic material, and ligno-cellulosic material ... 19
2.9. Environmental impacts of biofuel production ... 20
2.10. Greenhouse gas emission savings from renewable-energy use ... 20
2.11. Statistical transfers ... 22
2.12. Share of biodegradable waste in total waste used for generating energy ... 23
3 SUMMARY
This report has been drawn up in compliance with Article 22 of Directive 2009/28/EC, which requires member states to submit a report to the Commission on progress in the promotion and use of energy from renewable sources not later than by 31 December 2011, and every two years thereafter.
According to Directive 2009/28/EC, Estonia must ensure that the share of energy from renewable sources amounts to 25% of the gross final consumption of energy and 10% in the energy consumption of the transport sector in 2020. The activities aimed to achieve this are described in the Estonian National Renewable Energy Action Plan up to 2020 that was approved in government order No 452 of 26 November 2010.
This report covers the progress regarding introduction of renewable energy in 2009 and 2010. The report indicates that the developments regarding renewable energy in Estonia have been much faster than planned in the Estonian National Renewable Energy Action Plan up to 2020. The share of renewable energy considerably exceeded the expected gross final consumption of renewable energy in heating and cooling and electricity generation. The most significant contribution to increasing the share of renewable energy were the support mechanisms stipulated in the Electricity Market Act for CHP plants that generate electricity from renewable sources.
The share of renewable energy in the amount of final consumption turned out to be 104 ktoe (4.35 PJ; 1.21 TWh) in 2010, i.e. it was bigger than planned. The Estonian National Renewable Energy Action Plan up to 2020 predicted the share of renewable energy in final consumption to be 20.9% in 2010, but, in reality, it reached 24.0%.
According to the Estonian National Renewable Energy Action Plan up to 2020, the 2020 target amount of energy from renewable sources is 863 ktoe (36.1 PJ, 10.0 TWh). In 2010, the amount of energy produced from renewable sources reached 770 ktoe (32.2 PJ, 8.96 TWh).
4
1. INTRODUCTION
Article 22 of Directive 2009/28/EC requires member states to submit a report to the European Commission on progress in the promotion and use of energy from renewable sources by 31 December 2011, and every two years thereafter. The sixth report, to be submitted by 31 December 2021, shall be the last report required. This report has been drawn up to comply with the reporting obligation of the Republic of Estonia, as stipulated in the directive.
Member state reports are important for monitoring overall renewable energy policy developments and member state compliance with the measures set out in Directive 2009/28/EC and the national renewable energy action plans (NREAPs) of each member state. The data included in these reports will also serve to measure the impacts referred to in Article 23 of Directive 2009/28/EC.
The report has been drawn up using the relevant template prepared by the European Commission. The purpose of the template is to help ensure that member state reports are complete, cover all the requirements laid down in Article 22 of the directive and are comparable with each other, over time and with NREAPs submitted by member states in 2010. Much of the template draws on the template for the NREAPs1.
The template has completed in compliance with the definitions, calculation rules and terminology laid down in Directive 2009/28/EC and regulation (EC) No 1099/2008 of the European Parliament and the Council2.
In addition to Statistics Estonia and Eurostat, the information required for drawing up the report was submitted also by AS Elering, the Environmental Investment Centre, the Heat Pump Association of Estonia (an NPO), the Estonian Institute of Economic Research and others.
1
C(2009) 5174.
2
5
2. RESPONSES TO TEMPLATE QUESTIONS
2.1. Sectoral and overall share of renewable energy
1. Sectoral and overall shares and actual consumption of energy from renewable sources in the preceding 2 years (n-1; n-2; e.g. 2010 and 2009) (Article 22(1)(a) of
Directive 2009/28/EC).
Please fill in the actual shares and actual consumption of renewable energy for the preceding
2 years in the suggested tables.
Table 1: the sectoral (electricity, heating and cooling, and transport) and overall shares
of energy from renewable sources3
2009 2010
RES-H&C4 (%) 41.4% 42.6%
RES-E5 (%) 6.1% 10.4%
RES-T6 (%) 0.2% 0.2%
Overall RES share7 (%) 22.7% 24.0%
Of which from cooperation mechanism8 (%) 0% 0%
Surplus for cooperation mechanism9 (%) 0% 0%
Data sources: Eurostat and Statistics Estonia
The share of renewable electricity in the consumption of electrical vehicles in the transport sector was identified in compliance with Article 5(4)(c) of Directive 2009/28/EC. This article allows for using the average share of renewable electrical energy in the Community. Unfortunately, Eurostat and Statistics Estonia do not have one single factor required for calculating the renewable electricity used in the transport sector (the average renewable electrical energy amount used in the Community in the year n–2). According to calculations using the respective indicators (the 2007 indicator of 15.1288% for 2009, and the 2008 indicator of 16.3617% for 2010), the result should be 0.2% (0.187%, for 2009 and 0.173% for 2010), i.e. the share of renewable energy in the electricity consumption of the transport sector.
3
Facilitates comparison with Table 3 and Table 4a of the NREAPs.
4
Share of renewable energy in heating and cooling: gross final consumption of energy from renewable sources for heating and cooling (as defined in articles 5(1)(b) and 5(4) of Directive 2009/28/EC divided by gross final consumption of energy for heating and cooling. The same methodology as in Table 3 of NREAPs applies.
5
Share of renewable energy in electricity: gross final consumption of electricity from renewable sources for electricity (as defined in articles 5(1)(a) and 5(3) of Directive 2009/28/EC) divided by total gross final consumption of electricity. The same methodology as in Table 3 of NREAPs applies.
6
Share of renewable energy in transport: final energy from renewable sources consumed in transport (see article 5(1)(c) and 5(5)of Directive 2009/28/EC divided by the consumption in transport of 1) petrol; 2) diesel; 3) biofuels used in road and rail transport and 4) electricity in land transport (as reflected in row 3 of Table 1). The same methodology as in Table 3 of NREAPs applies.
7
The share of renewable energy in gross final energy consumption. The same methodology as in Table 3 of NREAPs applies.
8
In percentage point of overall RES share.
9
6
Table 1a: calculation table for the renewable energy contribution of each sector to final
energy consumption (ktoe)10
2009 2010
(A) Gross final consumption of RES for heating and cooling 643 682
(B) Gross final consumption of electricity from RES 47 87
(C) Gross final consumption of energy from RES in transport 1 1
(D) Gross total RES consumption11 691 770
(E) Transfer of RES to other member states 0 0
(F) Transfer of RES from other member states and 3rd countries 0 0
(G) RES consumption adjusted for target (D)–(E)+(F) 691 770
Gross final energy consumption12 3049 3215
Table 1.b: total actual contribution (installed capacity, gross electricity generation) from
each renewable energy technology in Estonia to meet the binding 2020 targets and the indicative interim trajectory for the shares of energy from renewable resources in electricity13
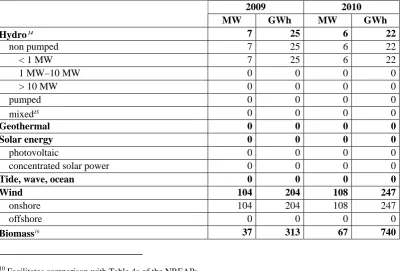
2009 2010
MW GWh MW GWh
Hydro 14 7 25 6 22
non pumped 7 25 6 22
< 1 MW 7 25 6 22
1 MW–10 MW 0 0 0 0
> 10 MW 0 0 0 0
pumped 0 0 0 0
mixed15 0 0 0 0
Geothermal 0 0 0 0
Solar energy 0 0 0 0
photovoltaic 0 0 0 0
concentrated solar power 0 0 0 0
Tide, wave, ocean 0 0 0 0
Wind 104 204 108 247
onshore 104 204 108 247
offshore 0 0 0 0
Biomass16 37 313 67 740
10
Facilitates comparison with Table 4a of the NREAPs.
11
According to article 5(1) of Directive 2009/28/EC gas, electricity and hydrogen from renewable energy sources shall only be considered once. No double counting is allowed.
12
Defined in article 2(f) of Directive 2009/28/EC.
13
Facilitates comparison with Table 10a of the NREAPs.
14
Normalised in accordance with Directive 2009/28/EC and Eurostat methodology.
15
In accordance with new Eurostat methodology.
16
7
solid biomass 35 306 63 730
biogas 2 7 4 10
liquid biofuels 0 0 0 0
TOTAL 148 542 181 1009
of which in CHP No data 229 No data 485
[image:7.595.66.476.68.139.2]Note regarding Table 1b. Identification of the respective (sub-)capacities is difficult for biomass because several fuels, including fossil ones, are usually used together. The given capacities are estimated ones, in proportion to the production volumes. CHP capacities have not been identified for the same reason.
Table 1c: total actual contribution (final energy consumption17) from each renewable
energy technology in Estonia to meet the binding 2020 targets and the indicative interim trajectory for the shares of energy from renewable resources in heating and cooling (ktoe)18
2009 2010
Geothermal (excluding low temperature geothermal heat in heat
pump applications) 0 0
Solar 0 0
Biomass 643 682
solid biomass 643 680
biogas 0 2
liquid biofuels 0 0
Renewable energy from heat pumps 0 0
of which aerothermal 0 0
of which geothermal 0 0
of which hydrothermal 0 0
TOTAL 643 682
of which DH 127 142
of which biomass in households 411 423
of which DH 19.7% 20.9%
of which biomass in households 63.9% 62.1%
Note regarding Table 1c. The data on heat pumps in Estonia are approximate and estimated. Thus, we decided not to enter the data on renewable energy from heat pumps into Table 1c yet. Based on the total installed capacity of heat pumps, which is 275 MW (an assessment of the Heat Pump Association of Estonia), the assessment of the average COP (SPF) of heat pumps, which is 2.7, and the (input) capacity factor, which is 0.106 (corresponds to 930 full-load operating hours a year), the estimated amounts of renewable energy from heat pumps were identified, as presented in the following table:
Renewable energy from heat pumps 29 37
of which aerothermal No data No data
17
Direct use and district heat as defined in article 5(4) of Directive 2009/28/EC.
18
8
of which geothermal No data No data
of which hydrothermal No data No data
Statistics Estonia uses data that are slightly different from the above. Its data are based solely on the data of the enterprises that are members of the Heat Pump Association of Estonia. It has been estimated that, in the period 1993–2010, about 47 500 heat pumps, including ca. 41 500 air heat pumps and ca. 6000 geothermal heat pumps, have been installed in Estonia (not only by the members of the Heat Pump Association of Estonia).
Table 1d: total actual contribution from each renewable energy technology in Estonia to
meet the binding 2020 targets and the indicative interim trajectory for the shares of energy from renewable resources in the transport sector (ktoe)19,20
2009 2010
Bioethanol/bio-ETBE 0.00 0.00
of which biofuels Article 21(2) 0.00 0.00
of which imported 0.00 0.00
Biodiesel 0.00 0.00
of which biofuels Article 21(2) 0.00 0.00
of which imported 0.00 0.00
Hydrogen from renewables 0.00 0.00
Renewable electricity 0.91 0.76
of which road transport 0.33 0.31
of which non-road transport 0.57 0.45
Others (as biogas, vegetable oils, etc.) – please specify
0.00 0.00
of which biofuels Article 21(2) 0.00 0.00
TOTAL 0.91 0.76
Note regarding Table 1d. Considering the fact that the table of the report must contain only the use of biofuels that meet the sustainability criteria and the regulation of the Minister of the Environment on environmental requirements for liquid fuels, the sustainability criteria for biofuels and the procedure for certifying compliance was issued on 22 December 2010, there are no data on the consumption of fuels stipulated in Articles 3(4) and 21(2). Statistics Estonia does not have such data, either.
However, when drawing up this report, we identified the consumption of biofuels, including liquid biofuels, in Estonia, but their compliance with the sustainability criteria has not been verified. The table below is based on the data from the Tax and Customs Board. Its data were used by the Ministry of Economic Affairs and Communications to draw up a report on the promotion of biofuels and other renewable fuels in transport to be submitted to the European Commission in compliance with Directive 2003/30/EC of the European Parliament and of the Council. The abovementioned report (see annex 1) was e-mailed to Commissioner Paul Hodson on 1 July 2011.
2009 2010
19
Take into account only those complying with applicable sustainability criteria, see article 5(1), last subparagraph, of Directive 2009/28/EC.
20
9
Bioethanol/bio-ETBE 0.10 4.56
of which biofuels21 Article 21(2) 0.00 0.00
of which imported22 0.00 0.00
Biodiesel 1.63 3.18
of which biofuels23 Article 21(2) 0.00 0.00
of which imported24 0.00 0.00
Hydrogen from renewables 0.00 0.00
Renewable electricity 0.00 0.00
of which road transport 0.00 0.00
of which non-road transport 0.00 0.00
Others (as biogas, vegetable oils, etc.) – please specify
0.00 0.00
of which biofuels25 Article 21(2) 0.00 0.00
TOTAL 1.72 7.74
2.2. Measures to increase the share of renewable energy
[image:9.595.61.399.69.257.2]2. Measures taken in the preceding 2 years and/or planned at national level to promote the growth of energy from renewable sources taking into account the indicative trajectory for achieving the national RES targets as outlined in your national renewable energy action plan (Article 22(1)(a) of Directive 2009/28/EC).
Table 2: overview of all policies and measures
Name and reference of
the measure measure* Type of Expected result**
Targeted group and or activity***
Existing or
planned**** Start and end dates of the measure
1. Investment support for wider use of sources of renewable energy in energy generation
Financial Generation of energy from renewable sources has increased
District heating enterprises
Existing From 24 March 2009
to 2012
2. Investment support for bioenergy generation
Financial Generation of energy from renewable sources has increased
Farmers Existing From 9 May 2008 to
2013
3. Investment support for adding value to forestry products
Financial Production of biofuels (pellets, wood briquettes, charcoal and wood chips) has increased
Microenterprises engaged in forestry and agriculture
Existing From 12 April 2010 to 2013
4. Investment support for electricity producers who use wind as a source of energy
Financial The installed capacity of wind farms and their production volumes have increased Electricity enterprises Existing (additional compared to the NREAP)
From 15 October 2010 to 2012
21
Biofuels that are included in article 21(2) of Directive 2009/28/EC.
22
From the whole amount of bioethanol / bio-ETBE.
23
From the whole amount of bioethanol / bio-ETBE.
24
From the whole amount of bioethanol / bio-ETBE.
25
10
5. Training sessions under activity 4.2.4 (NREAP) of the project to improve the administrative capacity of municipalities and their agencies with respect to coordination of energy efficiency activities Soft Administrative capacity of municipalities Municipality employees Ended 1.09.2008–31.01.2010
6. A thematic four-county related to wind energy26
Soft Faster processing of
wind farm plans in Western Estonian counties Investors, public administration agencies and planners Existing (additional compared to the NREAP)
02.2010–2013(?)
7. Devising legal bases for developing off-shore wind farms
Soft Legal bases for designing and erecting wind farms into bodies of water have been created Investors, public administration agencies and planners Ended 01.2010 8. Electrical mobility programme of Estonia
Financial Introduction of electrical cars and their charging infrastructure as well as introduction of electricity from renewable sources in the transport sector
Users of vehicles Existing (additional compared to the NREAP)
05.2011–2012
Notes on filling in the table.
* Indicate if the measure is (predominantly) regulatory, financial or soft (i.e. information campaign). ** Is the expected result behavioural change, installed capacity (MW; t/year), energy generated (ktoe)?
*** Who are the target audience: investors, end users, public administration, planners, architects, installers, etc.; or what is the targeted activity/sector: biofuel production, energetic use of animal manure, etc.?
**** Does this measure replace or complement measures contained in Table 5 of the NREAP?
2.a Please describe the progress made in evaluating and improving administrative procedures to remove regulatory and non-regulatory barriers to the development of renewable energy (Article 22(1)(e) of Directive 2009/28/EC).
The Ministry of Economic Affairs and Communications organised the drafting of legislative provisions for designing and erecting wind farms into bodies of water (Act Amending Water Act and Other Related Acts).
Within the SUPPORT_ERS27 project (2008–2010), where the Ministry of Economic Affairs and Communications also participated, producers of renewable energy and project developers were interviewed. The interviews did not reveal any unnecessary obstacles or non-proportional requirements with respect to implementing projects to introduce wind power and biomass.
For the first time in Estonia, there is a thematic plan for using wind power in four counties in Western Estonia underway. These counties are the best-suited to generating energy from
26
http://4maakonnatuuleenergia.hendrikson.ee/.
27
11
wind. The county plans to be established will create conditions for faster processing of individual projects.
The Ministry of Economic Affairs and Communications, in cooperation with Enterprise Estonia and the Estonian Biogas Association, reviewed the analysis of the factors restricting the use of biogas. Measures for solving the problems identified will be devised and presented to the public for discussion in 2012.
The Estonian Wind Power Association (the wind power cluster) analysed opportunities for using small generators in Estonia and made recommendations for erecting small wind-powered power-generators under the existing legislative acts, and made additional recommendations for improving the legislative acts.
With respect to geothermal energy, the Heat Pump Association of Estonia has established common internal norms for installing heat pumps.
State authorities (the Ministry of Economic Affairs and Communications, and the Estonian Competition Authority) have taken part in several discussions to solve disputes between market participants (e.g. disputes between developers and network operators). The discussions held so far do not indicate that Estonia needs quick changes in the administrative procedures stipulated in the existing legislative acts.
2.b Please describe the measures in ensuring the transmission and distribution of electricity produced from renewable energy sources and in improving the framework or rules for bearing and sharing of costs related to grid connections and grid reinforcements (Article 22(1)(f) of Directive 2009/28/EC).
According to the Electricity Market Act, a network operator provides network services, including connecting electrical installations to the network and transmission of electrical energy, to all market participants on an equal basis. Network operators have the right to refuse to provide network services only in cases stipulated in that act.
The network connection conditions have been stipulated in the government regulation establishing the grid code.
The bases for calculating network charges and coordination of the standard terms and conditions for network charges have been stipulated in the Electricity Market Act. Network charges are established taking into account the principle of equal treatment.
2.3. Description of existing support measures
3. Please describe the support schemes and other measures currently in place that are applied to promote energy from renewable sources and report on any developments in the measures used with respect to those set out in your national renewable energy action plan (Article 22(1)(b) of Directive 2009/28/EC).
12
replace a state aid notification in accordance with Articles 107 and 108 of the Treaty on the Functioning of the EU.
It is suggested that Table 3 be used to provide more detailed information on the support schemes in place and the support levels applied to various renewable energy technologies. Member states are encouraged to provide information on the methodology used to determine the level and design of support schemes for renewable energy.
Support for implementation of renewable sources of energy, making the energy sector more effective and ensuring the domestic energy security / adequate capacity is granted in compliance with Section 59 of the Electricity Market Act.
Support is granted for electricity that has been generated from renewable sources, from biomass in a cogeneration process, or in an efficient cogeneration process.
Pursuant to Section 591 of the Electricity Market Act, a producer who uses wind as the source of energy may receive support until the total amount of 600 GWh electricity is generated from wind power in a calendar year.
According to the Electricity Market Act, the support is paid by the transmission network operator, i.e. AS Elering.
The expenditure arising from funding the support is borne by consumers according to the volume of network services used and the amount of electricity consumed via a direct line.
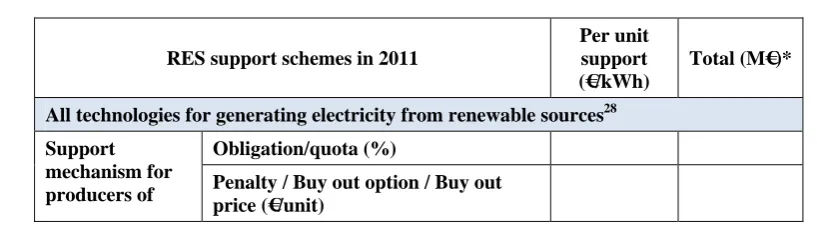
[image:12.595.88.497.522.635.2]The forecast of support to be paid in 2011 for electricity generated in an efficient cogeneration process and from renewable sources is EUR 57.5 million. The support foreseen for electricity generated from renewable sources is EUR 52.2 million and for electricity generated in an efficient cogeneration process, EUR 5.3 million. The renewable energy support is divided as follows: 35.0% goes to wind generators, 58.2% goes to electricity from biomass and 6.8% goes to electricity from hydropower, waste and black alkali.
Table 3: support schemes for renewable energy
RES support schemes in 2011
Per unit support (€/kWh)
Total (M€)*
All technologies for generating electricity from renewable sources28
Obligation/quota (%) Support
mechanism for
producers of Penalty / Buy out option / Buy out price (€/unit)
28
For the purposes of the Electricity Market Act, renewable sources of energy are water, wind, sun, waves, tides, geothermal heat, landfill gas, wastewater treatment gas, biogas and biomass, whereas biomass is the
13 Average certificate price
Tax exemption/refund
Investment subsidies (capital grants or loans) (€/unit)
Production incentives
Feed-in tariff
X Feed-in premium €0.0537/kW
h
52.2 electricity from
renewable sources, as stipulated in the Electricity Market Act (AS Elering)
Tendering
Wood chips in boiler houses
Obligation/quota (%)
Penalty / Buy out option / Buy out price (€/unit)
Average certificate price
Tax exemption/refund
Investment subsidies (capital grants
or loans) (€/unit) €37.1/MWh 7.434
Production incentives
Feed-in tariff
Feed-in premium
Support scheme for broader use of renewable energy sources for power production (Environmental Investment Centre) Tendering Wind power Obligation/quota (%)
Penalty / Buy out option / Buy out price (€/unit)
Average certificate price
Tax exemption/refund
Investment subsidies (capital grants or loans) (€/unit)
€328.5/MW
h 19.85
Production incentives
Feed-in tariff
Feed-in premium
Wind power investment support (Environmental Investment Centre) Tendering
Wood chips in boiler houses
Obligation/quota (%)
Penalty / Buy out option / Buy out price (€/unit)
Average certificate price
Tax exemption/refund
Investment subsidies (capital grants
or loans) (€/unit) €75.8/MWh 4.522
Production incentives Atmosphere protection sub-programme under the environmental programme (Environmental Investment Centre)
14
Feed-in premium
Tendering
Generation of electricity in efficient CHP plants
Obligation/quota (%)
Penalty / Buy out option / Buy out price (€/unit)
Average certificate price
Tax exemption/refund
Investment subsidies (capital grants
or loans) (€/unit) €0.032/kWh 5.3**
Production incentives
Feed-in tariff
Feed-in premium
Support to CHP plants for electricity generated in an efficient cogeneration process from waste, peat or oil-shale
processing retort gas or in an efficient cogeneration process by plants that have an electrical capacity of up to 10 MW (AS Elering)
Tendering
Total annual estimated support in the electricity sector 72.05
Total annual estimated support in the heating sector 11.956
Total annual estimated support in the transport sector No data
* The quantity of energy supported by the per-unit support gives an indication of the effectiveness of the support for each type of technology.
** The support is not taken into account in the annual gross support to the electricity sector.
3.1. Please provide the information on how supported electricity is allocated to final customers for purposes of Article 3(6) of Directive 2003/54/EC (Article 22(1)(b) of Directive 2009/28/EC).
The renewable energy charge is the additional cost, as determined in compliance with the Electricity Market Act, on support to electricity generated from renewable sources or in an efficient cogeneration process and supplied to the network.
The renewable energy charge is paid by all final customers of electricity in Estonia, and it is proportionate to the volume of network services they use. A power bill comprises four elements: the cost of electricity, network charges, renewable energy charge and state taxes (VAT and excise on electricity). The renewable energy charge is on a separate line on the power bill, so the customers can see exactly how much they pay for financing the support to electricity generated from renewable sources and in an effective cogeneration process.
The renewable energy charge is calculated by the transmission network operator in compliance with approved methodology and Section 59 of the Electricity Market Act. The charge is calculated on the basis of the estimated amount of the network services to be used and support to be paid for renewable energy in the following calendar year.
15
efficient cogeneration process in the following calendar year. Should the forecast of the amounts of electricity to be generated or sold change, the renewable energy charge will be changed as well.
Network operators pay the renewable energy charge received from electricity customers each month fully to the transmission network operator and do not ask for a service charge on this. The transmission network operator uses the renewable energy charge collected from all electricity customers to pay support to economic operators who generate electricity from renewable sources or in an efficient cogeneration process. Renewable energy support is paid on the basis of the amount of renewable energy generated.
2.4. Structuring of support schemes to take into account additional benefits
4. Where applicable, please provide information on how support schemes have been structured to take into account RES applications that give additional benefits, but may also have higher costs, including biofuels made from wastes, residues, non-food cellulosic material, and ligno-cellulosic material (Article 22 (1)(c) of Directive 2009/28/EC).
With respect to structuring of support schemes in Estonia, the following facts are worth mentioning:
1) The investment support that the Environmental Investment Centre offers under the support scheme for the wider use of renewable sources to produce energy are available to a narrower circle than the support offered under the Electricity Market Act. For example, in addition to the investment support, small CHP plants using biogas also receive operating support under the Electrical Market Act on electricity generated from renewable sources and supplied to the network;
2) Producers of wind power do not receive the support provided for in the Electricity Market Act if they have received investment support;
3) To use the electricity from renewable sources in the transport sector, Estonia has applied investment support for renewal of passenger trains and trams and introduction of electric cars.
2.5. Description of the system for issuing guarantees of origin
5. Please provide information on the functioning of the system of guarantees of origin for electricity and heating and cooling from RES, and the measures taken to ensure reliability and protection against system fraud (Article 22(1)(d) of Directive 2009/28/EC).
According to the Electricity Market Act, at the request of a producer, the transmission network operator will issue to the producer a guarantee of origin certifying that the producer generated electricity from renewable sources.
Conditions for issuing guarantees of origin:
• Producers may not subsidise generation from renewable energy sources at the expense of generation from other sources and vice versa.
16
month and what part of the electricity was sold under the purchase obligation stipulated in Section 59.
• If electricity is generated from a combination of renewable energy sources and other sources, the producer may, under the purchase obligation stipulated in Section 59 of the Electricity Market Act, sell only the amounts of electricity generated from renewable sources.
• The system administrator verifies whether the data in the applications submitted complies with the above conditions and, within no more than 30 days from the day the application was registered, issues a guarantee of origin certifying that the producer generated electricity from renewable sources.
Guarantees of origin of electricity generated from renewable sources set out:
• the name, address of the seat and details of the producer;
• the name of the energy source used for the generation of electricity and the place of generation;
• the amount of electricity generated in megawatt-hours, the period of generation, the time of generation in hours and the date of issue of the guarantee of origin;
• the amount of electricity in megawatt-hours, which is sold during the period specified in 581(4)3) of the Electricity Market Act by using the support or purchase obligation specified in Section 59 of that act;
• the capacity of generating installations if electricity is generated in a hydroelectric station;
• other information established by the transmission network operator.
Guarantees of origin of electricity generated in an efficient cogeneration process set out:
• the name, address of the seat and details of the producer;
• the lower calorific value of the fuel used;
• the manner of use of the heat energy generated;
• the amount of electricity generated in megawatt-hours, the period of generation, the time for generation in hours, the location of generation and the date of issue of the guarantee of origin;
• the amount of electricity in megawatt-hours, which is sold during the period specified in 581(4)4) of the Electricity Market Act by using the support or purchase obligation specified in Section 59 of that act;
• other information established by the transmission network operator.
• The system manager publishes information on the issued guarantees of origin on its website.
17
2.6. Developments in the availability and use of biomass resources
6. Please describe the developments in the preceding 2 years in the availability and use of biomass resources for energy purposes (Article 22(1)(g) of Directive 2009/28/EC).
18
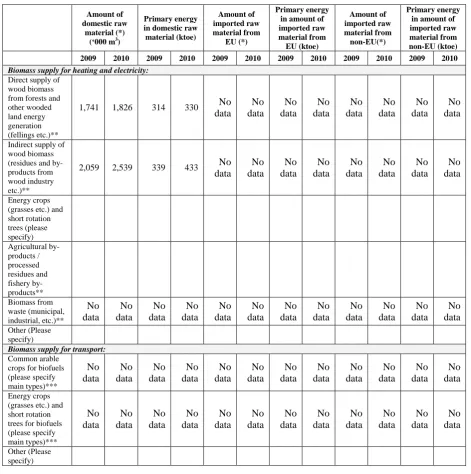
Table 4: biomass supply for energy use
Amount of domestic raw
material (*) (‘000 m3)
Primary energy in domestic raw material (ktoe) Amount of imported raw material from EU (*) Primary energy in amount of imported raw material from EU (ktoe) Amount of imported raw material from non-EU(*) Primary energy in amount of imported raw material from non-EU (ktoe)
2009 2010 2009 2010 2009 2010 2009 2010 2009 2010 2009 2010
Biomass supply for heating and electricity: Direct supply of
wood biomass from forests and other wooded land energy generation (fellings etc.)**
1,741 1,826 314 330 No
data No data No data No data No data No data No data No data
Indirect supply of wood biomass (residues and by-products from wood industry etc.)**
2,059 2,539 339 433 No
data No data No data No data No data No data No data No data Energy crops (grasses etc.) and short rotation trees (please specify) Agricultural by-products / processed residues and fishery by-products** Biomass from waste (municipal, industrial, etc.)** No data No data No data No data No data No data No data No data No data No data No data No data Other (Please specify)
Biomass supply for transport: Common arable
crops for biofuels (please specify main types)*** No data No data No data No data No data No data No data No data No data No data No data No data Energy crops (grasses etc.) and short rotation trees for biofuels (please specify main types)*** No data No data No data No data No data No data No data No data No data No data No data No data Other (Please specify)
Notes on filling in the table.
* Amount of raw material if possible in m3 for biomass from forestry and in tonnes for biomass from agriculture and fishery and
biomass from waste.
** The definition of this biomass category should be understood in line with Table 7 of part 4.6.1 of Commission decision C(2009)5174 final establishing a template for national renewable energy action plans under Directive 2009/28/EC
*** According to the information available to the Ministry of Economic Affairs and Communications, no biofuels for transport are produced in Estonia. Thus, there are no data on these.
The data presented in Table 4 are preliminary.
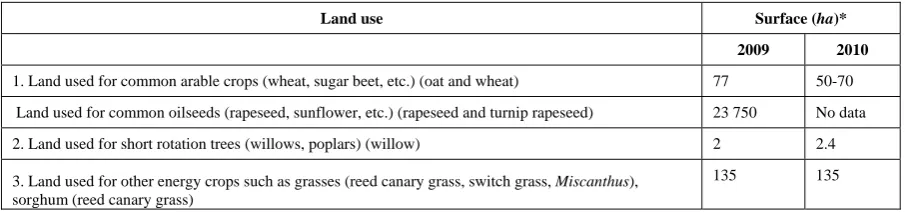
Table 4a: current domestic agricultural land use for production of crops dedicated to
19
Land use Surface (ha)*
2009 2010
1. Land used for common arable crops (wheat, sugar beet, etc.) (oat and wheat) 77 50-70
Land used for common oilseeds (rapeseed, sunflower, etc.) (rapeseed and turnip rapeseed) 23 750 No data
2. Land used for short rotation trees (willows, poplars) (willow) 2 2.4
3. Land used for other energy crops such as grasses (reed canary grass, switch grass, Miscanthus), sorghum (reed canary grass)
135 135
* Based on the data presented in applications for energy crop support, Estonian Institute of Economic Research.
2.7. Information on changes in commodity prices and land use
7. Please provide information on any changes in commodity prices and land use within your member state in the preceding 2 years associated with increased use of biomass and other forms of energy from renewable sources. Please provide, where available, references to relevant documentation on these impacts in your country (Article 22(1)(h) of Directive 2009/28/EC).
When assessing commodity price impacts, it is suggested to consider at least the following commodities: common food and feed crops, energy wood, pellets.
There have definitely been some impacts. For example, firewood has become more expensive because power plants are interested in using firewood to receive renewable energy support, and they actively purchase firewood for making wood chips. But the resulting high demand raises prices.
Housing expenses amount to 19% of a family budget, and housing expenses have increased by 7.9% in the last 12 months.
2.8. Biofuels made from wastes, residues, non-food cellulosic material, and ligno-cellulosic material
[image:19.595.72.525.70.177.2]8. Please describe the development and share of biofuels made from wastes, residues, non-food cellulosic material, and lingo cellulosic material (Article 22(1)(i) of Directive 2009/28/EC).
Table 5: production and consumption of Article 21(2) biofuels (ktoe)
Article 21(2) biofuels29 2009 2010
Production – Fuel type X (Please specify) 0 0 Consumption – Fuel type X (Please specify) 0 0 Total production Article 21(2) biofuels 0 0 Total consumption Article 21(2) biofuels 0 0 % share of 21(2) fuels from total RES-T 0 0
29
20
2.9. Environmental impacts of biofuel production
9. Please provide information on the estimated impacts of the production of biofuels and bioliquids on biodiversity, water resources, water quality and soil quality within your country in the preceding 2 years. Please provide information on how these impacts were assessed, with references to relevant documentation on these impacts within your country
(Article 22(1)(j) of Directive 2009/28/EC).
According to the information available to the Ministry of Economic Affairs and Communications, no environmental impact assessments regarding production of biofuels and their raw materials have been conducted in Estonia. No biofuels are produced in Estonia, and other agricultural activities are not known to have become more environment-intensive than usual.
2.10. Greenhouse gas emission savings from renewable-energy use
10. Please estimate the net greenhouse gas emission savings due to the use of energy from renewable sources (Article 22(1)(k) of Directive 2009/28/EC).
For the calculation of net greenhouse gas emission savings from the use of renewable energy, the following methodology is suggested:
• For biofuels: in accordance with Article 22(2) of Directive 2009/28/EC.
• For electricity and heat it is suggested to use the EU-wide fossil-fuel comparators for electricity and heat as set out in the report on sustainability requirements for the use of solid and gaseous biomass sources in electricity, heating and cooling30, if no later estimates are available.
[image:20.595.79.509.555.691.2]If a member state chooses not to use the suggested methodology for estimating the net greenhouse gas emission savings, please describe what other methodology has been used to estimate these savings.
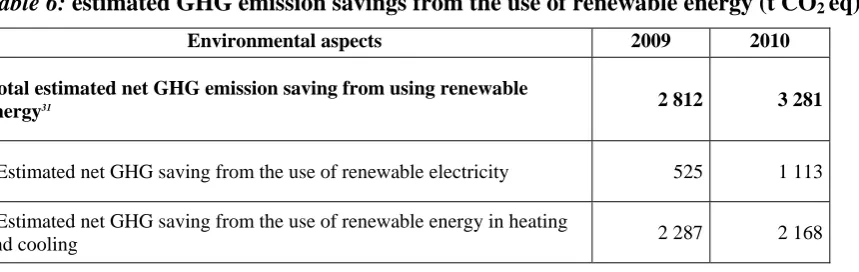
Table 6: estimated GHG emission savings from the use of renewable energy (t CO2 eq)
Environmental aspects 2009 2010
Total estimated net GHG emission saving from using renewable
energy31 2 812 3 281
- Estimated net GHG saving from the use of renewable electricity 525 1 113
- Estimated net GHG saving from the use of renewable energy in heating
and cooling 2 287 2 168
30
Report available on: http://ec.europa.eu/energy/renewables/transparency_platform/doc/2010_report/com_2010_0011_3_report.pdf.
31
21
- Estimated net GHG saving from the use of renewable energy in transport 0 0
All the data in Table 6 are approximate estimates and take into account only the direct CO2 -emissions.
No detailed calculation of GHG emission savings due to the use of energy from renewable sources has yet been conducted in compliance with the instructions of Directive 2009/28/EC. So far, Estonia has conducted no studies required for developing a method of assessment that takes into account the whole life cycle (or at least part of it) and the conditions prevalent in Estonia.
The preliminary data on the GHG emission savings presented in Table 6 have been calculated using simplified methods. Statistics have been used to calculate average emission factors for the fuel mix used for the production and final consumption of electricity and district heat: for final energy (kg CO2/MWh) with respect to electricity and heat and for input energy (fuel) (kg CO2/TJfuel) with respect to fuels used in final consumption. The calculations are based on the amounts of fuel used, their emission factors32 and data on the amounts of heat and electricity produced. Thus, the priority order for entering the electricity market has not been taken into account with respect to fossil fuels and the GHGs emitted during the life cycle have not been taken into account with respect to biomass.
In Estonia, most of the electricity (85% in 2010) is produced from oil shale, which emits large quantities of carbon when burnt – the specific emissions as carbon dioxide amount to 99.4 t CO2/TJfuel. As the efficiency of generating electricity from oil shale is low as well, the average specific emissions regarding electricity generated from oil shale are very high: 1085 kg CO2/MWhe. The emissions from oil shale in the total CO2-emissions from electricity generation amount to 94%. The emission factors for oil shale have been determined as weighted average ones, taking into account the two burning methods used: pulverised combustion and circulating fluidised bed combustion. As the share of other fuels used to generate electricity is rather small, the overall average specific emissions are high: 980 kg CO2/MWhe; it would be 1066 kg CO2/MWhe if only fossil fuels were taken into account.
The simplified approximate estimation using the above data indicates that the CO2-savings from the use of energy from renewable sources was 1.1 million tonnes in 2010. The respective indicator for heat generated in boiler houses and CHP plants is 595 000 tonnes. If all renewable fuels were replaced by fossil fuels in final consumption, the ratio of the latter remaining the same (based on energy value), the annual amount of CO2-emissions (based on the consumption in 2010) would be 1.6 million tonnes bigger than the actual amount.
32
22 2.11. Statistical transfers
[image:22.595.65.532.287.402.2]11. Please report on (for the preceding 2 years) and estimate (for the following years up to 2020) the excess/deficit production of energy from renewable sources compared to the indicative trajectory which could be transferred to/imported from other member states and/or third countries, as well as estimated potential for joint projects until 2020 (Article 22(1)(l–m) of Directive 2009/28/EC).
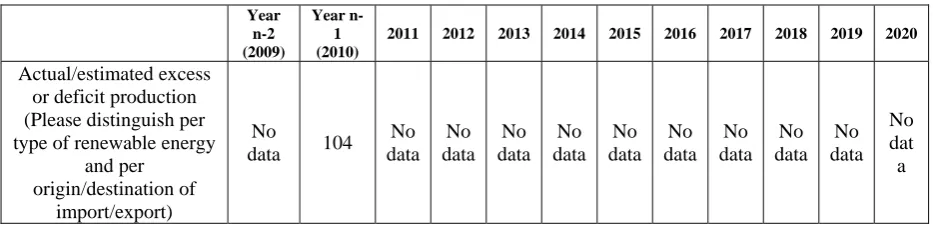
Table 7: Actual and estimated excess and/or deficit (–) production of renewable energy
compared to the indicative trajectory that could be transferred to/from other Member States and/or third countries in Estonia (ktoe)33,34
Year n-2 (2009)
Year n-1 (2010)
2011 2012 2013 2014 2015 2016 2017 2018 2019 2020
Actual/estimated excess or deficit production (Please distinguish per type of renewable energy
and per origin/destination of
import/export)
No
data 104 No data
No data
No data
No data
No data
No data
No data
No data
No data
No dat
a
Note on 2010 in Table 7.
The amount of biomass-heat consumption was 70 ktoe bigger than planned for 2010 in the National Renewable Energy Action Plan up to 2020, but the amount of renewable electricity was bigger by 34 ktoe.
11.1. Please provide details of statistical transfers, joint projects and joint support scheme decision rules.
So far, there are no detailed data on statistical transfers, joint projects and joint support scheme decision rules. However, Estonia has long-term established practices and experience in carrying out joint implementation projects under the Kyoto Protocol. According to the UNFCCC Secretariat, Estonia has implemented 12 joint implementation projects, most of which pertain to renewable energy35.
As there is no specific legislation stipulating procedural acts for organising a statistical transfer or joint project, these arrangements with member states or third states are governed by the Foreign Relations Act.
33
Please use actual figures to report on the excess production in the two years preceding submission of the report, and estimates for the following years up 2020. In each report the member state may correct the data of the previous reports.
34
When filling in the table, for deficit production please mark the shortage of production using negative numbers (e.g. – x ktoe).
35
23
According to Section 63(1) of the Government of the Republic Act, energy-related issues are included in the area of government of the Ministry of Economic Affairs and Communications, which organises the respective activities in Estonia.
Any further procedural aspects will be revised when further improving the legislative acts of Estonia in compliance with Directive 2009/28/EC.
The above procedures and criteria used as a basis for the use of statistical transfers or joint projects will be established after the analysis of additional information or receipt of instructions from the Commission.
2.12. Share of biodegradable waste in total waste used for generating energy
12. Please provide information on how the share for biodegradable waste in waste used for producing energy has been estimated, and what steps have been taken to improve and verify such estimates(Article 22(1)(n) of Directive 2009/28/EC).
2.12.1. Mixed municipal waste
The issue of estimating the share of biodegradable waste pertains mostly to the use of mixed municipal waste for generating energy. So far, mixed municipal waste has not been used for energy production in Estonia. However, the Iru CHP plant of Eesti Energia AS servicing the district heating system of the City of Tallinn has such a plan.
Estonia has regularly conducted studies on sorting of mixed municipal waste (the Ministry of the Environment has commissioned such a study after each two or three years36), and these provide a good overview of the share of biodegradable waste, i.e. the changes in the share. These data are a good basis for making any forecasts/estimates. These studies have been conducted periodically by independent research institutions; thus, the data are a reliable basis for estimates.
So far, Estonia has followed the example of southern regions and established plants that use biological and mechanical processing of waste to produce waste-derived fuel. The waste incineration plant is yet under construction. When the waste incineration plan will start operating, in addition to the two waste-derived fuel plants that already operate, the amount of waste landfilled will diminish.
In 2010, 11.7 million tonnes of waste was deposited in 15 landfills (59.6% of all the waste was landfilled).
The new energy block in the Iru Power Plant of Eesti Energia AS will be launched in 2013 and can incinerate up to 220 000 tonnes of mixed municipal waste a year. It will turn about 85% of the energy the waste contains into electricity and heat. The heat and electricity generating capacities of the new energy block are 50 MW and 17 MW, respectively. It is estimated that the biodegradable content of the mixed municipal waste to be used in the Iru Power Plant is about 60% by weight. This result was achieved by using a method (described below) widely used in the world.
36
Report available on the website of the MoE:
24
An analysis of the content of waste, i.e. a sorting study with a sampling period of one year, is conducted regularly (with an interval of 2 or 3 years) to identify the materials wastes contain. The calorific values of the materials are usually known (or can be identified if necessary); thus, the energy value of each constituent can be assessed as well.
Sorting studies are planned and conducted using various international waste analysis methods and standards as a basis. The abovementioned sorting study regarding mixed municipal waste was conducted on the basis of a plan that had been previously drawn up in compliance with the requirements stipulated in EVS-EN 14899:2006 standard (EN 14899:2005 – Characterisation of waste – Sampling of waste materials – Framework for the preparation and application of a Sampling Plan).
The sampling and analysis conducted during the latest sorting study of the Ministry of the Environment was in compliance with NT ENVIR 001: Solid Waste, Municipal: Sampling and Characterisation, a methodical guiding material of Nordtest. This guiding material describes the methodical steps for identifying the composition of municipal waste and wastes similar to that. This method can be used to analyse waste that contains components that can be easily reduced to ashes and components that can be manually sorted out of the ash. The method also provides instructions for preparing and organising sampling. In addition, D5231-92(2003): Standard Test Method for Determination of the Composition of Unprocessed Municipal Solid Waste, an ASTM standard, was used. This standard describes the procedures for analysing manual sorting of municipal waste that has not been pre-processed.
The latest sorting study of the Ministry of the Environment was conducted in four seasons, from October 2007 to August 2008. Samples were taken in landfills. Samples were taken from the cargo of garbage trucks of certain routes. The sampling and analysis took place in compliance with the methods recommended by international instructions/standards (Nordtest, ASTM).
The time for taking samples was set taking into account the following:
-the periods of sampling must coincide with climatic conditions typical to each specific season;
-the weeks following longer national holidays (Easter, Christmas, St. John’s Day) were avoided.
The areas investigated were within the service areas of the landfills. The areas were selected in a way that these would include various districts of bigger cities, small towns and rural areas. Furthermore, the analysis of the composition of waste also covered waste from regions where separate collection of waste had been well organised and regions where these arrangements were not good yet. Samples were taken from garbage trucks that arrived at landfills after collecting mixed municipal waste from specific routs. As samples were taken of the cargo of the same route in each season, the regions chosen had to have the same municipal-waste collection routes throughout the year. Thus, most of the areas studied were covered by an organised waste transport contract.
2.12.2. Waste wood and landfill gas
25
waste, the gas is considered to be fully generated from the biodegradable part of waste, i.e. landfill gas is 100 % renewable source of energy. Boiler houses and CHP plants use only the wood that waste contains, and this is also 100 % biodegradable and renewable source of energy.
2.13. Additional information to the first progress report
Please note that in the first progress report (2011 report) member states are invited to outline their intentions with regard to the questions addressed in Article 22(3)(a–c). In addition, member states are also welcome to provide any other information considered relevant to the specific situation of developing renewable energy of each member state.
Article 22(3) of Directive 2009/28/EC:
3. In its first report, the member state shall outline whether it intends to:
(a) establish a single administrative body responsible for processing authorisation, certification and licensing applications for renewable energy installations and providing assistance to applicants;
(b) provide for automatic approval of planning and permit applications for renewable energy installations where the authorising body has not responded within the set time limits; or
(c) indicate geographical locations suitable for exploitation of energy from renewable sources in land-use planning and for the establishment of district heating and cooling.
a) The Ministry of Economic Affairs and Communications is of the opinion that there is no need for new administrative bodies responsible for processing authorisation, certification and licensing applications for renewable energy installations and providing assistance to applicants because, according to the information available to the Ministry of Economic Affairs and Communications, the issue of activity licences is not a process that is unjustifiably and disproportionately complex for producers of renewable energy who plan new plants.
b) The Ministry of Economic Affairs and Communications is of the opinion that granting approvals to planning and activity licence applications automatically is not justified because planning is a long-term planning of spatial development, and it must take into account the long-term developments and needs of the economic, social, cultural and natural environment in a balanced way. Automatic approvals to plants producing renewable energy create imbalance in the process of planning spatial development.
Issue of activity licences is a process that is strictly regulated by legislative acts, and, according to the information available to the Ministry of Economic Affairs and Communications, no significant deviations from such regulation have been established for issuing activity licences to renewable-energy plants in Estonia.
c) There are 164 district heating areas in Estonia. In the systems of 36 of these, the ceiling for the heat price is higher than in the case of heat from electricity37. It is not
37
The state’s actions in ensuring the sustainability of heating supply, a 2011 report of the National Audit Office:
26
likely that lots of new district heating systems would appear in Estonia. From the perspective of developing the energy sector, district heating areas must be optimised in the upcoming years, so that the prices of district heating services provided to customers are competitive. Only with the help of sustainable district heating systems and measures to reorganise the district heating sector is it possible to ensure conditions that contribute to the development of the renewable energy sector.
Annex 1
R E P O R T
on the promotion of the use of biofuels or other renewable fuels for transport
ESTONIA 2010
DIRECTIVE 2003/30/EC OF THE EUROPEAN PARLIAMENT AND OF THE COUNCIL
on the promotion of the use of biofuels or other renewable fuels for transport, specifically its Article 4, stipulates that, by 1 July of each year, member states must submit to the
Commission a report that contains the following information:
– the measures taken to promote the use of biofuels or other renewable fuels to replace diesel or petrol for transport purposes,
– the national resources allocated to the production of biomass for energy uses other than transport, and
– the total sales of transport fuel and the share of biofuels, pure or blended, and other renewable fuels placed on the market for the preceding year. Where appropriate, member states shall report on any exceptional conditions in the supply of crude oil or oil products that have affected the marketing of biofuels and other renewable fuels.
1. Measures taken to promote the use of biofuels or other renewable fuels to replace diesel or petrol for transport purposes.
According to the Alcohol, Tobacco and Fuel Excise Duty Act, biofuels are exempt from excise duty until the end of the authorisation granted by the Commission.
Authorisation No 314/2005 for the exemption of biofuels from excise duty expires on 27 July 2011.
Estonia has not planned to apply for renewal of the exemption.
2. Renewable energy resources usable for producing energy in Estonia
The renewable energy potential of Estonia, especially in the form of wind power and cogeneration of electricity and heat from biofuels, has been described in the 2005 report.
27
3. Fuel consumption for transport in 2010
According to the preliminary data of Statistics Estonia, the amounts of fuel used for transport in 2010 were as follows:
Diesel – 426 000 t
Motor vehicle petrol – 275 000 t
More detailed statistics will be published in the September issue of Estonian statistics of Statistics Estonia.
According to the reports submitted, the amounts of biofuel (KN 3824 90 91 or 3824 90 99) to be used on their own or mixed with diesel, and biofuel (KN 2207 20 00) mixed with petrol, which were allowed to be used in Estonia in 2010 were 4 034 416 litres and 9 082 946 litres, respectively.
The share of biofuels in the gross petrol and diesel consumption (based on the energy value) is 1.76%.
The calculation is based on the following data:
diesel: energy value 43 MJ/kg;
petrol: energy value 44 MJ/kg;
ethanol: energy value 27 MJ/kg;
FAME: energy value 38.25 MJ/kg;
4. Other factors affecting entrance of liquid biofuels to the market
Within the climate package approved by the European Parliament on 17 December 2008, the directive on the development of the use of energy from renewable sources was approved as well. According to this renewable energy directive, each member state must compile a
renewable energy action plan that plans for activities to achieve the targets and milestones set by that directive.
The Estonian National Renewable Energy Action Plan up to 2020 and its implementation plan that were prepared in compliance with the directive were approved by government order No 452 of 26 November 2010. The action plan sets sectoral targets and plans measures to achieve these.
Prepared by: Ell-Mari Koppel, Energy Department, Ministry of Economic Affairs and Communications