David Duffy
Kieran McQuinn
Ciara Morley
Daniel Foley
Summer
2016
Quarterly Economic
Commentary
David Duffy Kieran McQuinn Ciara Morley Daniel Foley
Summer 2016
The forecasts in this Commentary are based on data available by 14 June 2016. Draft completed 14 June 2016.
Special Articles
The Commentary is edited by Kieran McQuinn and David Duffy. Kieran McQuinn is a Research Professor, David Duffy is a Senior Research Officer, and Ciara Morley and Daniel Foley are Research Assistants at the Economic and Social Research Institute (ESRI).
The Quarterly Economic Commentary has been accepted for publication by the
Institute, which does not itself take institutional policy positions. It has been peer reviewed by ESRI research colleagues prior to publication. The authors are solely responsible for the content and the views expressed.
© The Economic and Social Research Institute Whitaker Square, Sir John Rogerson’s Quay, Dublin 2
Table of Contents
Summary Table ... ii
National Accounts 2015, 2016, 2017 ... iii
CHAPTERS The Irish Economy – Forecast Overview and Summary ... 1
The International Economy ... 3
The Domestic Economy ... 15
General Assessment ... 36
Detailed Forecast Tables ... 42
APPENDIX Nowcasting Appendix ... 47
SPECIAL ARTICLES Cross Country Residential Investment Rates and the Implications for the Irish Housing Market ... 51
Summary Table
2013 2014 2015 2016 2017
Output (Real Annual Growth %)
Private Consumer Expenditure -0.3 2.0 3.5 4.0 3.5 Public Net Current Expenditure 1.4 4.6 -0.8 1.0 1.0 Investment -6.6 14.3 28.2 21.1 21.9
Exports 2.5 12.1 13.8 8.9 7.9
Imports 0.0 14.7 16.3 12.0 11.9
Gross Domestic Product (GDP) 1.4 5.2 7.8 4.6 4.2 Gross National Product (GNP) 4.6 6.9 5.7 4.8 4.3
Prices (Annual Growth %)
Consumer Price Index (CPI) 0.5 0.2 -0.3 0.8 1.0 Growth in Average Hourly Earnings -0.8 1.6 2.0 2.3 2.3
Labour Market
Employment Levels (ILO basis (000s)) 1,880 1,914 1,964 2,009 2,046 Unemployment Levels (ILO basis (000s)) 282 243 204 172 152 Unemployment Rate (as % of Labour Force) 13.1 11.3 9.5 7.9 6.9
Public Finance
General Government Balance (€ bn) -10.2 -7.6 -4.9 -2.3 -0.2 General Government Balance (% of GDP) -5.8 -4.1 -2.3 -1.0 -0.1 General Government Debt (% of GDP) 123.2 109.7 93.6 86.4 80.2
External Trade
Balance of Payments Current Account (€ bn) 5.6 6.8 9.5 11.0 6.8 Current Account (% of GNP) 3.1 3.6 4.4 4.8 2.7
Demand
Final Demand 0.9 9.4 11.9 8.3 8.3
National Accounts 2015
A: Expenditure on Gross National Product2014 2015 Change in 2015
€ bn € bn Value Price Volume Private Consumer Expenditure 89.0 92.4 3.8 0.4 3.5 Public Net Current Expenditure 27.2 27.9 2.3 3.1 -0.8 Gross Fixed Capital Formation 36.5 47.2 29.4 0.9 28.2 Exports of Goods and Services 215.0 260.6 21.2 6.5 13.8 Physical Changes in Stocks 1.9 2.7
Final Demand 369.6 430.7 16.6 4.1 11.9
less:
Imports of Goods and Services 180.3 215.7 19.6 2.9 16.3 Statistical Discrepancy -0.2 -0.2
GDP at Market Prices 189.3 215.0 13.6 5.5 7.7
Net Factor Payments -26.2 -31.7
GNP at Market Prices 162.9 183.1 12.4 6.4 5.7
B: Gross National Product by Origin
2014 2015 Change in 2015
€ bn € bn € bn %
Agriculture 3.4 3.4 0.0 1.0
Non-Agriculture: Wages, etc. 70.0 73.4 3.3 4.8
Other 68.4 88.8 20.4 29.8
Adjustments: Stock Appreciation -0.3 -0.3 Statistical Discrepancy 0.2 0.2
Net Domestic Product 141.9 165.6 23.7 16.7
Net Factor Payments -26.2 -31.7 -5.5 21.0
National Income 115.7 133.9 18.3 15.8
Depreciation 29.3 30.0 0.7 2.3
GNP at Factor Cost 145.0 163.9 18.9 13.1
Taxes less Subsidies 17.9 19.2 1.3 7.4
GNP at Market Prices 162.9 183.1 20.3 12.4
C: Balance of Payments on Current Account
2014 2015 Change in 2015
€ bn € bn € bn
X – M 34.8 44.9 10.1
F -26.2 -31.7 -5.5
Net Transfers -2.7 -2.9 -0.1
Balance on Current Account 5.9 10.4 4.5
National Accounts 2016
A: Expenditure on Gross National Product2015 2016 Change in 2016
€ bn € bn Value Price Volume Private Consumer Expenditure 92.4 97.0 5.0 1.0 4.0 Public Net Current Expenditure 27.9 28.5 2.4 1.4 1.0 Gross Fixed Capital Formation 47.2 59.0 25.0 3.2 21.1 Exports of Goods and Services 260.6 293.6 12.7 3.5 8.9 Physical Changes in Stocks 2.7 1.0
Final Demand 430.7 479.3 11.3 2.7 8.3
less:
Imports of Goods and Services 215.7 247.6 14.8 2.5 12.0 Statistical Discrepancy -0.2 -0.2
GDP at Market Prices 215.0 231.7 7.7 3.1 4.5
Net Factor Payments -31.7 -33.0
GNP at Market Prices 183.1 198.4 8.4 3.4 4.8
B: Gross National Product by Origin
2015 2016 Change in 2016
€ bn € bn € bn %
Agriculture 3.4 3.5 0.1 2.5
Non-Agriculture: Wages, etc. 73.4 76.8 3.5 4.7
Other 88.8 100.8 12.0 13.5
Adjustments: Stock Appreciation -0.3 -0.3 Statistical Discrepancy 0.2 0.2
Net Domestic Product 165.6 181.2 15.6 9.4
Net Factor Payments -31.7 -33.0 -1.3 4.2
National Income 133.9 148.2 14.2 10.6
Depreciation 30.0 30.0 0.0 0.0
GNP at Factor Cost 163.9 178.2 14.2 8.7
Taxes less Subsidies 19.2 20.3 1.1 5.6
GNP at Market Prices 183.1 198.4 15.3 8.4
C: Balance of Payments on Current Account
2015 2016 Change in 2016
€ bn € bn € bn
X – M 44.9 46.1 1.2
F -31.7 -33.0 -1.3
Net Transfers -2.9 -2.9 0.0
Balance on Current Account 10.4 10.2 -0.2
National Accounts 2017
A: Expenditure on Gross National Product2016 2017 Change in 2017
€ bn € bn Value Price Volume Private Consumer Expenditure 97.0 101.4 4.5 1.0 3.5 Public Net Current Expenditure 28.5 29.1 2.1 1.1 1.0 Gross Fixed Capital Formation 59.0 73.8 24.9 2.5 21.9 Exports of Goods and Services 293.6 325.5 10.8 2.7 7.9 Physical Changes in Stocks 1.0 2.0
Final Demand 479.3 531.8 11.0 2.4 8.3
less:
Imports of Goods and Services 247.6 282.2 14.0 1.8 11.9 Statistical Discrepancy -0.2 -0.2
GDP at Market Prices 231.7 249.6 7.7 3.3 4.3
Net Factor Payments -33.0 -34.4
GNP at Market Prices 198.4 214.9 8.3 3.8 4.3
B: Gross National Product by Origin
2016 2017 Change in 2017
€ bn € bn € bn %
Agriculture 3.5 3.6 0.1 3.5
Non-Agriculture: Wages, etc. 76.8 80.1 3.3 4.3
Other 100.8 113.8 13.0 12.9
Adjustments: Stock Appreciation -0.3 -0.3 Statistical Discrepancy 0.2 0.2
Net Domestic Product 181.2 197.6 16.4 9.0
Net Factor Payments -33.0 -34.4 -1.4 4.2
National Income 148.2 163.2 15.0 10.1
Depreciation 30.0 30.0 0.0 0.0
GNP at Factor Cost 178.2 193.2 15.0 8.4
Taxes less Subsidies 20.3 21.8 1.5 7.5
GNP at Market Prices 198.4 214.9 16.5 8.3
C: Balance of Payments on Current Account
2016 2017 Change in 2017
€ bn € bn € bn
X – M 37.5 33.2 -4.3
F -32.0 -33.0 -1.0
Net Transfers -2.7 -2.7 0.0
Balance on Current Account 2.8 -2.6 -5.3
The Irish Economy - Forecast Overview and Summary
Mainly due to domestic sources of growth, the Irish economy is still set to grow significantly in 2016. By May 2016 overall taxation receipts were up 9 per cent on the same time last year with income tax witnessing a 6 per cent increase over the same period. Between Q1 2015 and Q1 2016 total employment grew by almost 50,000. However, the weakening contribution of net trade to economic growth is underscored by recent high frequency economic data suggesting that the global slowdown in world trade may be impacting negatively on the Irish traded sector. Much of this is inevitably related to the lower economic growth rates being experienced in the US and the UK in 2016 compared with recent years.
Overall, reflecting the less than expected contribution from net trade, we have reduced our annual growth rates downwards marginally to 4.6 and 4.8 per cent respectively for GDP and GNP in 2016. Our outlook for 2017 remains unchanged from the Spring Commentary with output expected to grow by just over 4 per cent next year.
The slowdown in the UK’s economic performance is compounded by the uncertainty engendered by the upcoming ‘Brexit’ referendum. Most independent assessments of the implications of Brexit suggest an adverse outcome for the UK economy. This would have clear implications for the Irish economy which has seen the domestic economy benefit significantly from the UK’s strong post-2010 economic performance.
One aspect of the economic relationship between Ireland and the UK is explored in a Special Article in this Commentary by Davies, Siedschlag and Studnicka (2016). The paper examines the attractiveness of Ireland and other EU countries to foreign direct investment (FDI) and finds that Ireland and the UK are perceived to be similar as alternative locations for FDI, in particular, by investors from outside the EU and in the services sector. The analysis indicates that maintaining cost competitiveness in the domestic economy is particularly important for Ireland’s attractiveness to FDI.
European context and argues that in the absence of significant policy initiatives it will be a number of years before the domestic investment rate increases so as to meet the number of housing units currently required in the Irish economy. In its recommendations the paper echoes earlier research in the Winter Commentary by calling for the adoption of a site tax which incentivises landowners to release development land at a time when it is actually demanded.
The Programme for Government also calls for the presence of a vibrant banking sector with real competition in order to provide more choice to mortgage holders. It is likely however, that the recent legislation proposing to give the Central Bank of Ireland powers to regulate variable interest rates may act as a further disincentive to potential significant new entrants into the Irish market. It is likely that continued, and potentially greater, State involvement in the banking sector is acting as an impediment to increased competition being achieved.
The commitment given in the Programme for Government to adhere to all domestic and EU fiscal rules is highly important; while there is a generally acknowledged need to re-invest in key public services, it is also important that this would take place within the parameters of the agreed fiscal space. It is also important that any sustained increases in government expenditure or reductions in taxation would not cause the domestic economy to overheat, particularly given the continued strong expected economic performance.
The International Economy
Since the Spring Commentary there have been a number of revisions to real GDP growth predictions for Ireland’s main trading partners. In Spring it was forecast, using data from FocusEconomics, that Euro Area GDP would grow by 1.6 per cent in 2016 and 1.7 per cent in 2017. In the second quarter both figures have been revised downward, most notably the 2017 forecast. Amid growing global uncertainty the Euro Area is now forecast to grow by 1.5 per cent in 2016 and 1.2 per cent in 2017. In spite of the uncertainty regarding a British exit from the European Union, growth forecasts for the UK in 2016 and 2017 have been revised upwards since the Spring Commentary. Real GDP is now anticipated to grow by 1.9 and 2.2 per cent in 2016 and 2017 respectively. The US is expected to register the strongest growth of the three trading partners with a growth rate of just over 2 per cent anticipated in each of the next two years. This is unchanged from our expectations in Spring.
FIGURE 1 Real GDP Growth (% Change, Year-on-Year)
Euro Area United States United Kingdom
Sources: FocusEconomics, IMF, OECD, HM Treasury and Federal Reserve.
The Euro Area Economy
According to flash estimates from Eurostat, seasonally adjusted GDP rose by 0.6 per cent in the Euro Area and by 0.5 per cent in the European Union during the first quarter of 2016 compared to the final quarter of 2015. In the fourth quarter of 2015, GDP grew by 0.3 and 0.4 per cent respectively. Compared to Q1 2015, seasonally adjusted GDP rose by 1.6 per cent in the Euro Area and by 1.7 per cent in the European Union in the first quarter of 2016.
-2 -1 0 1 2 3 4
2012 2013 2014 2015 2016 2017 -2
-1 0 1 2 3 4
2012 2013 2014 2015 2016 2017 -2
-1 0 1 2 3 4
2012 2013 2014 2015 2016 2017
Euro Area inflation was -0.2 per cent in April 2016, down from 0.0 per cent in March and compares to a rate of 0.0 per cent in April 2015. Annual inflation in the European Union was also -0.2 per cent in April. Compared with March 2016, annual inflation fell in 13 Member States, remained stable in seven and rose in eight. In all, negative annual rates were recorded in 17 Member States.
Inflation forecasts for the Euro Area remain stubbornly low in spite of the mix of low or negative interest rates and quantitative easing. The European Commission forecast inflation of 0.2 per cent in 2016 is significantly below the European Central Bank’s (ECB) target of 2 per cent. In May the European Commission noted that high levels of public and private debt, vulnerabilities in the financial sector and declining competitiveness remain some of the biggest problems for the Euro Area. Similarly, a report published by the European Court of Auditors in April found that EU rules, which were tightened during the financial crisis, have not proved fully effective in reducing debts and encouraging reforms across the EU.1
The Commission believes that growth and inflation will remain weak unless governments complement the loose monetary policy with reforms of labour and product markets. Of course, while structural reforms may enhance growth prospects as noted by McQuinn and Whelan (2015)2 they will not, in themselves,
bring about sustained increases in European economic activity.
HICP inflation in April stood at -0.2 per cent on a year-on-year basis. The deceleration continues to be driven by low energy prices. Consumer price inflation excluding energy remains positive in 2016 ranging from 0.7 per cent recorded in April to 1 per cent recorded in both January and March. As noted in previous Commentaries, despite its drag on annual inflation, lower oil prices will continue to support domestic consumption growth through the positive impact on household personal disposable income.
In early June the ECB nudged up its expectations for growth and inflation in the Euro Area for 2016. It upgraded its Eurozone growth forecast to 1.6 per cent this year from the 1.4 per cent it predicted in March and maintained its forecast of 1.7 per cent for 2017.
In March the ECB cut its main interest rate from 0.05 per cent to 0 per cent in an attempt to further stimulate inflation across the Euro Area. The programme of quantitative easing also continues with a monthly bond-buying programme worth €80 billion. The ECB refrained from any further announcements of a stimulus
1 See www.eca.europa.eu/Lists/ECADocuments/SR16_10/SR_EDP_EN.pdf.
2 McQuinn, K. and K. Whelan (2015). ‘Europe’s Long-Term Growth Prospects: With and Without Structural Reforms’,
following their June meeting until the new measures have been given time to feed through to the real economy. As noted in the Spring Commentary the long-term effects of these strategies need to be considered. For example, ECB bond purchases are distorting the market for Eurozone government debt. It is expected that if the ECB’s bond-buying continues at its current rate, the ECB and national central banks will own over 25 per cent of the entire Eurozone government bond market by the first half of 2017.
The Euro Area seasonally adjusted unemployment rate was 10.2 per cent in March 2016, down from 10.4 per cent in February 2016 and from 11.2 per cent 12 months previous. This is the lowest rate recorded in the Euro Area since August 2011. In the European Union the unemployment rate was 8.8 per cent in March 2016 down from 9.7 per cent in March 2015. Amongst the Member States, the lowest rates in March 2016 were recorded in the Czech Republic and Germany, 4.1 and 4.2 per cent respectively. Compared with a year ago, the unemployment rate fell in 25 Member States and increased marginally in three. The fall in the overall rate continues to mask continued deep problems in individual Member States. Greece, for example, continues to have the highest unemployment in the Euro Area at 24.4 per cent. Similarly, Spain, which has enjoyed a recovery in economic growth, continues to struggle with a stubbornly high unemployment rate of 20.4 per cent.
The US Economy
Real GDP increased at an annual rate of 0.8 per cent in the first quarter of 2016, according to the second estimate released by the Bureau of Economic Analysis. In the fourth quarter of 2015, real GDP increased by 1.4 per cent. The upward revision to the first quarter GDP estimate, from 0.5 per cent, reflected a surge in spending on home building and a steady increase in inventory investment by businesses. However, it remains the weakest performance since Q1 2015.
Overall, the US economy continues to be squeezed by a strong Dollar, sluggish global demand and low oil prices. On a technical level, there are concerns that the model used by the US government to strip out seasonal patterns from data is not fully accomplishing its goals despite steps to address the problem in 2015. Slow first quarters followed by a rebound have been common in recent years. In Q1 2014, GDP was -0.9 per cent before jumping to 4.6 per cent in Q2. Similarly in the first quarter of 2015 GDP growth was 0.6 per cent with a jump to 3.9 per cent recorded in the second quarter. The ‘GNPNow’ model3 used by Federal Reserve
Bank of Atlanta, for example, forecasts real GDP growth in Q2 2016 of 2.9 per cent.
We noted this anomaly in the Summer Commentary in 2015 citing research from the Federal Reserve Banks of San Francisco and Philadelphia4 which both find
that, even after the Bureau of Economic Analysis performs seasonal adjustment in producing the National Accounts, there remains residual seasonality. In spite of this phenomenon we continue to believe that annual growth in the US will be 2 per cent in both 2016 and 2017.
Aside from the issues with seasonality there remain concerns for US growth levels given recent Purchasing Managers’ Index (PMI) data which suggest possible soft economic growth in the second quarter of the year. Markit’s flash services PMI estimate for May fell to 51.2 from 52.8 in the previous month while the flash manufacturing PMI for May stood at 50.5. On the index, a reading above 50.0 indicates expansion, below indicates contraction. Although services make up approximately 80 per cent of the US economy, manufacturing could act as a drag on second quarter growth.
Total non-farm payroll employment increased marginally by 38,000 in May leading to a small decline of 0.3 per cent in the unemployment rate to 4.7 per cent. Both the unemployment rate and the number of persons unemployed had changed little between August 2015 and April 2016 with the US adding roughly 200,000 new jobs per month for the past two years. These recent figures indicate that the US created the fewest number of jobs in more than five and a half years in May with the increase being the smallest gain since September 2010. Revisions to payroll counts from February to April have also been disappointing. Underscoring the weakness reported in May, employers hired 59,000 fewer workers in March and April than previously reported.
Aside from the official employment rate, also known as the ‘U-3’ number,5 other
metrics tend to provide a more nuanced view of employment. A broader figure is the U-6 rate, which is established as a more accurate portrayal of the employment situation. The U-6 rate is defined as all unemployed as well as persons marginally attached to the labour force, plus total employed part-time for economic reasons, as a percentage of the labour force. This means that the unemployed, the underemployed and the discouraged are all represented. As of May 2016 the U-6 rate in the US stands at 9.7 per cent, down from 10.7 per cent 12 months previous. Despite the improvement that government statistics shows,
4 Rudebusch, G. D., D. Wilson and T. Mahedy (2015). ‘The Puzzle of Weak First-Quarter GDP Growth’, Federal Reserve
Bank of San Francisco Economic Letter.
Stark, T. (2015). ‘First Quarters in the National Income and Product Accounts’, Federal Reserve Bank of Philadelphia Special Report.
the labour force participation rate remains sluggish with a fall 0.2 of per cent in May leaving the rate at 62.6 per cent. There is still no consensus on why the participation rate continues to fall.6
The Federal Open Market Committee (FOMC) is expected to announce another interest rate hike in the coming months, however, there is uncertainty regarding whether the hike will occur sooner rather than later in the year. The Federal Reserve chair acknowledged that the economy is continuing to improve despite the weak growth reported in the first quarter. Given the economic outlook, the FOMC has maintained the target range for the federal funds rate at 0.25 to 0.5 per cent. It also warned against raising interest rates too steeply as the Federal Reserve has limited tools to respond to another economic crisis.
The UK Economy
Gross Domestic Product in the UK is estimated, by the Office of National Statistics (ONS), to have increased by 0.4 per cent in Q1 2016 compared with growth of 0.6 per cent in Q4 2015. This is the thirteenth consecutive quarter of positive growth since Quarter 1 2013. Between Q1 2015 and Q1 2016, GDP in volume terms increased by 2 per cent, revised down 0.1 per cent from the preliminary estimate.
In Q4 2015 and Q1 2016, the number of people in work increased, the number of unemployed people was little unchanged, but the number of people not working and not seeking or available to work (economically inactive) fell. The current employment rate of 74.2 per cent is the highest since comparable records began in 1971. The unemployment rate was 5.1 per cent in Q1 2016, unchanged compared with the final quarter of 2015 but 0.5 per cent lower than a year earlier. Annual pay growth excluding bonuses slowed marginally to 2.1 per cent from 2.2 per cent in the three months through February 2016. Total pay inflation edged up to 2 per cent from 1.9 per cent over the same period.
Labour productivity remains very sluggish in spite of the employment and unemployment figures. UK labour productivity as measured by output per hour fell by 1.2 per cent from the third to the fourth quarter of 2015 and was some 14 per cent below an extrapolation based on its pre-downturn trend. By contrast, output per worker and output per job were both broadly unchanged between Q3 and Q4 2015. On all three measures, labour productivity was about one half per cent higher in Q4 2015 than in the same quarter of 2014. Sluggish productivity levels are more of an issue on the manufacturing side of the economy. Output per hour in services fell by 0.7 per cent on the previous quarter but was 1.1 per
6 Williams, J.C. (2015). ‘Dancing Days Are Here Again: The Long Road Back to Maximum Employment’, Federal Reserve
cent higher than Q4 2014 while output per hour in manufacturing fell by 2 per cent on the previous quarter and was 3.4 per cent lower than a year earlier. Despite some study in this area, as yet there is no consensus on the reasons behind this productivity puzzle.7
The Consumer Price Index (CPI) rose by 0.3 per cent in the year to April 2016, down from 0.5 per cent in the year to March and far below the target set by the Bank of England of 2 per cent. From late 2015, the rate began to increase gradually from close to zero. The drop in April 2016 is the first fall since September 2015. Inflation has been below 1 per cent since December 2014, providing respite for UK households as prices rise at a slower rate than pay following six years of real wage falls during the financial crisis. Core inflation, which strips out volatile energy and food prices, was also weaker than expected at 1.2 per cent, down from 1.5 per cent in March. It is likely that weak inflation will strengthen the case for the Bank of England to keep UK interest rates at an all-time low of 0.5 per cent.
The Bank of England’s Monetary Policy Committee (MPC) maintained a Bank Rate of 0.5 per cent and kept the size of the Asset Purchase Programme at £375 billion following their most recent meeting in May 2016. Given the likely persistence of the headwinds weighing on the economy, when the interest rate does increase it is likely that the Bank of England will do so more gradually than in recent cycles. The MPC clearly states that the most significant risk to their forecast is the Brexit referendum. A vote to leave the EU could materially alter the outlook for output and inflation and, therefore, the appropriate setting of monetary policy.
Polls continue to show a dead heat between the leave and stay campaigns. YouGov note that for most of the campaign their regular polls have shown little movement, with normal volatility around a race that appears to be neck-and-neck. Sterling’s value has become increasingly volatile as fears of Brexit have increased. The Sterling volatility index which charts the daily swings in the Pound’s value has risen to its highest level of volatility since the first quarter of 2009. It is also double the level seen in April 2016 when the remain campaign commanded a more prominent lead in the polls.
7 Riley, R., C. Rosazza Bondibene and G. Young (2015). ‘The UK Productivity Puzzle 2008-2013: Evidence from British
Businesses’, National Institute of Economic and Social Research, Discussion Paper, Number 450, 31 May 2015. Pessoa, J.P. and J. Van Reenan (2014). ‘The UK Productivity and Jobs Puzzle: Does the Answer Lie in Wage Flexibility?’, The Economic Journal, Vol. 124(576): 433-452.
Several studies have highlighted the negative impact that a potential Brexit could have on the UK, Ireland and the Euro Area. Armstrong (2016)8 and Portes (2016),9
for example, note that, if there were to be a Brexit, shifting to a free trade agreement would not be a minor matter. It would be uncharted territory, likely to result in significant changes to the structure of the UK economy, particularly in respect to the tradable services sectors. Additional research from the British Treasury10 documents that a movement towards an alternative trade model (e.g.
EEA or WTO) in the event of a Brexit would leave the UK permanently poorer, with productivity and GDP per person lower in all alternative scenarios.
The World Economy
Global growth forecasts for 2016 continue to be revised downward in light of increasing uncertainty and downside risks. In mid-2015, the International Monetary Fund (IMF) World Economic Outlook forecast growth in 2016 of 3.8 per cent. This was revised downward in their January 2016 forecast to 3.4 per cent. In their most recent April 2016 forecast the growth rate has been revised downward by a further 0.2 per cent to 3.2 per cent. The downward revision is the fourth straight cut in a year, putting world economic growth just marginally above last year’s 3.1 per cent and only 0.2 per cent above the rate the IMF has previously considered a technical global recession. The IMF cites the impact on emerging markets of China’s slowdown and weak commodity prices as the main reasons for the downward revisions but also acknowledges the negative impact from developed countries which are still struggling to escape the legacies of the financial crisis.
The key downside risks to global growth continue to be Brexit, emerging market economies (EMEs) financial vulnerabilities and increased financial market volatility. The ECB11 states that the slowdown in EMEs has been broad-based,
with growth in 21 of the 23 largest EMEs lower, on average, in the past three years than before the global financial crisis. Because EMEs play an important role in driving the global economy a stronger emerging market slowdown would therefore weigh on global and Euro Area growth. Weakness in the external environment together with moderating growth in China have dampened economic activity in EMEs as a consequence.
Data in the first six months of 2016 suggest continuing challenges for the Chinese economy. China’s official PMI for the manufacturing sector remained unchanged
8 See http://ner.sagepub.com/content/236/1/31.full.pdf. 9 See http://ner.sagepub.com/content/236/1/14.full.pdf. 10 See
www.gov.uk/government/uploads/system/uploads/attachment_data/file/517415/treasury_analysis_economic_impa ct_of_eu_membership_web.pdf.
at 50.1 in May – the third successive positive figure after seven months of contraction between August 2015 and February 2016. The PMI for the non-manufacturing sector remains above 50.0 in May 2016 but edged down marginally on the April figure. With export demand continuing to slow, the Chinese economy reported a fall in growth to 6.7 per cent in the first quarter of this year, from 6.9 per cent – its lowest in 25 years – in 2015. China has a growth target of at least 6.5 per cent for 2016.
The issues with China, EMEs, oil prices and a potential Brexit are also having an impact on stock market volatility globally. At the start of the year the S&P 500 had its worst start to a year since the Great Depression. While there was a marginal recovery in the following couple of months there has been a return to volatility in more recent weeks. In January, the S&P 500 was down as much as 11.3 per cent on the year while the CBOE Volatility Index (VIX)12 was above 32. At
the end of May, the stock index was down only fractionally on the year-to-date while the VIX lay around 17, up from the 12.5 recorded in April. Underpinning the uncertainty in 2016 has been speculation about the pace at which the Federal Reserve will raise interest rates. Stock markets globally, including Germany and Japan, have followed a similar trend in recent months.
For the first time since November 2015 the price of a barrel of oil broke through $50 in late May. Initial forecasts from the beginning of the year suggested that the price of Brent Crude oil would remain below $50 through 2016 amid a lack of oil supply and concern over the Chinese economy, the world’s second-biggest consumer of oil. A series of production outages from Canada and Nigeria in the past six months have helped to reduce the gap between supply and demand and, thus, increase the price. In early June, the Organization of the Petroleum Exporting Countries (OPEC) refrained from changing its oil output policy meaning no new production ceiling was agreed. Brent Crude oil prices dipped slightly to $48.95 in response to the news.
Implications for Irish Exports, Imports and the Balance of Payments
Imports and Exports data released by the Central Statistics Office (CSO) indicate a slowdown in the value of goods exports and imports in recent months. Figure 2 shows that there has been a slight dip in the value of both goods exports and imports in January, February and again in March. The reduction in exports in particular is partially a result of the relative appreciation of the Euro against Sterling since the start of the year as a result of increasing uncertainty regarding Britain’s future as a member of the European Union.
12 The CBOE Volatility Index (VIX) is a key measure of market expectations of near-term volatility conveyed by S&P 500
FIGURE 2 Seasonally Adjusted Goods Exports and Imports
Source: Central Statistics Office.
Looking at data for March 2016, the seasonally adjusted value of goods exports is €8,571 million compared to €8,752 million a month earlier, a change of -2.0 per cent. There has also been a decline in seasonally adjusted goods imports, falling by €619 million or 12 per cent over the previous month. Seasonally adjusted goods exports and imports figures are also down compared to March last year by 1.6 and 22.2 per cent respectively indicating that the global slowdown in trade may be beginning to impact Ireland. The resulting impact on the trade surplus was to increase it by €439 million or 12 per cent in the month to March 2016.
Breaking down goods exports into the relevant components, we see that medical and pharmaceutical products account for the largest proportion of goods exports at approximately 25 per cent. The values of medical and pharmaceutical exports did, however, decrease in the year to March 2016. In particular, there was a decrease of €299 million or 11 per cent compared to March 2015. Other notable changes include exports of electrical machinery, apparatus and appliances which increased by €320 million or 124 per cent and exports of office machines and automatic data processing machines falling by €69 million or 16 per cent. Looking at some of the changes in goods imports reveals that imports of organic chemicals decreased by €100 million or 26 per cent in the year to March. There was also a large drop in imports of machinery specialised for particular industries, falling by 65 per cent or €207 million. If we exclude the volatile component consisting of aircraft, we get a smaller decrease of 12 per cent in goods imports between March 2015 and March 2016.
0 2,000 4,000 6,000 8,000 10,000 12,000
€'
000
In Figure 3 we show the growth rates in the value of goods exports and imports for selected trading sectors. The slowdown in trade is evident from the Figure. While there are increases in certain sectors over the year such as exports of food and live animals increasing approximately 3 per cent, manufactured goods of 1.1 per cent and beverages and tobacco of 4.7 per cent, there are significant reductions in the value of certain imports. The Figure highlights the volatile nature of certain traded sectors of the economy. For example, a large proportion of the 30 per cent fall in the value of imports in the machinery and transport equipment category can be attributed to aircraft. As well as this, the volatility of the pharmaceutical industry is also highlighted with a 16.6 per cent decline in the value of imports in the chemicals and related products category. We also see a slowdown in trade if we look at high frequency indicators such as the PMI composite manufacturing index (Figure 4). The downward trend over the last number of months is evident and is another indicator that the overall growth rate in exports and imports may be lower in 2016 than previously thought.
FIGURE 3 Export and Import Growth in Selected Trading Sectors March 2015-March 2016 (%)
Source: Central Statistics Office.
In 2015, the Euro depreciated against the Pound, largely driven by the ECB’s quantitative easing program. This gave Irish exporters a significant competitive advantage in the UK. More recently, the Euro has appreciated against the Pound driven mainly by capital outflows surrounding Brexit uncertainty. This has already caused a decline in trade between Ireland and the UK. More specifically, between April 2015 and April 2016 the value of goods exports and imports has fallen by approximately 8.5 and 9.4 per cent indicating that some of the implications of Brexit are already starting to emerge.
-30.0 -25.0 -20.0 -15.0 -10.0 -5.0 0.0 5.0 10.0 15.0 20.0
Food and live
animals Beverages andtobacco related productsChemicals and goods classifiedManufactured chiefly by
material
Machinery and transport equipment
12%
25% 37%
3%
23%
Goods Exports
UK USA Other EU China R.O.W.
FIGURE 4 Purchasing Manufacturers Index (PMI)
Source: Markit.
The geographical breakdown of goods imports and exports (Figure 5) shows that the US and the UK are still our largest trading partners. The US accounts for about 25 per cent of our exports and approximately 14 per cent of our imports. Within the EU, Belgium accounts for the second largest proportion of goods exported largely as a result of activity in the pharmaceutical sector, which accounts for just over €1 billion of the €4,604 million total.
FIGURE 5 Seasonally Adjusted Goods Exports and Imports March 2016
Source: Central Statistics Office.
The outlook for services trade is less clear as most recent data only cover the period up to the end of 2015. Balance of Payments data for Q4 2015 indicated robust growth in services trade in 2015, with services exports increasing 15 per cent year-on-year. The majority of the growth was accounted for by growth in computer services of 17 per cent. There was also considerably more activity in the financial and business services, growing by 25 and 12 per cent respectively. Services imports also experienced strong growth over the same period, increasing
48 50 52 54 56 58 60 62 64 66
PMI new export orders Index PMI New Orders Index
25%
14% 37%
7%
18%
Goods Imports
by 20 per cent, largely as a result of increased activity in the royalties and licenses component.
The biggest risk to the domestic trade outlook remains Brexit, with a largely negative outcome expected if the UK chooses to leave the EU. Were Brexit to occur, in the short run the most significant effect would be increased exchange rate volatility due to capital leaving the UK driven by investor uncertainty.
The Domestic Economy
Output
The domestic section of the Commentary is organised as follows; we initially review the outlook for output growth before discussing developments in the Irish monetary and financial sectors. Prices and earnings in the economy are then discussed, followed by a review of demand-side factors such as consumption and housing market issues. On the supply side, we then examine developments in investment and the labour market before concluding with an analysis of the public finances.
We continue to believe that output in the Irish economy will grow significantly in both 2016 and 2017. As noted in the Spring Commentary, over the past year domestic sources of growth, investment and latterly consumption, have become increasingly central to Irish economic performance. The significance of the traded sector is expected to decline somewhat with net trade contributing negatively to growth in both 2016 and 2017. This marks quite a reversal from the earlier stages of the Irish recovery where net trade was the dominant factor.
High frequency data presented in the International section of the Commentary illustrate the degree to which the recent global slowdown in trade appears to be impacting on the export performance of Irish manufacturing and services firms. Therefore, we have modified downwards the contribution from the traded sector and have accordingly reduced marginally our growth forecast for 2016 to 4.6 and 4.8 per cent for GDP and GNP respectively. We continue to believe that the economy will grow by just over 4 per cent in 2017.
In Figure 6 we plot the annualised Nowcast and 1 quarter ahead forecast from the Nowcasting model since Q1 2015. This gives an indication of how the growth outlook for the Irish economy progressed through 2015 and into the first quarter of the present year. The chart suggests that, over this period, the Irish economy grew at its strongest rate in Q3 2015. It also suggests that, consistent with the high frequency trade data, the forecast outlook for the Irish economy is weakening albeit on a marginal basis.
FIGURE 6 Nowcast and 1 Quarter Ahead Forecasts (%) from the Nowcasting Model: 2015 Q1-2016 Q2
Source: ESRI Nowcasting model.
Notwithstanding the marginal decline in the Irish outlook Ireland continues to register the strongest growth across Europe in 2016 (see Figure 7) based on the latest EU Commission outlook for Euro Area states.
FIGURE 7 2016 GDP Forecast (%) For European Union Countries
Source: QEC forecasts (Ireland), EU Commission (the remaining).
0 1 2 3 4 5 6 7 8
2015Q1 2015Q2 2015Q3 2015Q4 2016Q1 2016Q2 Nowcast 1 Quarter Ahead
Monetary and Financial Conditions
The most recent Quarterly Financial Accounts for Q4 2015 released by the Central Bank shows a continuing improvement in household balance sheets. In particular, household debt decreased again in Q4 falling by €1.6 billion or 1.1 per cent. It now stands at €149.6 billion and represents a household debt per capita of €32,269. The fall reflects net debt repayments and debt write-downs/write-offs with a small positive contribution coming from reclassifications. This trend has emerged as a result of debt continuously declining for the last 29 quarters such that it now has fallen by 26.6 per cent since its peak of €203.7 billion in Q3 2008. The latest result marks the lowest level of household debt since Q1 2006.
Indicators of household debt sustainability also continue to improve with the latest Central Bank release. Debt as a proportion of disposable income fell over the quarter, from 159.8 per cent to 155.1 percent. This reflects both a decline in household debt as well as strong growth in annualised disposable income. As can be seen in Figure 8, the overall ratio of household debt has shown a marked improvement over the last couple of years and has fallen by 60.2 percentage points since its peak of 215.3 per cent in Q2 2011.
FIGURE 8 Irish Household Debt as % of GDP (2002-2015)
Sources: Central Statistics Office and Central Bank of Ireland.
Compared to other EU countries Ireland’s household debt position is still relatively poor, ranking the third highest among the EU,13 however, the
improvement in the Irish debt position in the last year has been the most significant. Over the year, Irish household debt fell by 21.5 percentage points while countries such as Spain and Portugal experienced declines in their debt positions of 6.1 and 4.6 percentage points respectively.
13 The high nature of Irish debt, while reflecting the relatively younger nature of the Irish population, is mainly
attributable to the credit-fuelled property boom between 2003 and 2007.
100 120 140 160 180 200 220
60 80 100 120 140 160 180 200 220
Another factor contributing to the improvement in household circumstances is the increase in household net worth. Over the quarter, household net worth increased by 1.4 per cent to €626.1 billion, or €135,078 per capita. This was largely driven by a rise in housing asset values as well as a decline in household liabilities. Comparing household net worth to the post-crisis low of €444 billion in Q2 2012 shows it has risen by 41 per cent since then. This is still 12.8 per cent lower than its pre-crisis peak of €718 billion in Q2 2007.
FIGURE 9 Growth in Lending to Irish Households (%)
Source: Central Bank of Ireland.
As can be seen from Figure 9 growth rates in lending to Irish households have been negative for the last few years following the crisis. We do, however, see that the growth rates in all three categories have become less negative over the last year. With the latest release of the data, growth in new lending to Irish households for consumption purposes has become positive for the first time since February 2009, albeit at a modest 0.3 per cent. This growth in lending along with the improvement in household net worth underscores the increase in personal consumption we expect to see in 2016 and 2017.
Total lending to Non-Financial Corporations (NFCs) declined by 5.5 per cent in annual terms in April. Decomposing total loans by maturity reveals a difference in trends between short-, medium- and long-term loans. Figure 10 shows growth in lending to NFCs. Short-term and long-term loans appear to still be experiencing negative growth as seen in the previous Commentary while medium-term loans of between one and five years continue their upward trend, growing in annual terms by 18.2 per cent in April.
- 30.0 - 20.0 - 10.0 10.0 20.0 30.0
FIGURE 10 Year-on-Year Growth Rate (%) of Lending to Irish Resident Non-Financial Corporations: January 2007-April 2016
Source: Central Bank of Ireland.
The Central Bank’s latest financial statistics release indicates that the majority of credit extended to NFCs is accounted for by small and medium enterprises. Given that many of these companies are indigenous, and given the relatively employment-intensive nature of these industries, increases in credit to SMEs has an important role to play in sustainable growth for the economy. Although the majority of credit is being extended to SMEs, it does not appear to be broadly based. In fact, the growth in credit extended to resident SMEs is negative for the majority of sectors. This negative annual growth in credit has been observed in the data since at least 2012 where nearly all sectors experienced negative growth rates. The latest data release shows that businesses within the information and communication sector, in particular, have been driving the pickup in credit over the last three quarters. If the pickup in credit became broader across a variety of sectors, we would likely see a further improvement in employment and the benefit to the economy would likely be much more robust and sustainable.
The mortgage arrears situation continued to improve in Q4 2015, according to recent Central Bank data. By December 2015, there were 746,618 private residential mortgage accounts for principal dwelling in Ireland with a total value of €101.6 billion. Of these, 88,292 accounts or 11.8 per cent were in arrears, a reduction of 4,069 or 4.4 per cent compared to the previous quarter. Figure 11 shows the proportion of mortgages in arrears of over 90 days and of over 180 days. A clear downward trend can be seen in both series from 2013 onwards with Q4 2015 data showing 61,931 or 8.3 per cent of accounts in arrears for over 90 days. This is the ninth consecutive quarter of decline and compares to 10.4 per cent in December 2014. A similar trend is observed for accounts in arrears of over 180 days. As of December 2015, 7.4 per cent of the total was over 180 days in
- 30.0 - 20.0 - 10.0 10.0 20.0 30.0 40.0 50.0 60.0 Ja n-07 Jun -0 7 N ov-07 Ap r-08 Se p-0 8 Fe b-0 9 Jul -0 9 De c-09 M ay -1 0 O ct -10 M ar -11 Au g-11 Ja n-12 Jun -1 2 N ov-12 Ap r-13 Se p-1 3 Fe b-1 4 Jul -1 4 De c-14 M ay -1 5 O ct -15 M ar -16
arrears, an improvement of approximately 1.8 percentage points compared to this time last year.
FIGURE 11 Select Mortgage Arrears Rates (%): Q3 2009-Q4 2015
Source: Central Bank of Ireland.
Across a number of sectors, the Irish economy appears to experience some of the highest interest rates in the Euro Area. If we compare interest rates on short-term loans against some of our European counterparts, the divergence becomes apparent. Across the Euro Area, interest rates charged by Irish credit institutions to both the household and the non-financial sector appear to be higher, on average, than rates charged in other countries. McQuinn and Morley (2015)14
noted the persistence of a ‘wedge’ or significant margin between the ECB policy rate and the standard mortgage variable rate (SVR) charged in the domestic market. This followed earlier work by Goggin et al. (2012)15 which had explored the issue in some detail. Newly available European cross country data16 (Figure 12 and Figure 13) highlight the high interest rate environment experienced by Irish customers.
14 McQuinn K. and C. Morley (2015). ‘Standard variable rate (SVR) pass-through in the Irish mortgage market: An updated assessment’, QEC Research Note, June.
15 Goggin J., S. Holton, J. Kelly, R. Lydon and K. McQuinn (2012). ‘The financial crisis and the pricing of interest rates in
the Irish mortgage market: 2003-2011’. Central Bank of Ireland Research Technical Paper 1/RT/12. 16 See www.euro-area-statistics.org.
0.0 2.0 4.0 6.0 8.0 10.0 12.0 14.0
FIGURE 12 Mortgage Interest Rates (%) on Home Loans Fixed up to 1 Year (New Business): 2012:01-2016:03
Source: www.euro-area-statistics.org.
FIGURE 13 Interest Rates (%) on Loans Fixed up to 1 Year to Non-Financial Corporate (New Business): 2012:01-2016:03
Source: www.euro-area-statistics.org.
For both lending to households and non-financial corporates, it would appear that Ireland’s interest rates are comparable only to Greece’s. In both cases, Irish rates would appear to be significantly higher than the Euro Area average and that, if anything, the margin or wedge between the two is actually increasing through time. 1.5 2 2.5 3 3.5 4 4.5 20 12-01 20 12-03 20 12-05 20 12-07 20 12-09 20 12-11 20 13-01 20 13-03 20 13-05 20 13-07 20 13-09 20 13-11 20 14-01 20 14-03 20 14-05 20 14-07 20 14-09 20 14-11 20 15-01 20 15-03 20 15-05 20 15-07 20 15-09 20 15-11 20 16-01 20 16-03
Germany Spain Greece Ireland Euro area
1.5 2.5 3.5 4.5 5.5 6.5 7.5 20 12-01 20 12-03 20 12-05 20 12-07 20 12-09 20 12-11 20 13-01 20 13-03 20 13-05 20 13-07 20 13-09 20 13-11 20 14-01 20 14-03 20 14-05 20 14-07 20 14-09 20 14-11 20 15-01 20 15-03 20 15-05 20 15-07 20 15-09 20 15-11 20 16-01 20 16-03
As can be seen from Figure 12, Spain has one of the lowest mortgage variable interest rates in the Euro Area; however, the mortgage market in Spain also has one of the shortest periods of foreclosure proceedings in Europe at less than one year. As noted by Aiyar et al. (2015)17 weak debt enforcement raises the legal cost of debt restructuring and hampers banks’ ability to seize loan collateral, reducing the expected recovery rate on delinquent loans. This ultimately may feed into higher interest rates. This potential relationship between the interest rates charged by financial institutions and the efficiency with which they can work through distressed loans is important in the domestic context.
Prices and Earnings
The annual change in prices was 0 per cent in May. Some of the most notable changes contributing to the annual change were transport at -5.3 per cent, furnishings, household equipment and routine household maintenance at -3.1 per cent and food and non-alcoholic beverages at -1.1 per cent. There were also increases in certain components such as miscellaneous goods and services of 5.6 per cent as well as restaurants and hotels of 2.1 per cent.
In the year to May significant upward contributions to the CPI came from miscellaneous goods and services at approximately 0.65 percentage points as well as from education of 0.1 percentage points. The largest downward contribution to CPI growth over the year came from transport, largely as a result of lower fuel prices. Figure 14 shows the annual growth in the main headings of the CPI.
17 Aiyar, S., W. Bergthaler, J. M. Garrido, A. ILyina, A. Jobst, K. Kang, D. Kovtun, Y. Liu, D. Monaghan and M. Moretti
FIGURE 14 Annual Growth of Main CPI Headings May 2016 (%)
Source: Central Statistics Office.
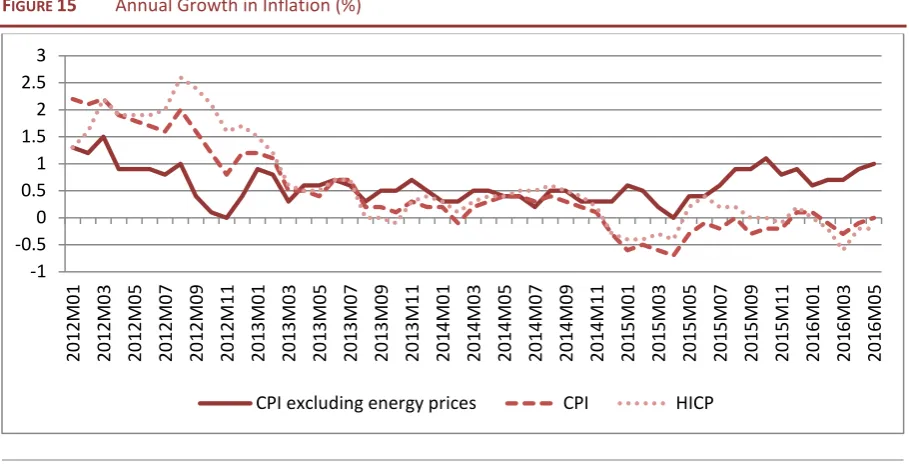
Energy prices are still exerting a significant drag on inflation. From Figure 15 we can see that the growth in CPI excluding energy prices has been consistently higher and positive for much of 2015 and 2016.
Energy continues to contribute negatively (-0.89 percentage points) to the growth rate in inflation, as seen in Figure 14. As well as the contribution of energy, we can see the respective effects that mortgage interest rates are having and also the contribution of goods and services. We see that over the year, goods and services have had opposing effects on the headline rate. Goods have had an overwhelming negative impact on inflation in part driven by lower commodity prices as a result of low world demand while price growth in services was positive at 1.48 per cent. It is informative to decompose CPI into its relative components as the headline rate can mask the true evolution of prices over time. In order to highlight this we provide a decomposition of CPI growth into growth in goods prices and services prices over time.
-1.50 -1.00 -0.50 0.00 0.50 1.00 1.50
FIGURE 15 Annual Growth in Inflation (%)
Source: Central Statistics Office.
Figure 16 shows the decomposition and we observe that there has been a diverging trend in the evolution of prices in the goods and services components since 2014. The goods component has been consistently negative over the period which is acting as a drag on inflation. At the same time there has been consistently strong growth in the services component. As of May 2016, the annual rate of growth in the goods component was -3.3 per cent while the comparable growth for the services component was 2.6 per cent.
The annual rate of growth in the EU Harmonised Consumer Price Index (HICP) was also negative for year to date. Most recent data show that the growth rate was -0.2 per cent in May when compared to May 2015. Some notable changes include a fall in transport of 5.7 per cent, a fall in clothing and footwear of 1.2 per cent as well as increases in education of 3.8 per cent and restaurants and hotels of 2.2 per cent.
-1 -0.5 0 0.5 1 1.5 2 2.5 3 20 12M 01 20 12M 03 20 12M 05 20 12M 07 20 12M 09 20 12M 11 20 13M 01 20 13M 03 20 13M 05 20 13M 07 20 13M 09 20 13M 11 20 14M 01 20 14M 03 20 14M 05 20 14M 07 20 14M 09 20 14M 11 20 15M 01 20 15M 03 20 15M 05 20 15M 07 20 15M 09 20 15M 11 20 16M 01 20 16M 03 20 16M 05
[image:32.595.71.526.76.310.2]FIGURE 16 Decomposition of Annual (%) CPI Growth into Goods and Services Growth
Source: Central Statistics Office.
The latest earnings data from the CSO show a modest increase in annual Average Hourly Earnings of 0.7 per cent, moving from €22.25 to €22.40. There was also an increase of 2.3 per cent or €0.51 on a quarterly basis. Eight out of the 13 sectors of the economy experienced an increase in annual Average Hourly Earnings. Among these, the information and communication sector experienced the largest increase at 4.4 per cent or from €30.56 to €31.91 per hour from Q1 2015 to Q1 2016. The largest decrease was recorded in the public administration and defence sector, falling by 1.3 per cent or from €25.66 to €25.33 per hour.
There have also been increases in annual Average Hourly Earnings across firms of all sizes. Small and medium enterprises consisting of less than 50 and between 50 and 250 employees experienced growth in annual Average Hourly Earnings of 0.2 and 2.0 per cent respectively. Large companies of more than 250 people showed an increase of 0.7 per cent, moving from €25.71 to €25.89 in the year to Q1 2016. Wage increases were common across the private and public sector in the year to Q1 2016. Private sector wages increased by 1.5 per cent while the increase observed in the public sector was more modest at 0.4 per cent.
Looking at a longer time horizon, we see that in the five years to Q1 2016 annual Average Hourly Earnings only increased by a modest 0.8 per cent. The gain, however, was quite broad occurring in ten of the 13 sectors. Again, the largest gains to earnings appear to have occurred in the information and communication sector, which encompasses many of the big international technology companies in Ireland. This sector saw annual Average Hourly Earnings grow from €26.93 to €31.91 or 18.5 per cent which is consistent with the rapid growth of many of
-2.50 -2.00 -1.50 -1.00 -0.50 0.00 0.50 1.00 1.50 2.00
these companies. At the same time, the largest decrease occurred in the human health and social work sector falling from €23.56 to €22.01 or 6.6 per cent.
With a tightening labour market and with close to full employment forecasted by the end of 2017, we expect wages to increase at an annual rate of 2.3 per cent in both 2016 and 2017. Although oil prices are still quite low historically, more recently there has been a moderate increase. This coupled with expected strong consumption growth boosting aggregate demand as well as strong growth in wages results in an expected increase in inflation of 0.8 per cent in 2016 and a further 1 per cent rise in 2017.
TABLE 1 Inflation Measures
2014 2015 2016 2017
Annual Change
% % % %
CPI 0.2 -0.3 0.8 1.0
Personal Consumption Deflator 1.7 0.4 1.0 1.0
HICP 0.3 0.0 0.8 1.2
Average Hourly Earnings 1.6 2.0 2.3 2.3
Sources: Central Statistics Office and ESRI forecasts.
Demand
Household Sector Consumption
FIGURE 17 KBC Bank/ESRI Consumer Sentiment Index
Sources: KBC/ESRI Consumer Sentiment Index.
As reviewed in the Monetary and Financial section, data from the Central Bank clearly demonstrate that, while Irish household debt is still quite high by European standards, overall household net worth continues to improve steadily. Thus, on the basis of the evidence available so far this year, we expect that growth in personal consumption to be 4 per cent in volume in 2016. Many of the factors outlined above will continue to influence personal consumption in 2017 and so our forecast is for growth of 3.5 per cent in the volume of personal consumption.
Property Market Developments
The Irish property market continues to deal with the legacy of the crash, with low levels of supply being exceeded by demand. In the year to April, residential property prices at a national level were 7.1 per cent higher compared with an increase of 7.4 per cent in March. In Dublin property prices were 4.6 per cent higher on an annual basis. Outside of Dublin, residential property prices were 9.5 per cent higher than in April 2015. Nationally, the Residential Property Price Index is just over 33 per cent lower than its highest level in 2007. Property prices in Dublin are still over 35 per cent lower than at their highest level in February 2007, while outside Dublin, the price of residential properties is close to 36 per cent lower than the highest level in September 2007. The PRTB/ESRI Rent Index shows, for the first quarter of 2016, that rents have continued to increase, although the rate of growth slowed in most sectors in the first quarter. At a national level, monthly rent levels rose in Quarter 1 2016, up by 0.5 per cent when compared with the previous quarter. On an annual basis, nationally, rents were 8.6 per cent higher than in Quarter 1 of 2015.
0.0 20.0 40.0 60.0 80.0 100.0 120.0 140.0 Ja n-00 O ct -00 Jul -0 1 Ap r-02 Ja n-03 O ct -03 Jul -0 4 Ap r-05 Ja n-06 O ct -06 Jul -0 7 Ap r-08 Ja n-09 O ct -09 Jul -1 0 Ap r-11 Ja n-12 O ct -12 Jul -1 3 Ap r-14 Ja n-15 O ct -15
Monthly Index 3 Month Moving Average
The stock of household mortgage debt outstanding continued to decline over the course of the first four months of the year, to €73.7 billion in April. Compared with April 2015 mortgage loans were 2.3 per cent lower, with households repaying €1.8 billion more than was advanced in new loans.
Activity levels in commercial construction remain strong, particularly in the office market. While estimates vary amongst the different agency firms the view is that the office vacancy rate has continued to decline. There was a large increase in the volume of office space under construction with a resumption of office construction activity during 2015, although much of this supply may not begin to become available until 2017.
Supply Investment
Investment in building and construction continues to show strong growth. However, housing completion statistics for the first three months of the year suggest that residential output is unlikely to show a significant increase from 2015. Thus, we have revised our forecast for housing completions for 2016 from 14,500 units to 13,500 units. In contrast, the upward trend in commercial construction is likely to continue in 2016, with the perceived shortage of office space in Dublin reflected in the number of new projects being commenced. Thus, the total volume of investment in building and construction is forecast to increase by 11 per cent this year. In the expectation that we continue to see strong levels of commercial construction activity and that the supply of new housing begins to show more significant growth the volume increase in building and construction is projected to reach 19 per cent in 2017.
In general, investment in machinery and equipment is influenced by many of the same factors that underpin construction investment. The rate of growth in this component has been influenced in recent years by aircraft purchases and the acquisition of intellectual property rights. With the economy expected to continue to grow and interest rates remaining relatively low, our expectation is that growth will remain strong, with the volume of investment in machinery and equipment forecast to increase by just under 25 per cent in 2016 and just under 22 per cent in 2017.
Labour Market
performance in the labour market of late, we expect total employment to reach two million by the end of 2016. The increase in employment in the year to Q1 2016 mainly consisted of gains in full-time employment of 30,700 or 2.1 per cent as well as part-time employment of 16,300 or 3.7 per cent.
The last year has been marked by modest but consistent quarterly employment growth. For example, in Q1 2016 employment growth on a seasonally adjusted basis rose by 15,400 or 0.8 per cent. In Q4 2015, employment registered growth of 6,600 or 0.3 per cent and the quarter before that there was growth of 9,400 or 0.5 per cent.
The data also reveal that there was a larger increase in the number of women being employed in the year to Q1 2016 at 27,900 or 3.2 per cent versus 19,000 or 1.8 per cent for men. Employment growth was relatively broad, with growth occurring in 12 out of the 14 sectors reported. The largest increases were recorded in the administrative and support services activities of 6,100 or 9.9 per cent and the construction sector, increasing by 9,500 or 7.8 per cent. Public sector employment also increased over the year to Q1 2016. In particular, employment grew on an annual basis by 3.2 per cent or from 374,500 to 386,600 including 4,600 census temporary staff. The only decrease observed over the period was seen in the defence sector which fell by 200 or 2.1 per cent. Excluding the temporary census field staff, a moderate increase of 0.8 per cent was observed in the public administration and defence sector as a whole. As it stands now, the overall employment rate among 15-65 year olds is 63.6 per cent compared to 62.2 per cent in Q1 2015.
TABLE 2 Employment Growth by Region
Employment (000's) Q1 2015 Q1 2016 Level Change YoY
(% change)
Border 190.7 195.7 5.0 2.6
Midland 114.0 117.4 3.4 3.0
West 177.0 176.6 -0.4 -0.2
Dublin 584.9 611.7 26.8 4.6
Mid-East 234.6 231.4 -3.2 -1.4
Mid-West 148.6 153.9 5.3 3.6
South East 201.9 204.4 2.5 1.2
South West 277.8 285.4 7.6 2.7
State 1929.5 1976.5 47.0 2.4
Source: Central Statistics Office.
Over the quarter to Q1 2016, the seasonally adjusted unemployment rate fell from 9 to 8.3 per cent as seen in Figure 18. Breaking the overall Figure into male and female unemployment shows that male unemployment decreased by 18,200 or -13.4 per cent while female unemployment fell by 15,100 or -19.6 per cent in the year to Q1 2016.
FIGURE 18 Seasonally Adjusted Quarterly Unemployment Rate (%)
Source: Central Statistics Office.
As mentioned in the previous Commentary, a positive trend in long-term unemployment has been observed over the last few years. This trend has continued with the latest release of the QNHS as seen in Figure 19. Over the year, the number of persons classified as long-term unemployed fell by 26,500 or 20.9 per cent, bringing total long-term unemployment to 100,600. Over the same period, short-term unemployment fell by 11,300 or 13.7 per cent.
0.0 2.0 4.0 6.0 8.0 10.0 12.0 14.0 16.0
Q1
FIGURE 19 Level of Unemployment by Duration (000’s)
Source: Central Statistics Office.
The crisis period clearly had a significant negative impact on Ireland’s youth unemployment levels. More recently, however, the level of youth unemployment in Ireland has begun to decrease. More specifically, the youth unemployment rate decreased from 21.5 to 16.9 per cent over the year to Q1 2016.
Average hourly total labour costs have shown a moderate increase over the last year of 0.6 per cent, moving from €25.70 to €25.86. Given the importance of labour costs in determining unit labour costs, an important measure of competitiveness, it is worth looking at recent and potential future developments in this particular series.
Irish competitiveness has improved significantly since the financial crisis. It was one of the main driving forces enabling an export led recovery and remains a vital component for securing Ireland’s continuing strong economic performance in the future. Ireland has benefitted from an array of external tailwinds such as the accommodative interest rate environment, low oil prices and beneficial exchange rate movements. In particular, the depreciation and relative weakness of the Euro to the US Dollar for most of 2013 through to 2015 greatly contributed to the export led growth and in turn to improvements in the labour market observed over that period.
Ireland’s relative openness as an economy makes it particularly vulnerable to exogenous economic shocks. For example, the Euro has appreciated against the
0.0 50.0 100.0 150.0 200.0 250.0 300.0 350.0
US Dollar by around 7 per cent in recent months as a result of uncertainty surrounding Brexit and this has negatively impacted Irish exporters’ cost competiveness. This appreciation would most likely increase further if Brexit is realised and would have a bigger impact on sectors such as the agri-food sector and indigenous SMEs where Britain accounts for a large majority of exports.18
To put into context the evolution of Ireland’s competitiveness over time, it is worth comparing Ireland’s case with some of our Euro Area counterparts. In particular we focus on the Harmonised Competitiveness Indicator, which is based on unit labour costs indices.19 This indicator allows for meaningful cross country
comparisons and is consistent with other measures such as the real effective exchange rates in the Euro Area. Figure 20 shows selected Euro Area countries’ unit labour cost competitiveness indicators since Q1 2000.
From Figure 20, it is clear that all countries, with the exception of Germany, experienced a loss in competitiveness from 2000 up until 2008, indicated by the rise in unit labour costs. The domestic competiveness indicator rose from 92.25 in Q1 2000 to reach a high of 131.88 in Q2 2008, meaning Ireland’s competitiveness position worsened by 43 per cent. From 2008 onwards, domestic competitiveness began to improve as unit labour costs decreased largely prompted by the movement away from the labour intensive construction industry.20 Since the
peak in Q2 2008, the indicator has fallen by 38 per cent indicating a significant improvement in competitiveness over the last few years. Ireland is now below the Euro Area average and is just marginally above Germany’s level which has remained well below the Euro Area average for nearly the entire period in question.
18 National Competitive Council (2016). Exchange Rates and Irish Competitiveness, Competitiveness Bulletin 16-4, April. 19 Unit labour costs for the total economy are calculated as the ratio of compensation per employee to labour
productivity. Labour productivity is measured as GDP at constant prices divided by the total number of persons employed using quarterly National Accounts as published by Eurostat.
20 O'Farrell, R. (2015). ‘Wages and Ireland’s International Competitiveness’, The Economic and Social Review, Vol. 46(3),