eurostat
Themenkreis 7 · Theme 7 · Thème 7
Dienstleistungen und Verkehr · Services and transport · Services et transports
Reihe Β · Series Β · Série Β
Konjunktur · Shortterm trends · Conjoncture
Dienstleistungen und Verkehr
Services and transport
Services et transports
Supplement
1
D 1992 Monatlich · Monthly · Mensuel
ISSN 1019-0619
Der Handel in der europäischen Union zu Beginn der neunziger Jahre
Distributive trade in the European Union at the beginning of the 1990s
Le commerce dans l'Union européenne au début des années 90
'>.:";:.:'
^ " " 1 4 % 1
18
Millionen Männer und Frauen million men and women
millions d'hommes et de femmes
Im Jahre 1990 waren im Handel insgesamt (Groß und Einzelhandel) 18,4 Millionen Personen beschäftigt, bei einer Erwerbsbevölkerung von insgesamt 133 Millionen. Damit beläuft sich der Anteil des Handels an der Gesamtbeschäftigung auf 14%, wovon 10% auf den Einzel und 4% auf den Großhandel entfallen.
In 1990, distributive trade (wholesale and retail) as a whole employed 18.4 million people out of a total workforce of133million. The sector's share in total employment was 14%, ofwhich 10% in retailing and 4% in wholesaling.
En 1990, le commerce dans son ensemble (gros et détail) occupait 18,4 millions de personnes sur une population active totale de 133 millions. Ainsi sa part dans l'emploi total s'élève à près de 14%, répartis en 10% pour le commerce de détail et 4% pour le commerce de gros.
4
Millionen Unternehmen million enterprises millions d'entreprisesZu Beginn der neunziger Jahre umfaßt der Handel in Europaetwa4 Millionen Unternehmen, davon 3,4 Millionen im Einzelhandel und 600 000 im Großhandel. Der Anteil an der Gesamtzahl der Unternehmen innerhalb der Gemeinschaft (etwa 12,6 Millionen) liegt bei über 30%.
In the early 1990s, distributive trade is made up of approximately 4 million enterprises, ofwhich 3.4 million in retailing and 600 000 in wholesaling. Its share in the total number of enterprises in the Community (approximately
12.6 million) exceeds 30%.
Au début des années 90 le com merce européen regroupe environ 4 millions d'entreprises, dont 3,4 millions pour le commerce de détail et 600 000 pour le commerce de gros. Sa part dans le nombre total d'entreprises de la CEE (environ 12,6 millions) dopasse les 30%.
555
Milliarden Ecu Wertschöpfung billion ecus in value addedmilliards d'écus de valeur ajoutée
Nach Schätzungen der Volkswirtschaftlichen üesamtrechnungen trägt der Handel 13% oder 555 Milliarden Ecu zum Bruttoinlandsprodukt der Gemeinschaft bei, das für 1990 auf 4 400 Milliarden Ecu veranschlagt wird. Dieser Wertschöpfung entspricht, für den Einzelhandel, ein Umsatz, von etwa 1300 Milliarden Ecu (ohne MwSt.).
According to national account estimates, distributive trade accounts for 13% (555 billion ecus), of the Community's total gross domestic product, evaluated at 4400 billion ecus in 1990. To this value added corresponds a retail turnover of about 1300 billion ecus excluding VAT.
m
eurostat
OFICINA ESTADÍSTICA DE LAS COMUNIDADES EUROPEAS DE EUROPÆISKE FÆLLESSKABERS STATISTISKE KONTOR STATISTISCHES AMT DER EUROPÄISCHEN GEMEINSCHAFTEN ΣΤΑΤΙΣΤΙΚΗ ΥΠΗΡΕΣΙΑ ΤΩΝ ΕΥΡΩΠΑΪΚΩΝ ΚΟΙΝΟΤΗΤΩΝ STATISTICAL OFFICE OF THE EUROPEAN COMMUNITIES
OFFICE STATISTIQUE DES COMMUNAUTÉS EUROPÉENNES
ISTITUTO STATISTICO DELLE COMUNITÀ EUROPEE
BUREAU VOOR DE STATISTIEK DER EUROPESE GEMEENSCHAPPEN SERVIÇO DE ESTATÍSTICA DAS COMUNIDADES EUROPEIAS
L-2920 Luxembourg - Tél. 43011 - Télex : Comeur Lu 3423
B-1049 Bruxelles, bâtiment Berlaymont, rue de la Loi 200 (bureau de liaison) - Tél. 2351111
Hinweis
Zuständig für alle Informationen über die Statistiken in diesem Bericht: Note
For any information on the statistics in this bulletin contact:
Note
Pour tous renseignements concernant les statistiques contenues dans ce bulletin, s'adresser à:
R. Govotsou Tel. 4301-2877/2388
© EGKS-EWG-EAG, Brüssel · Luxemburg, 1992
Nachdruck - ausgenommen zu kommerziellen Zwecken - mit Quellenangabe gestattet.
© ECSC-EEC-EAEC, Brussels · Luxembourg, 1992
Reproduction is authorized, except for commercial purposes, provided the source is acknowledged.
© CECA-CEE-CEEA, Bruxelles · Luxembourg, 1992
Reproduction autorisée, sauf à des fins commerciales, moyennant mention de la source.
eurostat
In dieser Ausgabe präsentiert Eurostat die wichtigsten Ergebnisse und ausgewählte Auszüge der für Oktober 1992 vorgesehenen Publikation über den europäischen Einzelhandel. Diese wird aus 12 Länderkapiteln und einem Übersichtskapitel bestehen, welches schwerpunktmässig folgende Themengebiete beinhaltet:
ti Der Handel in der europäischen Union
ti Der europäische Einzelhandelsapparat: Unternehmen und örtliche Einheiten
ti Die Beschäftigung im europäischen Einzelhandel ti Umsatzentwicklung im europäischen Einzelhandel
ti Kooperation und Konzentration im europäischen Einzelhandel
■ώ- Bedeutung des Handels in der Gemeinschaft
Seite 4
6 7 8 22
In this issue, Eurostat presents the main conclusions and selected extracts of the publication on retailing in European countries, which is scheduled for October 1992. The publication will consist of country reports and an overview chapter covering amongst others the following topics:
Page
ti Distributive trade in the European Union 10 ti Structures of European retail trade: enterprises 11
and local units
ti Employment in European retailing 12 ti Turnover trends in European retailing 13 ti Cooperation and concentration in European retailing 14
ti Importance of commerce in the Community 22
Dans ce numéro, Eurostat présente les principales conclusions et quelques extraits de la publication sur le commerce de détail européen prévue pour octobre 1992. Elle comportera 12 monographies nationales et un chapitre synthétique qui traitera, entre autres, les thèmes suivants; Page
ti Le commerce dans l'Union européenne 16
ti L'appareil du commerce de détail européen: 17
entreprises et unités locales
ti L'emploi dans le commerce de détail européen 18
ti L'activité du commerce de détail européen 19
ti Coopération et concentration dans le commerce 20 de détail européen
Der Handel in der europäischen Union
1. In einem Beschluß vom 14. November 1989 hat der Ministerrat dem Ausbau der Handelsstatistiken in den Mitgliedstaaten der Gemeinschaft einen bedeutenden Impuls gegeben. Die Kommission wird ersucht, ihre Arbeiten insbesondere hinsicht-lich folgender Fragen zu vertiefen:
o Verbesserung der statistischen Daten über den Handel, indem für eine Kompatibilität dieser Daten mit den Gemeinschaftsdefinitionen ge-sorgt wird;
o Intensivierung - soweit erforderlich - der Übermittlung dieser Daten an das Statistische Amt der Europäischen Gemeinschaften; o rasche Inangriffnahme des für den Bereich
Handel vorgesehenen sektoralen Programms, ohne Erhöhung der Belastung fur die Unter-nehmen.
2. Um dieser Aufforderung nachzukommen, hat Eurostat ein Aktionsprogramm mit folgenden Schwerpunkten eingeleitet:
o Beschaffung und Verbreitung verfügbarer Informationen aus den Mitgliedstaaten, von den verschiedenen Dienststellen der Kom-mission, insbesondere Eurostat, wie auch von privaten Quellen;
o Ausarbeitung einer gemeinsamen Methodo-logie zur Gewährleistung der Zuverlässigkeit und Vergleichbarkeit der statistischen Daten; o Durchführung von Piloterhebungen mit dem
Ziel, die statistischen Methoden und die Regeln zur Einstufung von Unternehmen und örtlichen Einheiten zu erproben, sowie erste Daten über den modernen Handel zu erhalten;
o Regelmäßige Erfassung harmonisierter Daten
über Strukturen und Entwicklungen im Handel und in der Distribution; Grundlage hierfür soll ein Rechtsakt der Gemeinschaft sein.
3. Dieses Aktionsprogramm für die Entwicklung von Statistiken über den Handel findet die Zustimmung der einschlägigen Fachkreise, die auf europäischer Ebene im Ausschuß für Handel und Distribution vertreten sind. In einer Stellungnahme vom 14. Dezember 1990 "hat dieser Ausschuß:
o die Ausarbeitung eines Aktionsprogramms durch Eurostat für die Entwicklung eines Systems der Handelsstatistiken zur Kenntnis genommen;
o seine volle Unterstützung für diese Maßnahme der Kommission erklärt, die endlich die sozio-ökonomische Bedeutung des Handels erkennt und ihm die Priorität zuerkennt, die ihm im Rahmen des Dienstleistungssektors zukommt, soweit dieses Programm die Besorgnisse der kleinen und mittelständischen Unternehmen (KMU) berücksichtigt und den Verwaltungs-aufwand der Unternehmen nicht erhöht;
o angeboten, zur Unterstützung Eurostats unver-züglich eine Ad-Hoc-Gruppe "Handels-statistiken" einzusetzen... "
4. Die Veröffentlichung, deren wichtigste Schluß-folgerungen wir nachstehend vorstellen, ist Teil des von Eurostat eingeleiteten Programms zur Erfassung und Verbreitung verfügbarer Informa-tionen. Die Publikation, die im kommenden Oktober erscheinen soll, beschreibt detailliert die Situation des Einzelhandels in den zwölf Mitgliedstaaten der Gemeinschaft zum Zeitpunkt der Vollendung des Binnenmarktes am 1. Januar 1993.
Der Einzelhandel in der Gemeinschaft: Strukturen,
Strategien, Perspektiven
Der Distributionsektor leistet einen ansehnlichen wertmäßigen Beitrag (13%) zur Produktion in den zwölf Mitgliedstaaten; hinsichlich der Beschäftigung zählt er zu den wichtigsten Sektoren (14% der Erwerbsbevölkerung). Er ist das Bindeglied zwi-schen den Wirtschaftsteilnehmern und übt insbeson-dere eine Schlüsselfunktion zwischen Produzenten und Endverbrauchern aus. Er erfüllt eine zweifache Aufgabe: einerseits die Beschaffung auf nationaler und internationaler Ebene, andererseits die Distri-bution und den Verkauf von Produkten an Anwender und Endverbraucher. Der Handel kann die
Bedürf-nisse des Verbrauchers im eigenen Land durch Einfuhren befriedigen, wenn Güter nicht verfügbar oder zu teuer sind; er partizipiert auch aktiv an den Ausfuhren.
mit sich bringen. Die hier verwendeten Statistiken reichen bis Ende 1990; sie sind nicht immer vollständig oder homogen. Um zu einer Synthese auf europäischer Ebene zu gelangen, mußte in einigen Fällen auf Schätzungen zurückgegriffen werden. Nur die Bemühungen Eurostats zu einer Harmonisierung der Statistiken mittels eines mehr jährigen Programms können zu einer tiefgreifenden Verbesserung der jetzigen Situation führen.
1. Der europäische Einzelhandelsapparat: Unternehmen und örtliche Einheiten In der Gemeinschaft erfüllen etwa 3,2 Millionen Unternehmen die Aufgabe der Güterverteilung beim Endverbraucher. Dabei entfallen auf vier Länder 65% der Gesamtzahl. Führend ist Italien mit 930000 Unternehmen, gefolgt von Spanien und Frankreich mit je 450000 und Deutschland mit 400000. Diese absoluten Zahlen sind jedoch erst dann aussage kräftig, wenn man sie mit den jeweiligen Bevölke rungszahlen der Länder und den Beschäftigtenzahlen der Unternehmen in Beziehung setzt (Tabelle 1). Die Verhältniszahlen "Anzahl der Unternehmen pro 10000 Einwohner" und "Beschäftigte pro Unter nehmen" ergeben eine Aufteilung der Länder der Gemeinschaft in zwei große "Familien": eine "MittelmeerFamilie", zu der man auch Belgien zählen muß, und eine "kontinentale/nordische Familie". Kennzeichen der ersten ist ein stark zersplitterter Einzelhandel mit einer geringen Zahl von Beschäftigten pro Unternehmen, während sich
Tabelle 1 : Die Kontraste des europäischen EinzelhandelsApparates (19881990)
Land Jahr Anzahl der Anzahl der Beschäftigte je Unternehmen Unternehmen Unternehmen
je 10000 Einwohner GR Ρ I Β E DK L F NL IRL D UK
EUR 12
Quelle: 1988 1988 1989 1988 1988 1990 1989 1988 1988 1988 1990 1988 198890 175 000 173 000 929 700 127 800 454 850
43 820 3 520 451 800 101 700 23 270 396 670 321 830 3 202 960
Nationale Statistische Amter und Schätzungen von 174 168 162 128 117 94 93 80 68 66 63 56 98 Eurostat. 2.0 2.6 2.6 2.8 2.9 3.9 4.6 4.9 5.1 4.5 6.5 9.5 4.1
die zweite Gruppe durch eine geringe Anzahl von Unternehmen mit großen Beschäftigtenzahlen aus zeichnet.
Zur ersten Gruppe gehören Griechenland, Portugal und Italien mit über 160 Unternehmen pro 10000 Einwohner, gefolgt von Belgien und Spanien. In allen diesen Ländern hat das einzelne Unternehmen im Durchschnitt weniger als drei Beschäftigte und einen sehr fragmentierten Handelsapparat. Zu den
Tabelle 2: Anteil der Unternehmen nach Hauptbereichen (19881990)
Land Nahrungsmittel Textilien, Bekleidung
Einrichtungs gegenstände
Fahrzeuge und Kraftstoffe
Übrige Insgesamt
Ρ IRL I E UK GR Β NL DK L F D Quelle: 52.6 47.9 42.3 39.7 34.6 29.5 28.0 27.5 27.7 27.0 26.8 20.3
Eurostat, auf der Basis von amtlichen Statistien.
Tabelle 3: Beschäftigungsmerkmale im europäischen Einzelhandel (1990) Land Angestellte in %
der Erwerbstätigen insgesamt
Weibliche Beschäftigte in %
der Erwerbstätigen insgesamt Teilzeitbeschäftigte in % der Angestellten
GR I Ρ E
Β IRL NL L DK UK F D EUR 12
28.9 38.7a
46.8 46.6
52.4 70.2 79.1 80.6 82.0 84.2 84.6 84.6 66.0
43.6 45.6 53.7
52.8 45.6 56.7 51.6 58.5 58.1 53.9 64.1 55.3
3.3 5.3 6.4
17.4 13.4 47.3 11.5 37.8 40.7 26.4b
27.8
a Inkl. GroBhandel.
b. INSEE, jährliche Erhebung im Handel. Quelle: Eurostat, Erhebung über Arbeitskräfte.
Gründen gehört die familiäre Struktur der Unter nehmen, die Bedeutung des Tourismus und der Schutz der Kleinunternehmen durch Gesetze.
Die zweite Gruppe bilden Länder mit einer zunehmenden Handelskonzentration, so u.a. das Vereinigte Königreich, Deutschland und die Nieder lande, mit mehr als 5 Beschäftigten pro Unternehmen. Im Vereinigten Königreich ist die Konzentration sehr viel ausgeprägter als in den anderen Ländern; hier hat das einzelne Unternehmen durchschnittlich etwa 10 Beschäftigte, und pro 10 000 Einwohner gibt es weniger als 60 Unternehmen. Frankreich, Dänemark und Luxemburg nehmen mittlere Plätze ein.
Das Einzelunternehmen ist nach wie vor in den meisten Ländern die verbreitetste Rechtsform für den Einzelhandel. Über 85% der Unternehmen in Spanien, Italien und Griechenland fallen in diese Gruppe. Trotz der Konzentration des Handels sind in Deutschland etwa 80% der Handelsunternehmen Einzelunternehmen. Aktiengesellschaften und Ge sellschaften mit beschränkter Haftung sind verbreitet in Frankreich (jedes vierte Unternehmen), in Irland und in Belgien (jedes fünfte),faber auch im Vereinigten
Königreich, für das jedoch momentan keine genauen Zahlen vorliegen.
Eine ähnliche Aufteilung der Mitgliedstaaten ist in bezug auf den Anteil der überwiegend im Lebens mittelsektor tätigen Unternehmen festzustellen
(Tabelle 2). In den Mittelmeerländern, aber auch im Vereinigten Königreich und in Irland liegt deren Anteil bei 30% und darüber. In Mitteleuropa zeichnet sich Deutschland durch einen außergewöhnlich niedrigen Anteil von 20% aus. Belgien, Luxemburg, die Nieder lande und Dänemark liegen zwischen 27 und 28%.
2. Die Beschäftigung im europäischen Einzelhandel
Der Einzelhandel in der Gemeinschaft beschäftigt etwa 13 Millionen Personen. Das entspricht etwas mehr als 70% der insgesamt im Handel tätigen Personen. DiegrößtenBeschäftigtenzahlenverzeich nen das Vereinigte Königreich (3 Millionen im Jahr 1990), Deutschland (2,7 Millionen im Jahr 1990 ) und Italien (2,2 Millionen im Jahr 1988). Es folgen Frank reich mit knapp2 Millionen (1990) und Spanien mit 1,3 Millionen (1988). Auf alle übrigen Länder, angeführt von den Niederlanden mit 520 000 Beschäftigten und Portugal mit 454 000 im Jahr 1990, entfallen insgesamt weitere zwei Millionen Beschäftigte.
Tabelle 4: Umsatzmerkmale des europäischen Einzelhandels (1990)
Land Umsatz
(in Mrd Ecu) Umsatz je Unternehmen (in 1 000 Ecu) Umsatz je Beschäftigten (in 1 000 Ecu)
D F UK I E NL Β Ρ GR DK
IRL
L
EUR 12
322 260 250 230
85 45 35 20 20 18 8 3
1296
813
575 779
246 187
446 273 116 125 375
348
800
405
12.5 13.7
8.2 9.6 6.4 8.7 9.8 4.4 5.8 9.5
7.7 15.0
9.8
Quelle: Eurostat, Schätzungen
Auch hier ist wiederum eine Zweiteilung der Gemein schaft festzustellen. Hinsichtlich des Anteils der Angestellten schwanken die Zahlen zwischen 29% für Griechenland und 85% für Deutschland und Frankreich. Die Mittelmeerländer liegen alle unter der Schwelle von 50%, Belgien mit 52% knapp darüber. Beginnend mit Irland schnellt dieser Anteil für die Gruppe der "nordischen" Länder einschließlich Frankreich auf 70% und darüber.
Der Anteil der Frauen an der Beschäftigung folgt ebenfalls dieser Aufteilung, mit Ausnahme von Irland, dessen Werte eher denen von Griechenland und Portugal entsprechen. In diesen drei Ländern bilden die Frauen nach wie vor eine Minderheit unter den Beschäftigten. In allen übrigen Ländern liegt ihr Anteil oft sogar erheblich über 50%. Den höchsten Wert verzeichnet Deutschland (64%), gefolgt von Däne mark und dem Vereinigten Königreich mit jeweils über 58%, sowie den Niederlanden mit knapp 57%. Bei der Teilzeitbeschäftigung gibt es große Unter schiede. Wenig verbreitet ist sie in den Mittelmeer ländern: sie liegt zwischen 3% in Griechenland und 6% in Spanien. Irland, Luxemburg und Belgien haben durchschnittlich zwischen 10% und 20% Teilzeitbe schäftigte. Frankreich und Deutschland liegen gleich auf bei etwa 27%. Drei Länder heben sich deutlich von den anderen ab: Dänemark, das Vereinigte König reich und insbesondere die Niederlande, die mit 47% Teilzeitarbeit unangefochten an der Spitze liegen.
3. Umsatzentwicklung im europäischen Einzelhandel
1990 betrug der Gesamtumsatz des Einzelhandels schätzungsweise 1 300 Milliarden Ecu. Davon ent fielen knapp 80% auf Deutschland, Frankreich, das Vereinigte Königreich und Italien (Tabelle 4). Der
Schaubild 1 : Mengenmäßiges Umsatzwachstum des Einzelhandels zu konstanten Preisen (19851990)
( I M S . 100)
123 122
115 114 113 112 111 110 log ioa 107 10« 105 104 103 102
UK EUR 9 NL
Umsatz je Unternehmen ist von Land zu Land sehr unterschiedlich. Er liegt bei etwa 800 000 Ecu in Deutschland, dem Vereinigten Königreich und Luxemburg. Frankreich und die Niederlande nehmen mit etwa 500 000 Ecu eine mittlere Position ein. Der Umsatz je Beschäftigten ist am höchsten in Luxemburg, Frankreich und Deutschland mit über 120 000 Ecu. In Dänemark, Belgien und Italien liegt er bei etwa 100 000 Ecu.
In den letzten fünf Jahren ist der Umsatz des Einzel handels mengenmäßig für die Gesamtheit der Mitgliedsländer um knapp 20% gestiegen (aus genommen Spanien, Italien und Portugal, für die noch keine Indikatoren vorliegen). Die Entwicklung sieht für die einzelnen Länder recht unterschiedlich aus. Deutschland und das Vereinigte Königreich verzeichnen den stärksten Zuwachs, etwa 23% bzw. 20% seit 1985. Belgien, Frankreich, die Niederlande und Griechenland liegen bei etwa 17%, Irland und Luxemburg bei 10%. Für Dänemark wird kein Umsatzzuwachs verzeichnet.
4. Kooperation und Konzentration im europäischen Einzelhandel
Zwei Entwicklungen kennzeichnenden europäischen Einzelhandel, und zwar eine Kooperations und eine Konzentrationsbewegung. Obwohl eine kleine Zahl großer Unternehmen bereits den größten Teil des Branchenumsatzes tätigt, gibt es eine große Gruppe
kleinerer Unternehmen, die sich auf kundennahen und qualitativ hochwertigen Service spezialisiert haben.
Angesichts der Konkurrenz der Großunternehmen können kleine und mittlere Einzelhändler ihre Position auf dem Markt nur über Zusammenschlüsse und Kooperationsabkommen halten. Während aber die Genossenschaften im klassischen Sinne fast überall an Boden verloren haben, erweisen sich andere Formen der Assoziierung, insbesondere "freiwillige Ketten", "Einkaufszusammenschlüsse" und "Franchising" zunehmend als effiziente Alternative zu den Großformen des Einzelhandels.
In Deutschland kontrollieren zusammengeschlos sene Handelsunternehmen etwa 22% des Marktes; die Tendenz ist steigend. Im deutschen Lebens mittelhandel werden über 80% der Waren über Einkaufszentralen abgesetzt. Dieser Anteil beträgt für Unterhaltungselektronik, Möbel und Schuhe knapp 70%. In den Niederlanden gibt es verschie dene Formen der Kooperation, auf die zusammen über 40% der Verkäufe im Einzelhandel entfallen, etwa 15 % mehr als vor zehn Jahren.
Andererseits ist in Frankreich der Einzelhandel nach wie vor zu isoliert und wenig organisiert, um den großen Konzernen entgegenzuwirken, die ihren Marktanteil stetig steigern: im Lebensmittelbereich entfallen auf die Großunternehmen bereits 59%. Die
T a b e l l e 5
Land
F
UK
D
NL
I
Β
E
Ρ
DK
I R La
EUR 10
: F r a n c h i s i n g in der G e m e i n s c h a f t ( 1 9 9 1 )
Anzahl der FranchiseGeber Anzahl der FranchiseNehmer
675
379
260 302
266
90
117
50
55
20
2 214
33 000
18 260
12 500
10 200
12 903
3 200
14 500
800 500
105 8 6 3 "
Umsatz in Mrd Ecu
21.0
7.5
6.5
6.2
4.2
3.3
2.1
0.5
0.1
51.4 e
a. am 3/12/89. b. ohne Irland. c. ohne Portugal.
Kooperation entwickelt sich hier vor allem unter gemeinsamen Markenzeichen wie Ledere oder Intermarché. In den Mittelmeerländern ist der Einzel-handel nach wie vor stark zersplittert, finanzschwach und wenig organisiert. Er steht jedoch nach wie vor unter relativ starkem gesetzlichen Schutz. Koopera-tionsmodelle sind vor allem im Lebensmittelbereich zu verzeichnen: etwa 11% der örtlichen Einheiten im Lebensmittelsektor Italiens gehören zu einer Handelskette, während der Anteil Im Non-Food-Bereich bei nur 1% liegt.
Das "Franchising"-Modell verdient besondere Beachtung (Tabelle 5). Es ist die Trumpf karte des modernen unabhängigen Einzelhandels, da es zwei wesentliche Erfolgsfaktoren enthält: die Assoziierung und die Spezialisierung. In den meisten Ländern der Gemeinschaft hat die Bedeutung dieser Organisationsform zugenommen. Frankreich führt mit 675 Franchisegebern und 33 000 Franchise-nehmern mit einem Jahresumsatz von etwa 21 Milliarden Ecu; das entspricht etwa 10% des Gesamtumsatzes im nationalen Einzelhandels-sektor. Es folgen das Vereinigte Königreich, Deutschland und Italien.
Dennoch ist in allen Ländern eine Tendenz zur Konzentration festzustellen, generell deutlicher im Lebensmittelbereich als im Non-Food-Sektor und stärker in Nord- als in Südeuropa. So erwirtschaften in Deutschland 1% der Unternehmen im Lebens-mittelbereich 70% des Umsatzes, im Non-Food-Bereich sind es 45%. Die Konzentration ist noch ausgeprägter im Vereinigten Königreich, wo die zehn
größten Lebensmittelhändler über 60% des Umsatzes erbringen. Demgegenüber lag in Italien der Anteil von Unternehmen mit 20 oder mehr Beschäftigten 1990 bei nur 13%. Auch die Niederlande hat keine größere Konzentration zu verzeichnen.
Wichtigstes Instrument der Konzentration ist der Großmarkt, bekannt als "Verbrauchermarkt oder SB-Warenhaus" in Deutschland, "superstore" im Vereinigten Königreich und "hypermarché" in Frankreich. Die Definitionen hinsichtlich der Mindestgröße der Verkaufsfläche und des Anteils des Lebensmittelbereichs sind von Land zu Land verschieden. Legt man jedoch eine Größe von 2 500 m2 zugrunde, dann gab es in Deutschland
Anfang 1991 rund 1000 SB-Warenhäuser, gegen-über 850 in Frankreich und 770 im Vereinigten Königreich. Am anderen Ende der Skala stehen Länder wie Spanien, Italien oder auch die Niederlande mit nur einigen Dutzend SB-Warenhäusern mit Schwerpunkt Lebensmittel.
Große Einzelhandelsgruppen, die im Norden der Gemeinschaft zahlreiche Großverkaufsformen mit Erfolg getestet haben, exportieren ihre modernen Konzepte zunehmend auch in die südlichen EG-Länder, wo der Einzelhandel noch kleinbetrieblich organisiert ist. In den letztgenannten Ländern ist bereits ein grundlegender Strukturwandel Im Gange, wobei kleine und mittlere Unternehmen immer mehr nach Möglichkeiten der Assoziierung und Kooperation Ausschau halten müssen, um langfristig bestehen zu können.
Themengebiete Unternehmen und lokale Einheiten,
regionale Verteilung, Anteil der Angestellten und Teilzeitbeschäftigten, Frauenarbeit, Umsatz nach Größenklassen
und Verkaufsform, Kooperations- und Konzentrationsbewegungen, Expansions
und Diversifizierungsstrategien *
*
*
eure
Jr
)stat
angekündigt für den Monat Oktober 1992
Der Einzelhandel in den zwölf Mitgliedstaaten der Gemeinschaft: Strukturen, Strategien, Perspektiven
12 Länderanalysen mit einer detaillierten Beschreibung nationaler Merkmale des Distributionssektors.
1 Vergleichskapitel, welches die zusammengetragenen Daten auf EG-Ebene untersucht und gegenüberstellt
Zahlreiche Anlagen mit gängigen Definitionen und den wichtigsten Informationsquellen
Distributive trade in the European Union
1. In its resolution of 14 November 1989 the Council of Ministers stressed the significance of distributive trade statistics in the EC Member States. It urged the Commission to intensify its efforts in the following fields:
o to improve trade statistics by making them compatible with Community definitions; o to increase, as required, the supply of such
statistics to the Statistical Office of the European Communities (Eurostat);
o to rapidly embark on the sectoral programme for commerce without increasing the administrative burden on enterprises.
2. In response to this resolution, Eurostat initiated an action programme based on:
o collection and dissemination of information available in the Member States, from various departments of the Commission, chiefly Eurostat, or from private sources;
o development of a common methodology designed to guarantee the reliability and com-parability of statistical data;
o carrying out of pilot surveys in order to test statistical methods and the rules governing the classification of enterprises and local units, and to obtain initial data concerning modern distribution;
o collection on a regular basis of harmonized information concerning distribution structures and trends; this operation will be supported by a legal document at Community level.
3. The action programme to develop statistics on distributive trade has received the approval of the professional organizations represented at Euro-pean level in the Committee of Trade and Distribu-tion (CDT). In an official statement issued on 14 December 1990, 'lhe Committee of Trade and Distribution:
o acknowledges Eurostat's action programme for the development of a statistical system con-cerning distributive trade;
o declares its full support to this programme undertaken by the Commission, which at last acknowledges the socio-economic importance of distributive trade by giving it due priority within the 'services' sector, provided that it addresses the needs of small and medium-sized enter-prises without however imposing an added administrative burden on enterprises;
o proposes to assist Eurostat, by setting up as soon as possible, an ad hoc working group on
'distributive trade statistics'... "
4. The publication on retailing in EC countries forms an integral part of the programme undertaken by Eurostat for the purpose of collecting and disse-minating existing information. Preliminary conclu-sions and some extracts are presented here.
This publication is scheduled for October 1992 to mark the launching of the Single Market on 1st January 1993. It reviews the retail sector in the twelve Member States.
Retail trade in the Community:
structures, strategies and perspectives
The distribution sector contributes an important part (13%) of the value of production in the twelve Member States, and is one of the main sectors for employment (14% of the workforce). It serves as an intermediary between producers and consumers and has two main functions:supply at national and international level, and distribution and sale of products to users. By importing, distributive trade can satisfy consumers' needs where goods are not locally available or are too expensive. The sector also participates actively in exports.
The definition of retail trade includes the sale and repair of motor vehicles, in line with general practice in the Member States. The implementation of the revised General Industrial Classification of Economic Activities within the European Community (NACE Rev. 1) will result in the creation of a specific heading for this activity. The statistics used are those available at the end of 1990; they are not always complete or homogeneous. It was occasionally necessary to rely on estimates in order to achieve a synthesis at
European level. Eurostat's efforts to achieve statistical harmonization through its longterm programme will make it possible to considerably improve this situation. 1. Structures of European retail trade:
enterprises and local units
In the Community, almost 3.2 million enterprises provide distribution services to consumers. Four countries together represent 65% of this total. Italy comes first with 930 000 enterprises, followed by Spain and France (450 000 respectively) and Germany (400 000). However, these absolute figures become meaningful only when related to the number of people served by these enterprises orto the number of persons they employ (Table 1).
The ratios 'number of enterprises per 10000 inhabitants' and the 'number of persons employed per enterprise' allow the Member States of the Community to be divided into two important groups: a 'Mediterranean' group, which also includes Belgium, and a 'Continental or Nordic' group. The first group of countries is characterized by a fragmented retail structure with enterprises generally employing only a small number of persons, whereas in the second group a small number of enterprises generally employ many more staff.
The leading countries in the first group are Greece, Portugal and Italy with more than 160 enterprises per 10 000 inhabitants, followed by Belgium and Spain. In all these countries enterprises are widely scattered and on average employ fewer than three persons for
Table 1 : Contrasting structures within the European retail sector (19881990)
Country Year Number of Number of Persons enterprises enterprises engaged per per 10000 enterprise inhabitants GR Ρ I Β E 1988 1988 1989 1988 1988 175 000 173 000 929 700 127 800 454 850 174 168 162 128 117 2.0 2.6 2.6 2.8 2.9
sffifâgfâgggfâp :::::^
DK L F NL IRL D UK EUR 12
1990 1989 1988 1988 1988 1990 1988 198890 43 820 3 520 451 800 101 700 23 270 396 670 321 830 3 202 960
94 93 80 68 66 63 56 98 3.9 4.6 4.9 5.1 4.5 6.5 9.5 4.1
Source: National Statistical Offices and Eurostat estimates.
the following reasons: the importance of familyrun businesses and tourism, as well as the existence of laws protecting small businesses.
The second group includes countries where distributive trade is becoming increasingly concen trated, such as the United Kingdom, Germany and The Netherlands. In this group, enterprises generally employ more than 5 persons. In the United Kingdom, where the average enterprise employs around 10 persons and there are fewer than 60
Table 2: Share of enterprises according to main activity (19881990)
Country Food Textiles, Textiles, Household Cars and fuels
Clothing
Household equipment
Miscellaneous Total
Ρ IRL I E UK GR Β NL DK L F D Source: 52.6 47.9 42.3 39.7 34.6 29.5 28.0 27.5 27.7 27.0 26.8 20.3
Eurostat, based on national statistics.
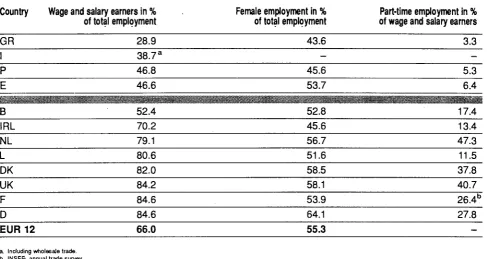
[image:11.595.309.542.60.337.2] [image:11.595.55.543.549.774.2]Table 3: Employment characteristics in European retailing (1990)
Country Wage and salary earners in %
of total employment Female employment in % of total employment of wage and salary earners Part-time employment in %
GR I Ρ E
Β IRL NL L DK UK F D EUR 12
28.9 38.7a
46.8 46.6
52.4 70.2 79.1 80.6 82.0 84.2 84.6 84.6 66.0
43.6 -45.6 53.7
52.8 45.6 56.7 51.6 58.5 58.1 53.9 64.1 55.3
3.3 -5.3 6.4
17.4 13.4 47.3 11.5 37.8 40.7 26.4b
27.8
-a. Including wholesale trade. b. IN5EE, annual trade survey. Source; Eurostat, labour force survey
enterprises per 10 000 Inhabitants, distributive trade is more concentrated than in the other countries. France, Denmark and Luxembourg occupy an intermediate position.
All across the Community, the sole proprietorship remains the predominant legal form of enterprises engaged in retailing. In Greece, Italy and Spain more than 80% of all enterprises take this form. In Germany, where concentration levels are high, approximately 80% of businesses are sole proprietorships. Joint stock companies and limited-liability companies occur frequently in France (1 enterprise in 4), in Ireland and in Belgium (1 enterprise in 5), and most probably also in the United Kingdom, for which accurate figures are not presently available.
Countries can be grouped In a similar manner as to the proportion of enterprises primarily engaged in food distribution (Table 2). In the Mediterranean countries, and also in Ireland and in the United Kingdom, this proportion approaches or exceeds 30%. In continental Europe, Germany stands out with an exceptionally low 20%. The proportions in Belgium, Luxembourg, The Netherlands and Denmark lie between 27% and 28%.
2. Employment in European retailing
Retail trade in the Community provides work for approximately 13 million people, a little more than 70% of those occupied in commercial activities as a
whole. Most of the persons engaged in retailing can be found in the United Kingdom (3 million in 1990), Germany (2.7 million in 1990) and Italy (2.2 million in 1988). France and Spain follow with nearly 2 million (1990) and 1.3 million (1988) persons engaged. The remaining countries, led by The Netherlands (520 000 persons engaged in 1990) and Portugal (454000 persons engaged in 1990), together account for almost two million people.
It is worth examining the position of the twelve member countries with respect to the three main features of employment: share of wage and salary earners, women In the workforce and part-timers (Table 3).
These three variables once again confirm the existence of two major groups of countries. As far as wage and salary earners are concerned, the percentage ranges from 29% in Greece to 85% in Germany and France. The Mediterranean countries are all below the 50% threshold, with Belgium 52% playing a pivotal role. The rate bounces to 70% in Ireland, increasing thereafter in the countries of the Nordic group, including France.
Female employment follows the same pattern except in Ireland, where the situation resembles that of Greece and Portugal. In these three countries women are in a minority. Elsewhere their numbers surpass the 50% mark, sometimes considerably. Women make up the highest percentage of the workforce in Germany
Table 4: Characteristics of retail activities in the Community (1990)
Country Turnover
in billion Ecus Turnover per enterprise in 1000 Ecus Turnover per person engaged in 1000 Ecus
D F UK I E NL Β Ρ GR DK
IRL
L EUR 12
322 260 250 230
85 45 35
20 20
18 8 3 1296
813 575 779 246 187
446
273 116 125 375 348 800
405
12.5 13.7
8.2 9.6 6.4 8.7 9.8 4.4 5.8 9.5
7.7 15.0
9.8
Source: Eurostat estimates.
(64%); next come Denmark, the United Kingdom with over 58% and The Netherlands with almost 57%.
Part-time work patterns vary greatly. Part-time work does not occur frequently in the Mediterranean countries: 3% in Greece, 6% in Spain. The average rate of part-time work in Ireland, Luxembourg and Belgium varies between 10% and 20%. Rates in France and Germany are nearly the same, around 27%. Three countries stand out: Denmark, the United Kingdom and above all The Netherlands, which leads by far with a part-time employment rate of 47%.
3. Turnover trends in European retailing
For 1990, total retail turnover is estimated at 1 300 billion ecus, ofwhich 80% was generated in Germany, France, the United Kingdom and Italy (Table 4). The turnover per enterprise varies greatly from country to country. It is about 800 000 ecus in Germany, the United Kingdom and Luxembourg. France and The Netherlands occupy an intermediate position with about 500 000 ecus. The greatest turnover per person employed can be found in Luxembourg, France and Germany, where it exceeds 120 000 ecus. In Denmark, Belgium and Italy turnover per person employed is around 100 000 ecus.
Over the last five years retail turnover has grown by more than 20% at constant prices in the Community
countries (not including Spain, Italy and Portugal, for which indicators are not yet available). Growth rates vary from country to country. Germany and the United Kingdom recorded the highest increase, 23% and 20% respectively since 1985. In Belgium, France, The Netherlands and Greece, growth rates have been
Figure 1 : Growth in retail turnover at constant prices (1985-1990)
123
122
121
120
119
118
117
116
-115
114
113
112
111
110
109
-108
107
106
105
104
103
102
D UK EUR« NL Β
Eurostat, monthly services statistics
[image:13.595.303.547.448.791.2]about 17%, in Ireland and in Luxembourg about 10%. In Denmark, retail trade turnover has apparently been stagnating.
4. Cooperation and concentration in
European retailing
European retail trade is marked by two parallel movements: cooperation and concentration. A small number of large enterprises have become responsible for the largest proportion of national turnover, but a great number of small-sized enterprises offering quality and specialized neighbourhood service continue to exist.
In the face of competition from large groups, small and medium-sized enterprises can only hold on to their market share by joining forces in associative and cooperative networks. Whereas cooperatives in the classic sense have been losing ground practically everywhere, other forms of association, especially 'voluntary chains', buying groups' and 'franchising' have become effective alternatives to large-scale distribution.
Affiliations control approximately 22% of the German marketwith an upward trend. In German food retailing, more than 80% of all suppliers pass through a central buying office. This proportion reaches 70% in the consumer electronics, furniture and shoe sectors. In
The Netherlands, several forms of cooperation exist and together they are responsible for more than 40% of all retail sales, 15% more than ten years ago. In France, on the other hand, the isolated small retailer is too poorly organized to counter the large groups, whose market share keeps on increasing; large French distributors are now responsible for 59% of all sales in the food sector. Cooperation is developing mainly in the form of common trademarks such as Ledere or Intermarché. In the Mediterranean countries, retail trade remains fragmented, financially weak and in general poorly organized. It is still fairly well protected by legislation. Cooperation is most developed in the food sector: approximately 11 % of all Italian retail food stores belong to an affiliation, whereas this percentage is only 1% in the non-food sectors.
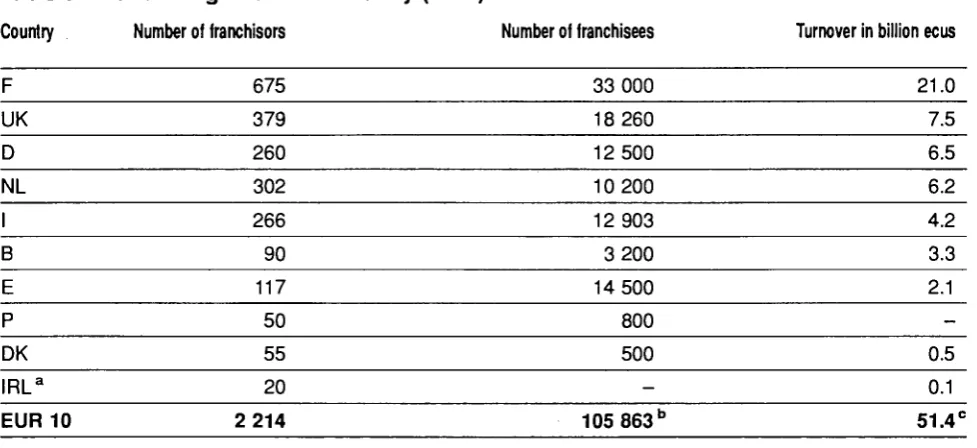
Franchising deserves special attention (Table 5). It represents a major asset for modern independent retailers, as it involves two key factors of success, association and specialization. The importance of franchising has been studied for most countries in the Community. Franchising is most developed in France, where 675 franchisors and 33 000 franchisees are responsible for an annual turnover of approximately 21 billion ecus, almost 10% of total domestic retail turnover. France is followed by the United Kingdom, Germany and Italy.
Table 5:
Country
F UK D NL I Β E Ρ DK IRLa
EUR 10
Franchising in the Community (1991)
Number of franchisors
675
379
260 302 266 90 117 50 55 20 2 214
Number of franchisees
33 000 18 260 12 500 10 200 12 903 3 200 14 500 800 500
-105 863"
Turnover in billion ecus
21.0
7.5 6.5 6.2 4.2 3.3 2.1 -0.5 0.1
51.4 e a. at3/12/B9
b. Excluding Ireland. c. Excluding Portugal.
Source: European Franchising Federation.
[image:14.595.55.544.521.745.2]However, the trend in all countries is towards concentration. It is generally more pronounced in the food than in the non-food sector, and more in Northern than in Southern Europe. In Germany, 1%of businesses are responsible for 70% of turnover In the food and 45% of turnover in the non-food sectors. Concentration is still greater In the United Kingdom, where the ten leading food groups are responsible for more than 60% of turnover. In Italy, on the other hand, the market share held by businesses employing 20 persons or more was only 13% in 1990. The Netherlands have so far managed to avoid a high concentration. The main means of concentration remains the large store, known as a 'Verbrauchermarkt' or a 'SB-Warenhaus' in Germany, a 'superstore' in the United Kingdom, and a 'hypermarché' in France. Definitions vary from country to country, as to sales area and food predominance. However, if a 2 500 m2 threshold is
accepted, then Germany at the start of 1991 had approximately 1000 superstores, compared to 850 in France and 770 in the United Kingdom. In countries such as Spain, Italy or The Netherlands, on the other hand, there were only a few dozen large-scale food retailers.
The large retail groups, which have been able to experiment with large-scale operations in Northern European countries, feel encouraged to export their modern sales formats to Southern Europe where distributive trade mainly consists of small companies. However, a substantial change is already underway in the these countries. More than ever, small and medium-size enterprises will find it necessary to turn to affiliations and cooperations, in order to survive in the long run.
Topics covered enterprises and local outlets, shop densities, share of salary earners and part-timers, female employment, turnover by size class and form of retailing, cooperation, concentration, foreign penetration
and diversification strategies *
*
*
7
Ü
eurosta
To be published in October 1992
Retail trade in the twelve Member States of the Community: structures, strategies and perspectives
12 national chapters covering country-specific features of distribution
1 comparative chapter summarizing and analysing collected data in a European perspective
Various annexes giving an overview of existing definitions and main statistical sources
Tables, figures and maps
Le commerce dans l'Union européenne
1. Dans sa résolution du 14 novembre 1989, le Conseil des Ministres a donné au développement des statistiques sur le commerce dans les pays de la Communauté une impulsion particulière. Il invite la Commission à approfondir ses travaux, notam-ment sur les questions suivantes:
o améliorer les données statistiques sur le commerce en les rendant compatibles avec les définitions communautaires;
o intensifier, dans la mesure nécessaire, la fourniture de ces données à l'Office Statistique des Communautés européennes;
o entreprendre rapidement le programme sec-toriel «commerce» sans alourdir les obligations administratives des entreprises.
2. En réponse à cette résolution, Eurostat a mis en oeuvre un programme d'action dont les principaux axes sont les suivants:
o rassemblement et diffusion des informations existantes, disponibles dans les Etats membres, dans les différents services de la Commission et principalement à Eurostat, et à partir des sources privées;
<> établissement d'une méthodologie commune destinée à garantir la fiabilité et la comparabilité des données statistiques;
o réalisation d'enquêtes pilotes dans le but de tester les méthodes statistiques et les règles de classement des entreprises et des unités locales, ainsi que d'obtenir des premières données sur le commerce moderne;
o collecte régulière d'informations harmonisées surla structure et la conjoncture du commerce et
de la distribution; cette collecte sera appuyée par un texte légal au niveau communautaire. 3. Ce programme d'action pour le développement des
statistiques sur le commerce a reçu l'approbation des milieux professionnels représentés au niveau européen dans le Comité du Commerce et de la Distribution (CCD). Dans un avis pris le 14 décembre 1990, le «Comité du Commerce et de la Distribution:
o prend acte de l'élaboration par Eurostat d'un programme d'action pour le développement d'un système statistique sur le commerce; o déclare adhérer pleinement à cette action de la
Commission, qui reconnaît enfin l'importance socio-économique du commerce en lui accordant la priorité qu'il mérite au sein de l'entité services, pour autant cependant qu'elle réponde aux préoccupations des PME sans toutefois alourdir la charge administrative des entreprises;
o propose de faire bénéficier Eurostat, par la constitution sans délai d'un groupe de travail ad hoc «Statistiques de commerce», de son concours...»
4. La publication dont nous présentons ci-après les principales conclusions et quelques extraits fait partie du programme engagé par Eurostat au titre du rassemblement et de la diffusion des informa-tions existantes. Prévue pour octobre prochain, elle apportera une description détaillée du commerce de détail dans les douze pays de la Communauté au moment même de l'ouverture du grand marché le
1er janvier 1993.
Le commerce de détail dans la Communauté:
structures, stratégies, perspectives
Le secteur de la distribution contribue pour une part importante (13%) à la valeur de la production des douze Etats membres; il figure parmi les principaux secteurs employeurs de main d'oeuvre (14% de la population active). Il s'interpose entre les agents économiques et notamment il occupe la fonction clé d'Intermédiaire entre producteurs et consommateurs finals. Il agit à deux niveaux, celui des approvisionne-ments à l'échelle nationale et internationale et celui de la distribution et de la vente des produits aux utilisa-teurs. Le commerce peut satisfaire les besoins du consommateur national par les importations au cas où les marchandises ne sont pas disponibles ou trop
chères dans le pays; il participe activement aux exportations.
Dans ce qui suit, le commerce de détail comprend la vente et la réparation d'automobile, suivant l'usage le plus répandu actuellement dans les Etats membres. La mise en application prochaine de la nomenclature révisée des activités dans la Communauté euro-péenne (NACE Rév.1) entraînera la création d'un groupe spécifique pour cette activité. Les statistiques utilisées sont celles existantes à la fin de 1990; elles ne sont pas toujours complètes ni homogènes. Pour parvenir à une synthèse au niveau de l'Europe ¡I a fallu parfois recourir à des estimations. Les efforts
d'harmonisation statistique engagés par Eurostat dans son programme pluriannuel permettront seuls d'améliorer cette situation.
1. L'appareil du commerce de détail européen: entreprises et unités locales Dans la Communauté, environ 3,2 millions d'entre prises assurent le service de la distribution auprès du consommateur final. Quatre pays regroupent 65% de ce total. L'Italie vient en tête avec 930 000 entreprises, suivie de l'Espagne et de la France (450 000 respectivement) et enfin de l'Allemagne (400 000). Mais ces chiffres absolus seront plus significatifs s'ils sont rapportés soit à la population que ces entreprises desservent soit aux effectifs qu'elles emploient (Tableau 1).
Les ratios «nombre d'entreprises pour 10000 habitants» et «effectifs occupés par entreprise» permettent de répartir les pays de la Communauté en deux grandes familles: une famille «méditer ranéenne» à laquelle, on doit aussi rattacher la Belgique, et une famille «continentale ou nordique». Dans la première règne un commerce de détail atomisé avec un nombre réduit d'actifs par entreprise, alors que la seconde est caractérisée par un commerce exercé par un petit nombre d'entreprises aux effectifs plus nombreux.
Dans le premier groupe, on trouve en premier lieu la Grèce, le Portugal et l'Italie avec plus de 160
Tableau 1 : Les contrastes de l'appareil commercial de détail européen (19881990) Paye Année Nombre Nombre Effectifs
d'entreprises d'entreprises par entreprise pour 10000 habitants GR Ρ I Β E 1988 1988 1989 1988 1988 175 000 173 000 929 700 127 800
454 850
174 168 162 128 117 2.0 2.6 2.6 2.8 2.9 DK L F NL IRL D UK
EUR 12
1990 1989 1988 1988 1988 1990 1988 198890 43 820
3 520
451 800
101 700
23 270
396 670
321 830
3 202 960
94 93 80 68 66 63 56 98 3.9 4.6 4.9 5.1 4.5 6.5 9.5 4.1
Source: INS et estimations d'Eurostat.
entreprises pour 10000 habitants, suivis de la Belgique et de l'Espagne. Tous ces pays ont en moyenne moins de trois actifs par entreprise et un commerce très dispersé. Parmi les facteurs expliquant cette situation, on peut citer les structures familiales des entreprises, l'importance du tourisme et de la législation protectrice des petites entreprises. Dans le deuxième groupe figurent les pays au commerce de plus en plus concentré tels que le RoyaumeUni, l'Allemagne et les PaysBas qui ont
Tableau 2: Part des entreprises selon leur activité principale (19881990)
Pays Alimentation Textile,
habillement
Equipement du foyer
Automobile et carburants
Divers Total
Ρ IRL I E UK GR Β NL DK L F D Source: 52.6 47.9 42.3 39.7 34.6 29.5 28.0 27.5 27.7 27.0 26.8 20.3
Eurostat, à partir des statistiques nationales
Tableau 3: Modalités de l'emploi dans le commerce de détail européen (1990) Pays Emplois salariés
en % de l'emploi total
Emplois féminins
en % de l'emploi total en % de l'emploi salarié Emplois à temps partiel
GR I Ρ E
Β IRL NL L DK UK F D EUR 12
: · : ■ " · : · : ■ : ■ : ■ : ■ " ■ : ■ : ■ : ■ : ■ : ■ : ■ : ■ : ■ : ■ : ■ : ■ : ■ : ■ :
28.9 38.7a
46.8 46.6
52.4 70.2 79.1 80.6 82.0 84.2 84.6 84.6 66.0
43.6 45.6 53.7
¡JM« J >
52.8 45.6 56.7 51.6 58.5 58.1 53.9 64.1 55.3
3.3 5.3 6.4
17.4 13.4 47.3 11.5 37.8 40.7 26.4b
27.8
a Y compris commerce de gros.
b. Enquête annuelle d'entreprises dans le commerce. Source: Eurostat, enquête sur les forces de travail.
tous plus de 5 actifs par entreprise. Le commerce au RoyaumeUni connaît une concentration très supérieure à celle des autres pays, avec environ 10 actifs par entreprise et moins de 60 entreprises pour 10000 habitants. La France, le Danemark et le Luxembourg occupent une position intermédiaire.
L'entreprise individuelle reste la forme juridique prédominante pour le commerce de détail dans la plupart des pays. Plus de 85% des entreprises ont cette forme en Espagne, en Italie et en Grèce. Malgré un commerce concentré, l'Allemagne compte environ 80% d'entreprises individuelles. Les sociétés anonymes et à responsabilité limitée sont nom breuses en France (1 entreprise sur 4), en Irlande et en Belgique (1 entreprise sur 5), mais certainement aussi au RoyaumeUni sans que l'on puisse le chiffrer dans l'état actuel de l'information.
Les pays se répartissent de manière presque similaire en ce qui concerne la part des entreprises à prédominance alimentaire (Tableau 2). Dans les pays méditerranéens, mais aussi au RoyaumeUni et en Irlande, cette part dépasse ou approche 30%. En Europe continentale, l'Allemagne se fait remarquer par un taux exceptionnellement faible de 20%. La Belgique , le Danemark, le Luxembourg et les Pays Bas se situent entre 27 et 28%.
2. L'emploi dans le commerce de détail européen
Le commerce de détail communautaire emploie environ 13 millions de personnes, soit un peu plus de 70% des effectifs du commerce dans son ensemble. Les effectifs les plus nombreux sont au RoyaumeUni (3 millions en 1990), en Allemagne (2.7 millions en 1990) et en Italie (2,2 millions en 1988). La France vient ensuite avec près de 2 millions (1990), suivie par l'Espagne (1.3 millions en 1988). L'ensemble des autres pays, menés par les PaysBas (520 000 actifs en 1990) et le Portugal (454 000 actifs en 1990), se partagent presque deux millions de personnes occupées.
Il est intéressant d'examiner comment se situent les douze pays de la Communauté par rapport aux trois phénomènes majeurs qui marquent l'emploi dans le commerce, à savoir la salarisation, l'emploi féminin et le travail à temps partiel (Tableau 3).
Ces trois variables confirment encore une fois l'existence de deux grandes familles de pays. En ce qui concerne la salarisation, les taux varient de 29% en Grèce jusqu'à 85% pour l'Allemagne et la France. Les pays méditerranéens se situent tous sous le seuil de 50%, la Belgique faisant charnière avec un taux de 52%. Le taux bondit à 70% à partir de l'Irlande pour le groupe des pays nordiques, auxquels se joint la France.
Tableau 4: Caractéristiques de l'activité du commerce de détail européen (1990) Pays Chiffre d'affaires
en milliards d'écus Chiffre d'affaires par entreprise en milliers d'écus Chiffre d'affaires par personne employée en milliers d'écus
D F UK I E NL Β Ρ GR DK
IRL
L
EUR 12
322 260 250 230
85 45 35 20 20 18 8 3
1296
813 575
779 246
187
446
273 116 125 375
348
800
405
12.5 13.7
8.2 9.6 6.4 8.7 9.8 4.4 5.8 9.5
7.7 15.0
9.8
Source: Estimations d'Eurostat.
L'emploi féminin suit la même typologie, exception faite de l'Irlande qui reste proche de la Grèce et du Portugal. Dans ces trois pays les femmes restent minoritaires. Partout ailleurs, elles dépassent, parfois de beaucoup, le seuil de 50%. Le plus fort pourcentage est enregistré en Allemagne (64%); viennent ensuite le Danemark, le RoyaumeUni avec plus de 58% et les PaysBas avec presque 57%. Quant au temps partiel, il est très inégalement pratiqué. Il est très peu répandu dans les pays méditerrannéens: de 3% en Grèce à 6% en Espagne. L'Irlande, le Luxembourg et la Belgique connaissent des taux moyens situés entre 10 et 20%. La France et l'Allemagne ont des taux très voisins autourde27%. Trois payssedistinguent nettement: le Danemark, RoyaumeUni et surtout les PaysBas qui viennent largement en tête avec un taux de 47%. 3. L'activité du commerce de détail
européen
En 1990, le chiffre d'affaires total du secteur «commerce de détail» peut être estimé à 1 300 milliards d'écus, dont près de 80% sont réalisés en Allemagne, France, RoyaumeUni et Italie (Tableau 4). Le chiffre d'affaires par entreprise est très inégal selon les pays. Il avoisine 800 000 écus en Allemagne, RoyaumeUni et au Luxembourg. La France et les PaysBas occupent une position intermédiaire aux environs de 500000 écus. Par personne active, les chiffres d'affaires les plus élevés se trouvent au
Luxembourg, en France et en Allemagne, où ils dépassent 120000 écus. Aux alentours de 100000 écus se situent le Danemark, la Belgique et l'Italie.
Pendant les cinq dernières années, le chiffre d'affaires du commerce de détail en volume, c'estàdire à prix
Graphique 1 : Croissance du chiffre d'affaires du commerce de détail en volume à prix constants (19851990)
[1985. 100)
123 122 121 120 »
-8 -7 -6 -5
-110
10« IOS
107
106
105
I M 103
102
101 100
UK EUR 9 NL
Source: Eurostat, statistiques mensuelles sur les services.
constants, s'est accru de près de 20% dans l'ensemble des pays de la Communauté (mis à part l'Espagne, l'Italie et le Portugal pour lesquels il n'existe pas encore d'indicateurs). L'évolution varie selon les pays. L'Allemagne et le RoyaumeUni enregistrent la croissance la plus forte, soit respectivement 23% et 20% depuis 1985. La Belgique, la France, les Pays Bas et la Grèce présentent des taux voisins de 17%, l'Irlande et le Luxembourg de 10 %. La croissance du chiffre d'affaires aurait été nulle au Danemark.
4. Coopération et concentration dans le commerce de détail européen
Le commerce de détail européen connaît deux mouvements complémentaires : coopération et concentration. Un petit nombre de grandes entreprises réalisent la plus grande partie du chiffre d'affaires national, mais il subsiste un grand nombre d'entreprises de petite taille qui rendent un service commercial de proximité, de qualité et de spécialisation.
Face à la concurrence des grandes entreprises, le petit et moyen commerce ne peut résister et défendre ses parts de marché qu'à travers des réseaux d'association et de coopération. Mais, alors que les coopératives au sens classique du terme ont perdu presque partout du terrain, d'autres formes d'association, surtout les «chaînes volontaires«, les
«groupements d'achats» et la «franchise» sont devenues des alternatives efficaces au grand commerce concentré.
En Allemagne, le commerce associé contrôle environ 22% du marché et sa part est tendanciellement en hausse. Dans le commerce alimentaire allemand, plusde80%des approvisionnements passent par une centrale d'achats. Cette proportion atteint 70% pour l'électronique grand public, les meubles et les chaussures. Les PaysBas connaissent plusieurs formes de coopération qui réalisent ensemble plus de 40% des ventes dans le commerce de détail, soit 15% de plus qu'il y a dix ans.
Le petit commerce francais reste par contre assez isolé et trop inorganisé pour faire face aux grands groupes qui continuent à augmenter leurs parts de marché: la grande distribution française représente déjà 59% du secteur alimentaire. La coopération s'y développe surtout sous forme d'enseignes communes de type Ledere et Intermarché. Dans les pays méditerranéens, le commerce de détail reste très fragmenté, financièrementfaible et peu organisé, liest encore assez protégé par la législation. La coopération est surtout développée dans la filière alimentaire: ainsi environ 11% des unités locales alimentaires italiennes appartiennent à une affiliation, alors que dans le commerce non alimentaire ce pourcentage s'élève seulement à 1%.
Tableau 5:
Pays
F UK D NL
I Β E Ρ DK IRLa
EUR 10
La franchise dans la Communauté (1991)
Nombre de franchiseurs Nombre de franchisés
675 379 260 302
266 90 117 50 55 20 2 214
33 000 18 260 12 500 10 200
12 903 3 200 14 500 800 500 105 863 b
Chiffre d'affaires en milliards d'écus
2 1 . 0
7.5 6.5 6.2
4.2 3.3 2.1 0.5 0.1 51.4 e
a. au 3/12/89. b. non compris l'Irlande. c. non compris le Portugal.
Source: Fédération européenne de la franchise.
La franchise mérite un attention spéciale (Tableau 5). Elle est un des atouts du commerce indépendant moderne, car elle comporte deux facteurs de réussite: l'association et la spécialisation. On a pu mesurer l'importance de la franchise dans la plupart des pays de la Communauté. C'est en France que la franchise apparaît la plus développée avec 675 franchiseurs et 33 000 franchisés réalisant annuellement environ 21 milliards d'écus de chiffre d'affaires, soit environ 10% du chiffre d'affaires total du secteur. Viennent ensuite le Royaume-Uni, l'Allemagne et l'Italie.
La tendance à la concentration l'emporte cependant dans tous les pays. Elle est généralement plus accentuée dans l'alimentaire que dans le non alimentaire et plus en Europe du Nord qu'en Europe du Sud. Ainsi en Allemagne 1% des entreprises réalisent 70% du chiffre d'affaires dans l'alimentaire et 5% dans le non alimentaire. La concentration est encore plus élevée en Angleterre, où les dix premiers groupes alimentaires réalisent plus de 60% du chiffre d'affaires. Par contre, en Italie la part des entreprises de 20 personnes et plus n'était que de 13% en 1990. Les Pays-Bas échappent aussi à une concentration élevée. L'instrument principal de la concentration
reste le magasin de grande surface, connu sous le nom de «Verbrauchermarkt et SB-Warenhaus» en Allemagne, «superstore» au Royaume-Uni et «hypermarché» en France. Les définitions varient de pays à pays pour ce qui concerne les seuils admis pour la surface de ventes et pour la prédominance alimentaire. Mais si l'on adopte le seuil de 2 500 m2,
l'Allemagne comptait au début de 1991 environ 1 000 hypermarchés contre 850 en France et 770 en Angleterre. A l'opposé, des pays comme l'Espagne, l'Italie ou les Pays-Bas ne disposaient que de quelques dizaines de grandes surfaces à pré-dominance alimentaire.
Les grands groupes du commerce de détail, qui ont pu expérimenter dans les pays d'Europe du Nord des formes de vente à grande échelle, sont poussés à exporter leurs formules modernes vers l'Europe du Sud qui connaît un commerce plus fragmentaire. On constate déjà un changement substantiel du paysage commercial dans ces pays. Le petit et moyen commerce devra avoir recours, plus encore que maintenant, à l'association et à la coopération.
Thèmes traités entreprises et magasins, répartition géographique, emplois salariés et à temps partiel, rôle des femmes, chiffre d'affaires par
taille et forme de vente, coopération, concentration, stratégies
d'implantation et de diversification
*
*
*
7
n
eurosta
A paraître en octobre 1992
Le commerce de détail dans l'Europe des douze: structures, stratégies et perspectives
12 monographies nationales insistant sur les traits spécifiques de la distribution de chaque pays
1 chapitre synthétique qui compare, analyse et fusionne les données recueillies pour dresser une vue d'ensemble des annexes avec des définitions et les principales sources statistiques
Tableaux, graphiques et cartes géographiques
Bedeutung des Handels
in der Gemeinschaft
Importance of commerce
in the Community
Importance du commerce
dans la Communauté
Anteil an der Bruttowertschöpfung Share in value added
Part dans la valeur ajoutée
Anteil an der Gesamtbeschäftigung Share in employment
Part dans la population active
Anteil an der Anzahl der Unternehmen Share in the number of enterprises Part dans le nombre d'entreprises