Statistics
in focus
POPULATION AND
SOCIAL CONDITIONS
13/2005
Author
Anne-Catherine GUIO*
C o n t e n t s
A new Source on Income, Poverty & Social Exclusion….. 1
72 million EU citizens at risk of poverty … ... 1
Being poor is relative…… ... 2
How poor are the ‘poor’? ... 3
The richest have 5 times more than the poorest… ... 3
Social protection decreases the relative poverty risk… ... 4
The precision of the indicators… ... 5
More breakdowns…... 5
INCOME POVERTY AND SOCIAL
EXCLUSION IN THE EU25
A new Source on Income, Poverty & Social Exclusion…
At the Laeken European Council in December 2001, European Union (EU) Heads of State and Government endorsed a first set of 18 common statistical indicators of social exclusion and poverty that were later refined by the Social Protection Committee. These indicators are an essential element in the Open Method of Co-ordination to monitor progress of Member States in the fight against poverty and social exclusion.
During the reference period 1994-2001 the European Community Household Panel (ECHP) has traditionally been the primary source of data used for the calculation of these indicators in the field of Income, Poverty & Social Exclusion. Given the need to update the content of the ECHP in order to satisfy new political demands, to reflect evolving best practice and to improve operational quality, i.e. mainly the timely publication of the data which is produced, it was decided to replace the ECHP and to introduce a legal act for its replacement, the EU-SILC (Community Statistics on Income and living Conditions). The EU-SILC project was launched in 2003 on the basis of a 'gentleman’s agreement' in six Member States (Belgium, Denmark, Greece, Ireland, Luxembourg, and Austria) as well as in Norway. The starting date for the EU-SILC instrument under the Framework Regulation of the European Parliament and of the Council was 2004 for the EU-15 (with the exception of Germany, Netherlands and the UK who have derogations until 2005) as well as for Estonia, Norway and Iceland. The New Member States with the exception of Estonia are allowed to start in 2005. Timetables for implementation in Acceding and Candidate Countries (Bulgaria, Croatia, Romania and Turkey) and in Switzerland are being discussed.
[image:1.595.7.198.6.454.2]The implications of this means that the first set of micro data and cross-sectional indicators from EU-SILC which covers all the EU25 Member States will only be available in December 2006. Therefore Eurostat launched a collection of indicators derived from national sources during the transition until EU-SILC (see Table 1 in methodological notes for a presentation of the source of data to be used). Due to this difference of data sources, the indicators cannot be considered to be fully comparable with the EU-SILC ones or between countries. However, in spite of this difference of data sources, every harmonisation effort has been made to insure the maximum comparability between definitions and concepts used in the different countries and at the EU level and the indicators presented in this paper provide valuable information on poverty and social exclusion at the EU25 level.
72 million EU citizens at risk of poverty …
The list of common indicators has a primary focus on indicators of relative income poverty, referring to individuals living in households where equivalised income is below the threshold of 60% of the national equivalised median income. Given the conventional nature of the retained threshold, and the fact that having an income below this threshold is neither a necessary nor a sufficient condition of being in a state of poverty, this indicator is referred to as a measure of poverty risk.
Based on this criterion, Figure 1 shows the proportion of the population who were at risk of poverty in each country in 2003. On average, 16% of the EU population were at risk of poverty in 2003 (see methodological notes), i.e. living in households with an “equivalised disposable income” below 60% of the median equivalised income of the country they live in. This means that around 72 million citizens are considered as at risk of poverty in the EU25. This figure, calculated as a weighted average of national results (where each country receives a weight that equals its total population), masks considerable variation between Member States. At one extreme, countries with the highest poverty rate are Slovakia, Ireland, Greece (21%) followed by Portugal, Italy, Spain (19%) and the United Kingdom and Estonia (18%). At the other extreme, the share of the population at risk of poverty is close to 10% in the Czech Republic (8%), Luxembourg, Hungary, Slovenia (10%), followed by Finland and Sweden (11%), Denmark, France, Holland (12%) and Austria (13%). The remaining countries face intermediate poverty rates close to the EU average.
* Seconded National Expert (15/02/2002 – 31/07/2005) from IWEPS (Institut wallon de l’évaluation, de la prospective et de la statistique) - Belgium
(
#
Manuscript completed on: 12.08.2005 Data extracted on: 7.06.2005 ISSN 1024-4352
Catalogue number: KS-NK-05-013-EN-C
2 6Ω∆ΩΛςΩΛΦς ΛΘ ΙΡΦΞς ″ 3ΡΣΞΟ∆ΩΛΡΘ ∆ΘΓ ςΡΦΛ∆Ο ΦΡΘΓΛΩΛΡΘς ″ 13/2005 ″″″″″″″″″″″″″″″″″″″″
"
6ΡΞΥΦΗ: (ΞΥΡςΩ∆Ω. 6ΗΗ 7∆ΕΟΗ 1 ∆ΘΓ ΠΗΩΚΡΓΡΟΡϑΛΦ∆Ο ΘΡΩΗς ΙΡΥ ΠΡΥΗ ΓΗΩ∆ΛΟ ΡΘ ΩΚΗ ΓΛΙΙΗΥΗΘΩ ςΡΞΥΦΗς ΞςΗΓ. 7ΚΗ (825 ∆ΘΓ (815 ∆ΨΗΥ∆ϑΗς ∆ΥΗ Φ∆ΟΦΞΟ∆ΩΗΓ ∆ς ∆ ΣΡΣΞΟ∆ΩΛΡΘ-ΖΗΛϑΚΩΗΓ ∆ΨΗΥ∆ϑΗ ΡΙ ΩΚΗ ∆Ψ∆ΛΟ∆ΕΟΗ Θ∆ΩΛΡΘ∆Ο Ψ∆ΟΞΗς.%ΗΛΘϑ ΣΡΡΥ Λς ΥΗΟ∆ΩΛΨΗ↔↔
7ΚΗ ΠΗ∆ςΞΥΗ ΡΙ ΣΡΨΗΥΩ∴ ΥΛςΝ, ΚΡΖΗΨΗΥ, ΡΘΟ∴ ςΚΡΖς Σ∆ΥΩ ΡΙ ΩΚΗ ΣΛΦΩΞΥΗ. ∃ΟΩΚΡΞϑΚ 1ΗΖ 0ΗΠΕΗΥ 6Ω∆ΩΗς ∆ΘΓ &∆ΘΓΛΓ∆ΩΗ/∃ΦΦΗΓΛΘϑ &ΡΞΘΩΥΛΗς ∆ΘΓ (815 0ΗΠΕΗΥ 6Ω∆ΩΗς (ΡΘ ∆ΨΗΥ∆ϑΗ) ςΚΡΖ ∆ ΨΗΥ∴ ςΛΠΛΟ∆Υ ΣΗΥΙΡΥΠ∆ΘΦΗ ΛΘ ΩΗΥΠς ΡΙ Η[ΣΡςΞΥΗ ΩΡ ΣΡΨΗΥΩ∴ ΥΛςΝ, ΩΚΗ ϑΗΘΗΥ∆ΟΟ∴ ΠΞΦΚ ΟΡΖΗΥ ΟΗΨΗΟ ΡΙ ΩΚΗ Θ∆ΩΛΡΘ∆Ο ΣΡΨΗΥΩ∴ ΩΚΥΗςΚΡΟΓς ΥΗΙΟΗΦΩς ΩΚΗ ΣΡΡΥΗΥ ΟΛΨΛΘϑ ΦΡΘΓΛΩΛΡΘς ΖΚΛΦΚ ΣΥΗΨ∆ΛΟ ΛΘ ΩΚΗ ΙΡΥΠΗΥ ΦΡΞΘΩΥΛΗς ΩΚ∆Θ ΛΘ (815 0ΗΠΕΗΥς 6Ω∆ΩΗς. 7Ρ ΛΟΟΞςΩΥ∆ΩΗ ΩΚΗ ΥΗΟ∆ΩΛΨΗ ΓΛΠΗΘςΛΡΘ ΡΙ ΩΚΛς ΩΚΥΗςΚΡΟΓ ∆ΘΓ ΚΗΟΣ ΞΘΓΗΥςΩ∆ΘΓ ΛΩς ∆ΦΩΞ∆Ο ΠΗ∆ΘΛΘϑ, )ΛϑΞΥΗ 2 ςΚΡΖς ΩΚΗ ΠΡΘΗΩ∆Υ∴ Ψ∆ΟΞΗς ΛΘ 3ΞΥΦΚ∆ςΛΘϑ 3ΡΖΗΥ 6Ω∆ΘΓ∆ΥΓς (336) ΙΡΥ ∆ 2 ∆ΓΞΟΩς-2 ΦΚΛΟΓΥΗΘ ΚΡΞςΗΚΡΟΓ ΙΡΥ Η∆ΦΚ 0ΗΠΕΗΥ 6Ω∆ΩΗ. %∴ ΦΡΠΣ∆ΥΛΘϑ )ΛϑΞΥΗ 1 ∆ΘΓ )ΛϑΞΥΗ 2, ΦΡΞΘΩΥΛΗς ΖΛΩΚ ΩΚΗ ΟΡΖΗςΩ ΣΡΨΗΥΩ∴ ΥΛςΝ ΩΗΘΓ ΩΡ Κ∆ΨΗ ΩΚΗ ΚΛϑΚΗςΩ ΣΡΨΗΥΩ∴ ΩΚΥΗςΚΡΟΓ ∆ΘΓ ΨΛΦΗ ΨΗΥς∆. 7ΚΛς ΗΨΛΓΗΘΦΗ Λς ΚΡΖΗΨΗΥ ΠΡΥΗ ΘΡΩΛΦΗ∆ΕΟΗ ΛΘ ΩΚΗ (815 0ΗΠΕΗΥ 6Ω∆ΩΗς (ΖΛΩΚ ςΡΠΗ Η[ΦΗΣΩΛΡΘς ΟΛΝΗ 8. ∆ΘΓ
,() ΩΚ∆Θ ΛΘ 1ΗΖ 0ΗΠΕΗΥ 6Ω∆ΩΗς. (ΨΗΘ ΛΙ ςΡΠΗ ΡΙ ΩΚΗ 1ΗΖ 0ΗΠΕΗΥ 6Ω∆ΩΗς ∆ΥΗ ΥΗΟ∆ΩΛΨΗΟ∴ ΖΗΟΟ Υ∆ΘΝΗΓ ΛΘ ΩΗΥΠς ΡΙ ΣΡΨΗΥΩ∴ ΥΛςΝς (ςΗΗ )ΛϑΞΥΗ 1), ΘΛΘΗ ΡΙ ΩΚΗ ΩΗΘ 1ΗΖ 0ΗΠΕΗΥ 6Ω∆ΩΗς Κ∆ΨΗ ∆ ΩΚΥΗςΚΡΟΓ ΖΚΛΦΚ Λς ΕΗΟΡΖ ΩΚΗ (825-∆ΨΗΥ∆ϑΗ. ([ΣΥΗςςΗΓ ΛΘ ΩΗΥΠς ΡΙ ΩΚΗ (825-∆ΨΗΥ∆ϑΗ (ΖΚΡςΗ Ψ∆ΟΞΗ Λς 15.913 336) Ψ∆ΟΞΗς Υ∆ΘϑΗ, ΛΘ ΩΚΗ ΗΘΟ∆ΥϑΗΓ (8, ΙΥΡΠ 28% ΛΘ /∆ΩΨΛ∆ ΩΡ 188% ΛΘ /Ξ[ΗΠΕΡΞΥϑ, Λ.Η. ∆ Υ∆ΩΛΡ ΡΙ ∆ΟΠΡςΩ 7 ΩΚ∆Ω ΚΛϑΚΟΛϑΚΩς ΩΚΗ ΓΛΙΙΗΥΗΘΦΗς ΕΗΩΖΗΗΘ Θ∆ΩΛΡΘ∆Ο ςΩ∆ΘΓ∆ΥΓς ΡΙ ΟΛΨΛΘϑ. 7ΚΛς ΗΠΣΚ∆ςΛςΗς ΩΚΗ ΘΗΗΓ ΩΡ ϑΡ ΕΗ∴ΡΘΓ ΩΚΗ Η[∆ΠΛΘ∆ΩΛΡΘ ΡΙ ΠΗ∆ςΞΥΗς ΡΙ ΥΗΟ∆ΩΛΨΗ ΣΡΨΗΥΩ∴ ΥΛςΝ ΛΘ ΡΥΓΗΥ ΩΡ ΓΥ∆Ζ ∆ ΠΡΥΗ ΦΡΠΣΟΗΩΗ ΣΛΦΩΞΥΗ ΡΙ ΣΡΨΗΥΩ∴ ∆ΘΓ ςΡΦΛ∆Ο Η[ΦΟΞςΛΡΘ ΛΘ ∆ ϑΛΨΗΘ ΦΡΞΘΩΥ∴.
6ΡΞΥΦΗ: (ΞΥΡςΩ∆Ω. 6ΗΗ 7∆ΕΟΗ 1 ∆ΘΓ ΠΗΩΚΡΓΡΟΡϑΛΦ∆Ο ΘΡΩΗς ΙΡΥ ΠΡΥΗ ΓΗΩ∆ΛΟ ΡΘ ΩΚΗ ΓΛΙΙΗΥΗΘΩ ςΡΞΥΦΗς ΞςΗΓ. 7ΚΗ (825 ∆ΘΓ (815 ∆ΨΗΥ∆ϑΗς ∆ΥΗ Φ∆ΟΦΞΟ∆ΩΗΓ ∆ς ∆ ΣΡΣΞΟ∆ΩΛΡΘ-ΖΗΛϑΚΩΗΓ ∆ΨΗΥ∆ϑΗ ΡΙ ΩΚΗ ∆Ψ∆ΛΟ∆ΕΟΗ Θ∆ΩΛΡΘ∆Ο Ψ∆ΟΞΗς.
)ΛϑΞΥΗ 1: ∃Ω-ΥΛςΝ-ΡΙ-ΣΡΨΗΥΩ∴ Υ∆ΩΗ, ΩΡΩ∆Ο ΣΡΣΞΟ∆ΩΛΡΘ, 2003
)ΛϑΞΥΗ 2: ,ΟΟΞςΩΥ∆ΩΛΨΗ Ψ∆ΟΞΗ ΡΙ ΩΚΗ ∆Ω-ΥΛςΝ-ΡΙ-ΣΡΨΗΥΩ∴ ΩΚΥΗςΚΡΟΓ ΙΡΥ ∆ 2 ∆ΓΞΟΩς-2 ΦΚΛΟΓΥΗΘ ΚΡΞςΗΚΡΟΓ, 2003
0 5000 10000 15000 20000 25000 30000
/9 /7 (( 3/ 6. +8 &= (/ 6, 07 ,7 (6 (8
2
5
), &< )5 6( (8
1
5
,( ∃7 %( ∋( ∋. 8. 1/ /8 52 %∗ 75 +5 12
..6 336 0 5 10 15 20 25
&= /8 +8 6, ), 6( ∋. )5 1/ ∃7 ∋( &< 07 %( (8
2
5
/9 (8
1
5
————————————————————— 13/2005 — Population and social conditions — Statistics in focus 3
#"
0 5 10 15 20 25 30 35 40
5 10 15 20 25
At-risk of poverty rate, %
A
t-ri
s
k
of
pov
e
rt
y
ga
p,
%
How poor are the ‘poor’?
The choice of 60% of national median equivalised income is conventional, although statistical considerations have guided this selection. To examine the sensitivity of the risk of poverty to the choice of alternative thresholds, three different thresholds have been considered: 40%, 50% and 70% of median equivalised income. At the EU average level, the likelihood of being at risk of poverty varied in 2003 from 5% to 24% for thresholds set at 40% and 70% of the median respectively; it is 10% if a 50% cut-off is employed.
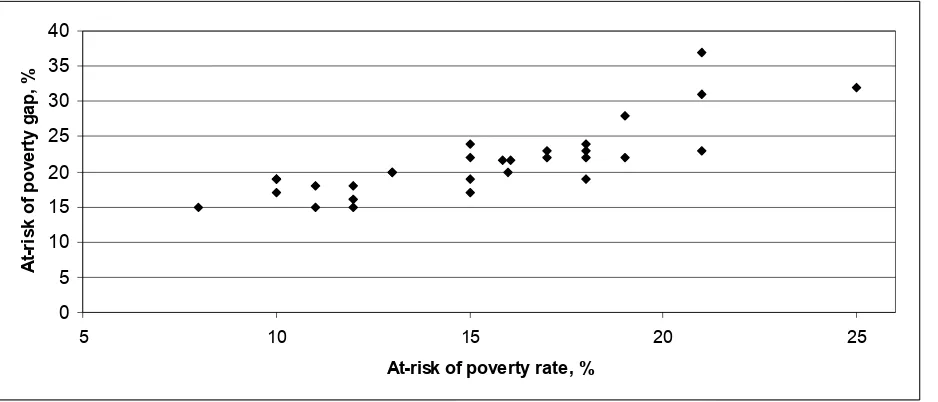
This gives a first insight into the depth of poverty risk. One Laeken indicator that explicitly measures how far below the threshold the income of people at risk of poverty is, i.e.
“how poor the poor are”, is the at-risk-of-poverty gap. In 2003 the median gap (i.e. the difference between the median equivalised income of the poor and the 60% threshold), expressed as a percentage of this threshold, was 22% at EU level. In other words, half of those at-risk-of-poverty had an equivalised income below 78% of the at-risk-of-poverty threshold (i.e. below 78%*60%=47% of median equivalised income). The gap was higher in Slovakia (37%) and Greece (31%) and lower in Czech Republic, Denmark and Finland (15%). Figure 3 plots the poverty gap against the at-risk of poverty rate and highlights that poverty severity goes hand in hand with poverty incidence.
Source: Eurostat. See Table 1 and methodological notes for more detail on the different sources used. The EU25 and EU15 averages are calculated as a population-weighted average of the available national values.
The richest have 5 times more than the poorest…
The focus of all the indicators presented so far is on the bottom part of the income distribution. It can also be interesting to look at the relative position of the bottom group with regard to that of the top group. This can be illustrated by the S80/S20 ratio. For each country, this ratio compares the total equivalised income received by the top income quintile (20% of the population with the highest equivalised income) to that received by the bottom income quintile (20% with lowest equivalised income). The EU25 average is 4.6 in 2003, which means that the wealthiest quintile had 4.6 times more income than the poorest. Ratios range from 3.0 in Hungary to 7.4 in Portugal. S80/S20 is only responsive to changes in top and bottom quintiles. The Gini coefficient allows one to take into account the full distribution of income. If there was perfect equality (i.e. each person receives the same income), the Gini coefficient would be 0%; it would be 100% if the entire national income were in the hands of only one person. In 2003, the calculated coefficient for the EU25 was 29%. National Gini coefficients vary between 22%
(Slovenia) and 35% (UK, Greece). The rankings of national Gini coefficients and S80/S20 ratios are fairly similar as can be seen in Figure 4, even if there are some countries for which there are differences depending on the inequality measure used. For example, the relative position of UK in terms of inequality is more favourable on the basis of the S80/S20 than the Gini coefficient. This would mean that the gap between the richest and the poorest is less widespread (compared to the EU25) than the global inequality based on the whole distribution of income is. The situation of other countries (like for example TR, SI, SE, IE, EL, IT, SK, DK) is relatively more favourable when inequality takes only into account the gap between the extremes of the distribution.
[image:3.595.67.536.263.464.2]It is also noticeable that due to the relative narrowness of the income distribution, most New Member States and Acceding and Candidate Countries have a S80/S20 ratio or a Gini coefficient that is close to the EU-15 mean, or even lower.
4 Statistics in focus — Population and social conditions — 13/2005 ————————————————————
[image:4.595.64.535.64.244.2]
#
Figure 4: Income share ratio (left hand scale) and Gini Coefficient (right hand scale) for 2003 (Scales were adjusted to make equal EU25 averages and dispersion for both indicators). Gini coefficient is not available for PT
0 2 4 6 8 10 12
SI SE HU CZ DK FI NO BG FR AT CY LU NL DE BE IT HR EU
2
5
EU
1
5
MT LT IE RO PL ES SK LV EE UK EL TR 15
20 25 30 35 40 45 50 55 %
S80/S20 quintile share ratio Gini coefficient
Source: Eurostat. See Table 1 and methodological notes for more detail on the different sources used. The EU25 and EU15 averages are calculated as a population-weighted average of the available national values.
Social protection decreases the relative poverty risk…
One important methodological principle for the selection of the commonly agreed indicators is that they must measure social outcomes rather than the means by which they are achieved. This is in line with the nature of the open method of co-ordination, whereby Member States agree on objectives but are left free to choose the policies by which these objectives are to be met. Furthermore, an indicator that measures policy effort is of little help if there is no way of knowing whether the effort is achieving its goal. The indicator of at-risk of poverty rate before social cash transfers does not strictly follow this rule given that, when compared to the poverty risk rate after social transfers, it can be seen as an input rather than output indicator (i.e. it aims at measuring the impact of national social transfers in reducing poverty risks). A comparison between the standard at-risk-of-poverty rate and the hypothetical situation where social transfers are
absent shows that such transfers have an important re-distributive effect that helps reduce the number of people who are at risk of poverty. Figure 5 compares the different at-risk-of-poverty rates before and after social transfers. In each country, these rates are calculated with the same threshold, namely the nationally-defined 60% threshold calculated on the basis of total household income, i.e. including all social transfers. In the absence of all social transfers, the poverty risk for the EU population as a whole would be considerably higher than it is in reality (40% instead of 16%). It can be argued that the prime role of old age (and survivors’) pensions is not to re-distribute income across individuals but rather over the life-cycle of individuals. If, therefore, pensions are considered as primary income rather than social transfers, the at-risk-of-poverty rate without all other social transfers is 25%.
Source: Eurostat. See Table 1 and methodological notes for more detail on the different sources used. The EU25 and EU15 averages are calculated as a population-weighted average of the available national values
Figure 5: At-risk-of-poverty rate for 2003 before any social transfers (top), after pensions (middle) and after all social transfers (bottom). Data are missing for the rate before any social transfers (top) in PT.
16 16 15 8 12 15 18 2 1 19 12 2 1 19
15 16 17 10 10 15 12 13 17 19 10 2 1 11 11 18 13 18 18 2 5 11 2 5 2 5
2 9 2 1
3 2
2 4 2 5 2 4 2 2
2 6 3 1
2 2 18
2 4 2 4 2 3 15 2 0 2 2 2 4 3 1 2 6 16
2 8 2 8 2 9 2 6
17 2 3
3 1 3 1 2 3 4 0 3 9
4 4 3 9
3 8 3 5
4 1 4 1 4 0 4 4 3 6 4 2 2 6 4 3 4 0 3 9 3 2 3 0 3 6 4 3 4 9 3 6 4 3 4 0 4 5 3 3 3 7 4 2 3 9 3 0 3 3 0 10 20 30 40 50 EU 2 5 EU 1 5
BE CZ DK DE EE EL ES FR IE IT CY LV LT LU HU MT NL AT PL PT SI SK FI SE UK BG RO HR TR NO
[image:4.595.53.551.533.683.2]————————————————————— 13/2005 — Population and social conditions — Statistics in focus 5
#"
Poverty rate Poverty gap Gini S80/S20 Belgium 15.2 [14.2,16.2] 22.3 [20.2,24.4] 28.3 [27.4,29.2] 4.3[4.1,4.5]
Denmark 11.7 [11.2,12.2] 15 [13.7,16.3] 24.8 [23.6,26] 3.6 [3.4,3.8]
Greece 21 [20,22] 30.5 [28.1,32.9] 35.1 [34.1,36.1] 6.6 [6.1,7.1]
Ireland 20.9 [19.8,22.0] 21.9 [20.0,23.8] 30.4 [29.6,31.2] 5 [4.7,5.3]
Luxembourg 10.1 [8.1,12.1] 19.4 [14.1,24.7] 27.6 [25.9,29.3] 4 [3.7,4.3]
Austria 13.2 [12.1,14.3] 19.5 [17.1,21.9] 27.2 [26.3,28.1] 4 [3.8,4.2]
-10 20 30 40 50 60 70
EL ES IT CY TR RO BG MT SK PT EE LT UK IE LV HU EU
1
5
EU
2
5
DE SI HR PL NL AT BE FR NO LU FI CZ SE DK
%
To assess more explicitly the effect of social transfers, Figure 6 shows the drop of the at-risk-of-poverty rate calculated before and after transfers for 2003 (expressed as a percentage of the “before transfers” rate) for transfers other than pensions. This drop is lowest in Greece (13%: from 24% to 21%),
Spain, Italy and Cyprus. It is highest in Denmark, Sweden, Czech Republic and Finland. These figures suggest a negative correlation between the impact of social transfers on poverty and the level of poverty incidence.
Source: Eurostat. See Table 1 and methodological notes for more detail on the different sources used. The EU25 and EU15 averages are calculated as a population-weighted average of the available national values.
The indicator of poverty risk before social transfers must be interpreted with some caution, as no account is taken of some other interventions that, like social cash transfers, can have the effect of raising the disposable income of households and individuals, namely transfers
in kind as well as tax credits and tax allowances. Furthermore, the poverty risk before social transfers is compared to the poverty risk after transfers keeping "all other things equal" – namely, assuming unchanged household and labour market structures.
The precision of the indicators…
For the first time in the history of EU social inclusion indicators, it is planned to compute systematic standard errors on the basis of the EU-SILC data. This gives an idea of the precision of the indicators and makes possible to estimate if international or infra-national differences are significant. In order to illustrate the precision of some of the indicators presented in this Statistics in Focus and based on EU-SILC data, Table 1 presents confidence intervals for the main indicators.
These figures give ground to the use of the indicators. For example, the total poverty rate is measured with a precision of +/-1% or less, with a probability of 95%. Note however that the range of the interval depends on the breakdowns and can be larger for subgroups for which the sample size is smaller. In particular, the confidence interval for the poverty gap is a bit larger. The inequality is also measured with a reasonable degree of precision.
More breakdowns…
In the common indicators list (see methodological notes), detailed breakdowns of the poverty risk (by age and gender, household type, activity status, work intensity of the household, tenure status) and
gender/broad age breakdowns of the other indicators (whenever relevant and meaningful) are also computed. This information is available on the Eurostat free dissemination database.
[image:5.595.36.571.144.323.2]Figure 6: Impact of other social transfers (than pensions) on the at-risk-of-poverty rate, total population, 2003
6 Statistics in focus — Population and social conditions — 13/2005 ————————————————————
#
E S S E N T I A L I N F O R MA T I O N – ME T H O D O L O G I C A L N O T E S
A new instrument…
During the period 1994-2001 the European Community Household Panel (ECHP) has traditionally been the primary source of data used for the calculation of these indicators in the field of Income, Poverty and Social Exclusion. The ECHP was a panel survey based on a standardised questionnaire that involved annual interviewing of a representative panel of households and individuals, covering a wide range of topics. It was developed by Eurostat in association with Member States. Further information on the characteristics of the survey and availability of data issued from it can be found at the following
address:http://forum.europa.eu.int/irc/dsis/echpanel/info/data/inform ation.html.
The ECHP is being replaced by the EU Statistics on Income and living conditions (EU-SILC), which is to become the reference source for statistics on income and living conditions and for common indicators for social inclusion in particular. While the ECHP was launched on the basis of a gentleman’s agreement, EU-SILC is organised under a Framework Regulation of the European Parliament and the Council (N°1177/2003). Technical aspects of the instrument are developed by Commission Implementation Regulations.
Survey design: Since improving timeliness has been one of the new tool’s core objectives, and because it is recognised that the longitudinal dimension takes more time in data production, EU-SILC will provide two types of annual data: cross-sectional and longitudinal data that will be treated according to different timetables. In this way, the cross-sectional and longitudinal data can conceivably come from separate sources, i.e., the longitudinal dataset does not need to be “linkable” with the cross-sectional dataset at the micro-level. Nevertheless, an integrated design ‘the rotational design’ is recommended by Eurostat for those countries planning to launch a new operation. This design aims to be the most cost effective and efficient for satisfying both the cross-sectional and the longitudinal requirements. Under this design the panel duration was reduced from 8 years (ECHP) to 4 years (the number of years of observations necessary for building the longitudinal common EU indicators). Consequently, the impact of cumulative attrition will be lower. The use of a rotational panel allows introduction in the sample of new population sub-groups each year (eg. immigrants), and as a result the cross-sectional data derived from this design will be richer than data derived from a pure panel.
Income: Compared to the ECHP income definition, the EU-SILC total household gross and disposable income and the different income components were redefined to follow as closely as possible the international recommendations of the UN ‘Canberra Manual’. A key objective of EU-SILC is to deliver robust and comparable data on total disposable household income, total disposable household income before transfers (except old age and survivor's benefits; including old age and survivor's benefits), total gross income and gross income at component level (in the ECHP, the income components were recorded net). This objective will be reached in two steps, insofar as Member States will be allowed to postpone the delivery of gross income at component level and of total household gross income data until after the first year of their operations.
Note also that new components of disposable income have been introduced in EU-SILC (Transfers paid to other households (only transfers received from other households were taken into account in the ECHP); Tax adjustment (only taxes paid at source were taken into account in ECHP); Taxes on wealth; Interest paid on mortgage loans; Imputed rent; Non-cash employee income; Value of goods produced for own consumption and Employers social insurance contributions). Furthermore, EU-SILC takes into account negative values of self-employment income, which were previously set to 0 in the ECHP. Some of these income components will be optional from the first year and compulsory from 2007 (Non-monetary components of employee (with the exception of company cars that is to be calculated as from the first year of the operation) and self-employed income; imputed rent and interest payments. Gross employers' social insurance contributions will only be included from 2007 if results of feasibility studies are positive. The content of some variables has also changed: (1) The social benefits do not contain the income from ‘individual pension plans’ (this component was included in theory in the ECHP) ; (2) Survivors’ and disability benefits paid after the standard retirement age are included in EU-SILC under ‘old-age benefits’ (and not in survivors’ and disability functions as in ECHP); (3) Early-retirement benefits paid for labour market reasons or in case of reduced capacity to work are included respectively under ‘Unemployment benefits’ or under ‘Disability benefits’ (and not in old age benefits as in the ECHP).
The income reference period is more flexible. While in the ECHP the income reference period was the previous year, the EU-SILC income reference period may be a fixed 12-month period (such as the previous calendar year or tax year) or a moving 12-month period (such as the 12 months preceding the interview) or be based on a comparable measure.
Quality criteria:To increase the quality level of the survey and its assessment, minimum effective sample size are required; country quality reports are foreseen and systematic standard errors for the income based indicators will be computed.
The EU-SILC project was launched in 2003 on the basis of a 'gentleman’s agreement', in six Member States (Belgium, Denmark, Greece, Ireland, Luxembourg, and Austria) as well as in Norway. The indicators computed on this basis have to be considered as provisional.
The starting date for the EU-SILC instrument under the aforementioned Framework Regulation was 2004 for the EU-15 (with the exception of Germany, Netherlands and the UK who have derogations until 2005) as well as for Estonia, Norway and Iceland. The New Member States with the exception of Estonia are allowed to start in 2005.Timetables for implementation in Acceding and Candidate Countries (Bulgaria, Croatia, Romania and Turkey) and in Switzerland are being discussed. The implications of this varying launch include the following:
‚ Micro data and cross-sectional indicators for 6 EU MS
were available end-2004; Data have to be considered as provisional;
‚ Micro data and cross-sectional indicators for 12 EU15 MS
+ Estonia will be available end- 2005;
‚ Micro data and cross-sectional indicators from for all the
————————————————————— 13/2005 — Population and social conditions — Statistics in focus 7
#"
National data sources to be used during the transition…
Therefore Eurostat launched a collection of indicators derived from national sources for former EU15 countries that did not launch EU-SILC in 2003. In parallel, the new MS and the ACC and CAN
[image:7.595.44.495.133.552.2]countries continue to participate in a project coordinated by Eurostat to supply comparable indicators derived from national sources. Table 1 presents the different sources used.
Table 1: Source of data to be used during the transition until EU-SILC
Country Source Survey year Income year
Czech Republic Microcensus 2003 2002
Germany GSOEP (Sozio-oekonomische Panel) 2003 2002
Estonia Household Budget Survey (Leibkonna Eelarve Uuring) 2003 2003
Spain Household Budget Survey (Encuesta Continua de Presupuestos Familiares) 2003 2002
France Tax Survey (Enquête Revenus Fiscaux) 2002 2001
Italy ECHP 2001 2000
Cyprus Household Budget Survey (Family Expenditure Survey) 2003 2003
Latvia Household Budget Survey (Majsaimniecibu Budzetu Petijums) 2002 2002
Lithuania Household Budget Survey (Namu ukiu biudzetu tyrimas) 2002 2002
Hungary Household Budget Survey (Háztartási Költségvetési Felvétel) 2002 2002
Malta Household Budget Survey (Household Budgetary Survey) 2000 2000
Netherlands Income Panel Survey (Inkomenspanelonderzoek) 2002 2002
Poland Household Budget Survey (Badania Budcetów Gospodarstw Domowych) 2003 2003
Portugal Reduced ECHP sample. Only limited indicators are available (at-risk-of-poverty
rates before and after transfers at level of total population; S80/S20)
2003 2002
Slovenia Household Budget Survey (Anketa o porabi v gospodinjstvih) 2002 2002
Slovakia Microcensus 2003 2002
Finland Income Distribution Survey (Tulonjakotilasto) 2003 2002
Sweden Survey of Living Conditions (ULF: Undersökning av levnadsförhållanden) 2002 2002
United Kingdom Household Budget Survey (Family Resources Survey) 2002/3 2002/3
Bulgaria Household Budget Survey 2002 2002
Croatia Household Budget Survey 2003 2003
Romania Household Budget Survey 2002 2002
Turkey Household Income and Consumption Expenditure Survey 2002 2002
Please note that discussions are ongoing with the Slovak Institute of Statistics concerning the quality of the data used. Indicators for Slovakia have therefore to be considered as provisional.
Note in Table 1 that although 2003-survey year/2002-income reference year was chosen as the common reference year to be coherent with the first EU-SILC wave, there are some exceptions. Note also that the income reference period is the same as the survey year for the national data sources in some countries.
In order to ensure the maximal comparability with indicators produced by countries launching EU-SILC, income definitions applied by countries for the production of indicators using national databases during the transition period should be as close as possible to the ones adopted for EU-SILC. During the transition period, for EU-15 Member-States, the indicators are based on the definition of income not including the variables which are only mandatory in EU-SILC from 2007, namely Imputed rent; Interest paid on mortgage; Value of goods for own consumption; Non-cash employee income; Employer’s social insurance contributions. For New Member States and Acceding/Candidate Countries,
income-in-kind is partly included in the total income definition, as it is considered to be a more substantial component of the disposable income for these countries than is the case for EU-15 Member States, meaning that its exclusion would have significantly underestimated the actual situation. ‘Income-in-kind’ covers goods produced directly by the household through either a private or a professional activity (e.g. own production of food by farming households or a household whose leisure activity is connected with agriculture; products from hunting or fishing; withdrawals from stocks by tradespeople, etc.). Services obtained free of charge as part of a professional activity are also classified as ‘benefits in kind’ (e.g. provision of housing, company vehicle, crèche facilities, free meals at work, etc.).
Further information:
Databases:
EUROSTAT Website/Home page/DataPopulation and social conditions
Population Health
Education and training Labour market
Living conditions and welfare
Household Budget Survey
Income and living conditions
Main indicators
Laeken indicators
Journalists can contact the media support
service:
Bech Building Office A4/017 L - 2920 Luxembourg Tel. (352) 4301 33408 Fax (352) 4301 35349
E-mail: eurostat-mediasupport@cec.eu.int
European Statistical Data Support:
Eurostat set up with the members of the ‘European statistical system’ a network of support centres, which will exist in nearly all Member States as well as in some EFTA countries.
Their mission is to provide help and guidance to Internet users of European statistical data.
Contact details for this support network can be found on our Internet site: www.europa.eu.int/comm/eurostat/
A list of worldwide sales outlets is available at the: Office for Official Publications of the European Communities.
2, rue Mercier L - 2985 Luxembourg