This is a repository copy of
Coupled-cavity terahertz quantum cascade lasers for single
mode operation
.
White Rose Research Online URL for this paper:
http://eprints.whiterose.ac.uk/79826/
Version: Published Version
Article:
Li, H, Manceau, JM, Andronico, A et al. (6 more authors) (2014) Coupled-cavity terahertz
quantum cascade lasers for single mode operation. Applied Physics Letters, 104 (24).
241102. ISSN 0003-6951
https://doi.org/10.1063/1.4884056
[email protected] https://eprints.whiterose.ac.uk/
Reuse
Unless indicated otherwise, fulltext items are protected by copyright with all rights reserved. The copyright exception in section 29 of the Copyright, Designs and Patents Act 1988 allows the making of a single copy solely for the purpose of non-commercial research or private study within the limits of fair dealing. The publisher or other rights-holder may allow further reproduction and re-use of this version - refer to the White Rose Research Online record for this item. Where records identify the publisher as the copyright holder, users can verify any specific terms of use on the publisher’s website.
Takedown
If you consider content in White Rose Research Online to be in breach of UK law, please notify us by
Coupled-cavity terahertz quantum cascade lasers for single mode operation
H. Li,1,a)J. M. Manceau,1,b)A. Andronico,1V. Jagtap,1C. Sirtori,1L. H. Li,2E. H. Linfield,2A. G. Davies,2and S. Barbieri1,c) 1
Laboratoire Materiaux et Phenome`nes Quantiques, Universit e Paris Diderot and CNRS, UMR 7162, 10 rue A. Domont et L. Duquet, 75205 Paris, France
2
School of Electronic and Electrical Engineering, University of Leeds, Leeds LS2 9JT, United Kingdom
(Received 25 April 2014; accepted 28 May 2014; published online 16 June 2014)
We demonstrate the operation of coupled-cavity terahertz frequency quantum-cascade lasers composed of two sub-cavities separated by an air gap realized by optical lithography and dry etching. This geometry allows stable, single mode operation with typical side mode suppression ratios in the 30–40 dB range. We employ a transfer matrix method to model the mode selection mechanism. The obtained results are in good agreement with the measurements and allow prediction of the operating frequency.VC 2014 AIP Publishing LLC. [http://dx.doi.org/10.1063/1.4884056]
Laser diodes exploiting the coupled-cavity (CC) geome-try where two sub-cavities are separated by an air gap were first demonstrated in the 1980s as a means for achieving sin-gle mode operation, alternative to distributed Bragg reflec-tors (DBRs) or distributed feedback (DFB) lasers.1–8 The attractiveness of this approach resides in its inherent fabrica-tion simplicity with, however, an important limitafabrica-tion given by the need to control the width of the air gap between the two sections with sub-wavelength precision in order to obtain single mode-operation with a high side mode suppres-sion ratio (SMR). In this work, we show that the CC tech-nique can be successfully implemented to obtain single mode emission for a quantum cascade laser (QCLs) operat-ing in the terahertz (THz) frequency range. Compared to the near-IR, the two orders of magnitude increase in wavelength considerably relaxes the difficulty in controlling the gap size and could help this technique to become a viable alternative to DFB resonators.9–13Indeed, we report single mode opera-tion in continuous wave (CW) with a SMR larger than 30 dB regardless of the pump current or operating temperature.
The QCL used in this work is based on the bound-to-continuum design active region, embedded in a single
plasmon waveguide, described in Ref.14. As shown
sche-matically in Fig.1(a), the two-section cavity consists of two waveguides, of lengths L1and L2, coupled by an air gap
real-ized by Inductively Coupled Plasma (ICP) etching. As an example, in Fig.1(b), we show an optical microscope image of a 4lm-wide air gap, etched to a depth of 15lm, and penetrating the whole QCL active region.14 To evaluate the effect of the gap on the guided mode, we used a 2-D finite
difference frequency-domain (FDFD) code developed
according to Ref.15. Two examples of the results obtained are displayed in Figs.1(c)and1(d), for gaps of width 6lm, and 20lm, respectively, the gap depth being kept constant at
15lm. Here, the pre-computed waveguide fundamental
mode is injected at position z¼z1, and the resulting squared
field distributions are shown in a logarithmic color scale (to
avoid reflections from the boundaries of the computational domain, we employed perfectly matched layers as discussed in Ref.15). It is clear that, as the gap width is increased from 6lm to 20lm, an increasing amount of energy is scattered towards the substrate, exciting higher order modes. From the point of view of laser operation, this power is therefore lost. In order to quantify such losses, we repeated the same simu-lation for different gap widths, evaluating the fraction of power that remains in the fundamental mode past the gap (at position z¼z2in Figs.1(c)and1(d)). This was obtained by
projecting the field at z¼z2onto the pre-computed
funda-mental guided mode, and by computing the power carried by that component (for the exact implementation see Ref. 16). As shown in Fig. 2, the fraction of transmitted power is observed to decrease rapidly to below 40% as the gap is increased from 0 to 20lm. To limit the scattering losses, we
FIG. 1. (a) Schematic cross section of the CC QCL. (b) Optical microscope photograph of a 4lm-wide air gap realized with ICP etching. The 11.5lm thick active region is separated from the semi-insulating GaAs substrate by a 300 nm-thick Al0.5Ga0.5As layer. This is visible in the photograph, as
indi-cated by the black arrow. (c) FDFD simulation results for air gap widths of 6lm (left) and 20lm (right). The squared electric field component along the x-axis is shown in logarithmic color scale.
a)
Electronic mail: [email protected]
b)Present address: Institut d’Electronique Fondamentale, Universit
e Paris Sud and CNRS, UMR 8622, 91405 Orsay, France
c)
Electronic mail: [email protected]
[image:2.612.322.554.469.671.2]therefore used gap widths of 4lm, 6lm, and 8lm for all the devices reported here.
To study the full CC device, we exploited an effective index, 1-D transfer matrix analysis described in detail in Ref.
17. The effective index in the waveguide sections was com-puted with COMSOL-Multiphysics, using the Drude conduc-tivity in the doped layers and the GaAs bulk permitconduc-tivity found in Ref.18at 2.5 THz.19For the real part of the effec-tive index inside the gap, we took a linear weighted sum of the material indices (n¼1 for air and n¼3.6 for the
semi-insulating GaAs), with weights being derived from the FDFD simulations by computing the integral of the normal-ized field intensity at mid gap in each material. For the gap widths of 4lm, 6lm, and 8lm used in this work, we obtain effective indexes of 2.8, 2.75, and 2.6, respectively. The imaginary part of the effective gap index was then deter-mined in order to account for the scattering losses described in the previous paragraph (see Fig. 2). Once the effective indexes are computed, the CC device can be described ana-lytically: interface matrices take into account the reflection and transmission coefficients at each interface, while propa-gation matrices describe the field propapropa-gation inside each section. By imposing the condition that there is no incoming light from outside the laser, one finally gets a complex prop-agation constant that provides the frequency of each longitu-dinal mode as well as its total losses.17
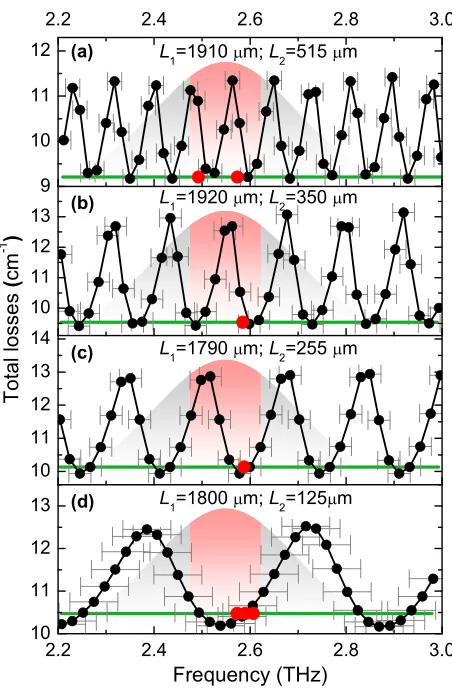
Figure3shows the total propagation losses (i.e., the sum of the material and radiative losses) as a function of the eigenmode frequency, obtained from the scattering matrix method for a selection of cavities with different widths of the air gap and lengths of the two cavities (we used material losses of 4 cm1). Results are presented corresponding to the lengths of the two cavities used experimentally (see below).
The error bars account for the 63lm uncertainty when
measuring the cavity lengths. From Fig. 3, the spacing
between two neighboring eigenfrequencies, although not constant, lies close to the free spectral range (FSR) of the long cavity (20 GHz).21At the same time, in all cases, we
observe a sizeable modulation of the losses with a quasi-periodicity close to the FSR of the short cavity
(315 GHz, 155 GHz, 115 GHz, and 80 GHz for cavity lengths of 125lm, 255lm, 350lm, and 515lm, respectively). In an effective mirror picture, this is produced by the etalon effect of the short cavity þair gap, which modulates the radiative
losses of the long cavity.5,8As a result, lasing action should occur in proximity to the loss minima, provided that these are not too far from the peak of the gain curve. To this end, to promote single mode operation, the distance between two loss minima should be somewhat larger than the typical las-ing bandwidth (or gain peak).8At the same time, however, increasing the separation between two minima/maxima will progressively reduce the curvature at the minimum of the loss curve, eventually leading to multimode operation when the loss difference between two neighboring eigenmodes is too small. For the active region used in this work, the typical lasing bandwidth of multimode Fabry-Perot cavity lasers can be up to 150 GHz (see Fig. 4(a));21 hence, the short cavity
length should not significantly exceed 250lm
[image:3.612.325.551.49.394.2](FSR155 GHz) or be too much below this value. The
FIG. 2. Fraction of power transmitted in the fundamental mode through the air gap computed using an FDFD code for gap widths up to 50lm. Inset. Same plot as main panel for gap widths up to 300lm.
FIG. 3. Total propagation losses obtained from the scattering matrix method for the CC devices used in the experiment. The lengths of each cavity are shown. From top to bottom panel, the air gap widths are of 6lm, 8lm, 6lm, and 4lm, respectively. The error bars account for the63lm uncer-tainty in determining the cavity lengths. Horizontal green lines correspond to the total losses of a Fabry-Prot cavity of length L1þL2. The red dots
rep-resent the experimental mode frequencies (see Figs.4and5). For devices corresponding to panels (b) and (c), we obtained single mode emission. The shaded Gaussians represent schematically a gain curve of 350 GHz FWHM, centered at 2.55 THz (the curve has no relation with the y-axis scale). The red center part is 150 GHz wide and represents the lasing band-width centered at 2.55 THz as derived from Fig.4(a). The value of the gain FWHM was taken from Ref.20.
[image:3.612.66.285.54.236.2]lengths chosen in Fig. 3, with a long cavity length (L1) of
1.8–1.9 mm, and short cavity lengths (L2) equal to 515, 350,
255, and 125lm should therefore provide an adequate set of devices to validate experimentally the mode selection mechanism.
Devices were first processed, using optical lithography and wet etching, into 160lm and 220lm-wide single
plas-mon waveguides. Air gaps (15lm deep), with widths of
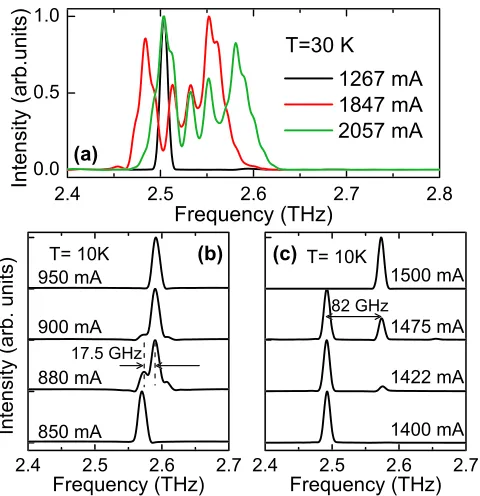
4lm, 6lm, and 8lm, were then realized using ICP dry etch-ing (Fig.1(b)). Finally, the devices were cleaved to obtain sections of the desired lengths. For their characterization, devices were indium bonded to a copper holder that was sub-sequently screwed onto the cold head of a continuous flow liquid-helium cryostat. As pointed out in the previous para-graph, at high pump currents the typical lasing bandwidths of the bound-to-continuum active regions used in this work can extend up to150 GHz.14,21To verify this we first fabri-cated conventional ridge cavity lasers, i.e., without air gap. A few representative emission spectra recorded at 30 K in
CW operation are displayed in Fig. 4(a) for a 4 mm-long,
160lm-wide ridge. Close to threshold (1260 mA) the emis-sion is single mode but (as expected) at higher currents the emission becomes strongly multimode with a center fre-quency of 2.50–2.55 THz, and a maximum lasing bandwidth
of 150 GHz is observed close to the maximum emitted
power.
Fig.4(b)shows four representative spectra of a CC QCL with cavity lengths L1¼1800lm and L2¼125lm, (see Fig.
3(d) for the corresponding loss modulation). Spectra were collected with a FTIR spectrometer with a resolution of 7.5 GHz. The QCL was driven in CW mode at a heat sink temperature of 10 K, with the top metal contacts of the two sections shorted using wire-bonds, as was the case for all the
presented CC devices. For currents up to approximately 850 mA (the threshold current, not shown, is of 700 mA), single mode emission is observed centered at 2.57 THz. When the drive current approaches 900 mA, however,
emis-sion switches to multimode, as shown in Fig. 4(b) at
I¼880 mA and 900 mA. For higher currents single mode
emission is then recovered at 2.59 THz and maintained up to the maximum emitted power at 950 mA. As shown by the red dots in Fig.3(d), the measured multimode spectrum lie, within the error of the frequency measurement, at the mini-mum of the loss curve between 2.5 and 2.6 THz.22The mode separation is17.5 GHz, which, within the spectrometer
re-solution, is also in agreement with the computed mode
spac-ing of 22 GHz derived from the Fig. 3(d). For this CC
device, the loss modulation curvature is therefore too weak to maintain single mode operation over the entire current operating range. Another situation where we observe multi-mode operation is displayed in Fig. 4(c), for L1¼1900lm
and L2¼515lm (see Fig. 3(a) for the corresponding loss modulation plot). Again, between pump currents of 1400 mA and 1500 mA, two modes appear, at 2.490 THz and 2.574 THz. As shown by the red dots in Fig. 3(a), the frequencies of these two modes correspond to two computed loss min-ima, and their difference of 82 GHz is in excellent agreement with the computed value of 84 GHz. In this case, despite
the curvature being sufficiently strong to prevent the simulta-neous lasing of neighbouring eigenmodes, two modes belonging to adjacent loss minima can be brought above
threshold simultaneously since they fall within the
150 GHz bandwidth.
Figure5shows the electrical and optical characteristics of a CC QCL with L1¼1790lm and L2¼255lm (see Fig.
3(c) for the computed loss modulation). In this case, single mode operation is achieved over the full operating current range (Fig. 5(b)). Indeed, as shown by the red dot in Fig.
3(c), the emission frequency of 2.58867.5 GHz is in very good agreement with the position of the loss minimum. Moreover, in this case, the distance between two loss minima
FIG. 4. (a) Measured emission spectra for a 4 mm-long, 160lm-wide Fabry-Perot cavity ridge at different pump currents. The device was driven in CW at a heat sink temperature of 30 K. (b) Emission spectra in CW mode of the CC laser corresponding to Fig.3(d). The ridge width is of 160lm. (c) Emission spectra in CW mode of the CC laser corresponding to Fig.3(a). The ridge width is of 220lm.
[image:4.612.55.295.51.299.2] [image:4.612.318.557.530.723.2]is160 GHz, i.e., almost double compared to Fig.3(a),
pre-venting bi-mode oscillation. From Fig. 5(b), the achieved SMR is between 30 and 40 dB regardless of the operating current. This is comparable to the best results reported in the literature for edge or surface emitting THz QCLs.10–14,22,23 We have also verified (not shown) that single mode emission is maintained up to the maximum operating temperature of 45 K. Furthermore, we find essentially the same result (i.e., stable single mode oscillation with similar SMRs) for the
de-vice corresponding to Fig. 3(b) (spectra not shown). We
therefore conclude that for a long cavity length of2 mm, single mode operation can be ensured by having short cavity lengths in the 250–350lm range.
For the L1 ¼ 1790lm and L2¼255lm device, pre-sented in Fig.5, the maximum emitted power at a heat sink temperature of 13 K is in excess of 3.5 mW. The latter was measured with a calibrated THz power meter and was not corrected for the polyethylene window transmission coeffi-cient (70%). In general, for all tested CC devices, we found
no significant degradation in performance compared to Fabry-Perot cavity devices, both in terms of threshold current and emitted power. To understand this further, it is instructive to compare the minima of the propagation losses in Fig. 3
with the losses of the bare Fabry-Perot cavities of the same lengths (¼L1þL2), displayed by the horizontal green lines.
In all four cases, the latter slightly exceeds those of the CC lasers. This means that when the reflectivity of the short cav-ity etalon reaches a maximum, the corresponding decrease in radiative loss more than compensates for the additional scat-tering loss introduced by the air gap (see Figs.1(c)–2). This effect can also be evaluated in the framework of an effective reflectivity approximation.8 For example, for the cavity lengths of Fig.3(c), we obtain an effective reflectivity of the combined air gapþ short cavity of 0.75, leading to a total
mirror losses of 4 cm1
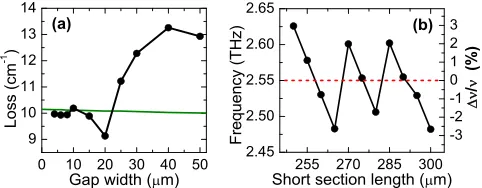
, i.e., significantly less than the 6 cm1 obtained for a Fabry-Perot cavity of the same total length (facet reflectivities of 0.3 on both sides).24This is the reason why for the gap widths used in this work (4lm, 6lm, and 8lm) we observe no significant change of the threshold current when compared to Fabry-Perot devices. This is unlike the situation for the plasmon-waveguided DFB THz QCLs demonstrated to date.9,11 Indeed, these devices rely on loss coupled gratings patterned on the top laser metallization that inevitably introduce significant additional losses (the increase in waveguide losses can be up to50%).9,11,25 In Fig.6(a),
we report the minimum of the total losses as a function of the gap width. As can be seen, the latter exceeds the losses of the Fabry-Perot cavity (solid green line) for gap widths larger than20lm (the cavity lengths are those of Fig.3(c)).
In Fig.6(b), we report the computed emission frequency as a function of the short cavity length. The former was extracted from the minimum of the computed loss curve, assuming that single mode operation is maintained. It can be seen that, in principle, it is possible to tune continuously the emission frequency by140 GHz by changing the short
cav-ity length from 250lm to 265lm, yielding a tuning coeffi-cient of10 GHz/lm (note that a change of gap width from 4lm to 20lm yields instead a maximum tuning of 30 GHz). A tuning of a few GHz can thus in principle be obtained using optical lithography. This is not the case for a THz
QCL DFB laser, where the tuning coefficient at 2.5 THz is
100–200 GHz/lm.9–11,25 In practice, to control the emis-sion frequency in the CC device precisely, one possibility would be to define a cavity length by lithography and then realize both facets by deep ICP etching into the substrate.
In conclusion, we have reported the operation of CC THz QCLs and shown that this geometry is capable of pro-viding robust single mode emission with SMRs in the 30–40 dB range. Changing the short cavity length allows in principle a fine tuning of the emission frequency over100 GHz, making of this technique a promising alternative to DFB gratings. The radiative loss modulation induced by the CC scheme could also be used as a method to obtain inte-grated anti-reflection coatings at the QCL facets for the real-ization of THz amplifiers.20,26
We thank Larry Coldren for providing useful information on CC lasers. We also wish to acknowledge partial financial support from the European Community under the FP7-ICT project TERACOMB, the ERC project TOSCA, and the UK Engineering and Physical Sciences Research Council.
1L. A. Coldren, B. I. Miller, K. Iga, and J. A. Rentschler,Appl. Phys. Lett. 38, 315 (1981).
2
E. Garmire, G. Evans, and J. Niesen,Appl. Phys. Lett.39, 789 (1981). 3
K. J. Ebeling, L. A. Coldren, B. I. Miller, and J. A. Rentschler,Appl. Phys. Lett.42, 6 (1983).
4L. A. Coldren, J. K. J. Ebeling, B. I. Miller, and J. A. Rentschler,IEEE J. Quantum Electron.19, 1057 (1983).
5
L. A. Coldren and T. L. Koch,IEEE J. Quantum Electron.20, 659 (1984). 6
C. H. Henry and R. F. Kazarinov, IEEE J. Quantum Electron.20, 733 (1984).
7
H. K. Choi, K.-L. Chen, and S. Wang,IEEE J. Quantum Electron.20, 385
(1984).
8
L. A. Coldren, S. W. Corzine, and M. L. Mashsanovitch, Diode Lasers and Photonic Integrated Circuits, 2nd ed. (John Wiley and Sons, New York, 2012), Chap. 3.
9
L. Mahler, A. Tredicucci, R. K€ohler, F. Beltram, H. E. Beere, and E. H. Linfield,Appl. Phys. Lett.87, 181101 (2005).
10B. S. Williams, S. Kumar, Q. Hu, and J. L. Reno, Opt. Lett.30, 2909
(2005).
11
O. Marshall, J. Alton, C. Worrall, H. Beere, D. A. Ritchie, and S. Barbieri,
IEEE Photonics Technol. Lett.20, 857 (2008).
12M. I. Amanti, G. Scalari, F. Castellano, M. Beck, and J. Faist, Opt. Express18, 6390 (2010).
13
C. Sirtori, S. Barbieri, and R. Colombelli,Nat. Photonics7, 691 (2013). 14
S. Barbieri, J. Alton, H. E. Beere, J. Fowler, E. H. Linfield, and D. A. Ritchie,Appl. Phys. Lett.85, 1674 (2004).
15
C. Yu and H. Chang,Opt. Express12(7), 1397–1408 (2004).
FIG. 6. (a) Total losses vs gap width for the CC device of Fig.3(c). The black dots correspond to the minimum of the computed losses close to 2.55 THz. The solid green line represents the total losses of a Fabry-Perot device of the same total length. (b) Computed emission frequency as a function of short section length for the CC device of Fig.3(c). The emission frequency is taken from the minimum of the computed losses close to 2.55 THz. The right axis represents the fractional frequency tuning from 2.55 THz (dashed red line).
[image:5.612.318.559.54.148.2]16W. K. Gwarek and M. Celuch-Marcysiak,IEEE Trans. Microwave Theory Tech.51, 1920 (2003).
17
M. Giehler, H. Kostial, R. Hey, and H. T. Grahn,Appl. Phys. Lett.91,
161102 (2007).
18Handbool of Optical Constants of Solids, edited by E. D. Palik (Academic
Press, San Diego, 1998).
19
Since all the lasers studied in this work operate close to 2.5 THz, we neglected dispersion and used only the effective index at this frequency. This is a good approximation since from 2 THz to 3 THz, we compute variations of the real and imaginary part of the effective index of less than 1% and 10%, respectively.
20
R. Rungsawang, N. Jukam, J. Maysonnave, P. Cavalie, J. Madeo, D. Oustinov, S. S. Dhillon, J. Tignon, P. Gellie, C. Sirtori, S. Barbieri, H. E. Beere, and D. A. Ritchie,Appl. Phys. Lett.98, 101102 (2011).
21
P. Gellie, S. Barbieri, J.-F. Lampin, P. Filloux, C. Manquest, C. Sirtori, I. Sagnes, S. P. Khanna, E. H. Linfield, A. G. Davies, H. Beere, and D. Ritchie,Opt. Express18, 20799–20816 (2010).
22Note that for the curves of Fig.3the effective index in the waveguide
sec-tions was changed by 2.5%, from the computed 3.61, obtained using the Drude conductivity and the GaAs bulk index from Ref.18, to 3.52. The latter gave the best possible matching between the measured lasing fre-quencies of all devices (red dots in Fig.3) and the loss minima. At the same time, this correction lies well within the error of the computed index that we estimate to be at least 10%.
23G. Xu, R. Colombelli, S. P. Khanna, A. Belarouci, X. Letartre, L. Li, E. H.
Linfield, A. G. Davies, H. E. Beere, and D. A. Ritchie,Nat. Commun.3, 952 (2012).
24
For the calculation of the effective reflectivity, we used material losses of 4 cm1in the cavity sections and of 435 cm1in the gap to account for
the scattering loss (see text).
25
P. Gellie, Ph.D. thesis, University of Paris-Diderot, 2012.
26