This is a repository copy of Vibration damping in bolted friction beam-columns. White Rose Research Online URL for this paper:
http://eprints.whiterose.ac.uk/80970/ Version: Submitted Version
Article:
Bournine, H., Wagg, D.J. and Neild, S.A. (2011) Vibration damping in bolted friction beam-columns. Journal of Sound & Vibration, 330 (8). 1665 - 1679. ISSN 0022-460X https://doi.org/10.1016/j.jsv.2010.10.022
Reuse
Unless indicated otherwise, fulltext items are protected by copyright with all rights reserved. The copyright exception in section 29 of the Copyright, Designs and Patents Act 1988 allows the making of a single copy solely for the purpose of non-commercial research or private study within the limits of fair dealing. The publisher or other rights-holder may allow further reproduction and re-use of this version - refer to the White Rose Research Online record for this item. Where records identify the publisher as the copyright holder, users can verify any specific terms of use on the publisher’s website.
Takedown
If you consider content in White Rose Research Online to be in breach of UK law, please notify us by
Vibration damping in bolted friction beam-columns
Hadjila Bournine , David J. Wagg, Simon A. Neild1
Department of Mechanical Engineering, University of Bristol, Bristol, U.K, BS8 1TR
Abstract
In this paper we consider dynamic friction within a bolted structure
delib-erately used to improve damping properties of the structure. The structure
considered for this paper consists of two steel beam-columns bolted together
allowing dynamic friction to occur at the interface. This paper includes an
analysis of the behavior of the structure and the effect of friction on its
dy-namics. It also includes an analysis of the energy dissipation in the structure
by means of friction and the optimization of the bolt tension in order to
dis-sipate the maximum vibration energy by the structure. We define analytical
expressions for the vibration behaviour before and after slip occurs as well as
the point at which it starts. We also define the stress profile across the
col-umn cross-section. An experiment was designed to allow the measurement of
the bolt tension, the slip within the structure and the bending velocity. The
theoretical analysis gave very close agreement with the experimental results.
1. INTRODUCTION
In this paper we consider the effect of friction on the dynamics of a
vi-brating beam-column. The results presented here are based on the idea of
using bolted friction beam-columns to add damping during large amplitude
motion. The set up consists of two steel beam-columns bolted together
al-lowing dynamic friction to occur at the interface. This type of system has
been shown to dissipate a large amount of vibration energy [1] when the bolt
tensions are adjusted appropriately. The concept is similar to leaf springs
which have been in practice for some considerable time [2]. Potential
applica-tions are structures with very low damping characteristics such as large steel
structures (i.e. steel framed buildings). Consequently these structures are
particularly sensitive to dynamic excitation from wind or seismic loading. In
some cases relatively small loadings can induce considerable lateral vibration
that can result in damage to the structure.
The usual approach to providing more damping in a structure is to add
some form of structural dampers, which can be either passive or semi-active.
For seismic applications a common way to apply more passive damping is
in the form of base-isolation, which is achieved by using rubberised mounts
to isolate the structure from its foundations. Other passive damping designs
include special bracing mechanisms [3, 4] or devices fitted between columns
mechanisms based on friction are described in [9, 10, 11, 12]. An extended
overview of a large part of the literature on friction damping systems is
presented in [13, 14].
A similar system has been previously considered by Popp et al [1] where
the optimum normal force required was defined based on the maximum
dis-sipated energy. To work effectively, the bolted friction column must be
de-signed with the appropriate bolt tensions to dissipate significant vibrational
energy when dynamically excited. The friction damping effect only occurs
when static friction at the interface of the beam-column is overcome, and
can therefore be designed to happen only under large amplitude motion. For
example for protecting the structure in extreme circumstances, such as an
earthquake. At all other times the structure operates in its usual low damping
regime. The potential advantages are that this method is simple, relatively
cheap and reduces the need for active dampers or additional cross-bracing.
The theoretical analysis presented in this paper includes two physical
approaches. The first one deals with the structural analysis of the
beam-column. In Sec. 2.5 , we develop expressions for the vibration modes based
on the dynamics of friction at the interface. The second approach ( Sec.
2.3) is based on the optimum energy dissipation by the structure. We derive
analytical expressions for the energy dissipated by friction and its effect on
experiments which we describe in section 3. The experimental results show
a good agreement with the analytical predictions.
2. Analytical model
The bolted friction beam-column used in the following analysis involves
two steel beams bolted together as shown in Fig. 1. It is assumed that the
pressure applied by the bolts is approximated by a continuously distributed
load along the beam-column.
2.1. Relative displacement
We consider the case of two steel columns, with rectangular cross-section,
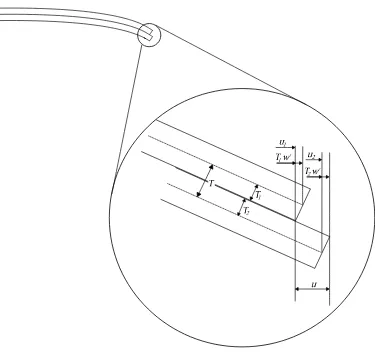
clamped back-to-back. When the clamped columns deflect, slip may occur
along the interface between beam1 and beam2. This is a result of the
dif-ference in the beams radii of curvature due to their thickness as shown in
Fig 2. Fig. 3(a) shows the relative displacement at the tip of the beam. ui
is the displacement of the centreline of beami due to axial loading and w
is the lateral deflection of the whole beam-column. Therefore, the relative
displacement can be expressed as
u=u2−u1+w′T, (1)
where w is the beam deflection, T is the distance between the centrelines
one, and the dash “ ′ ” represents partial differentiation with respect to x.
This value will vary depending on the bolt tension applied as the higher the
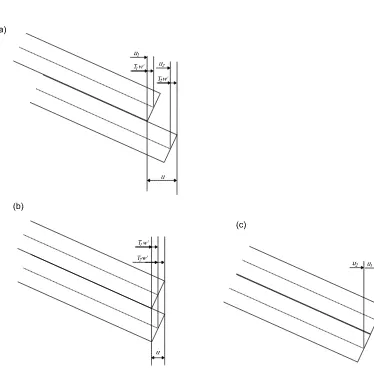
tension the less readily slip will occur. In the case of full slip, we assume
compatibility in the beams deflection i.e. the central axes of the two beams
are assumed to be at the same distance in the axial direction as shown in Fig.
3(b). Therefore, the only relative displacement along the column is due to
the bending itself. In the case of full stick, there is no relative displacement
at the interface as shown in Fig. 3(c). In the analysis only the cases of full
stick or full slip will be considered. By differentiating Eq. 1 with respect to
x to obtain the relative displacement distribution along the beam, we obtain
u′ =ǫ
2−ǫ1+w′′T, (2)
whereǫ is the strain due to the normal force,
ǫi =Pi/EiAi, (3)
Pi is the axial load ofbeami and Ai is the cross sectional area ofbeami.
2.2. Friction Model
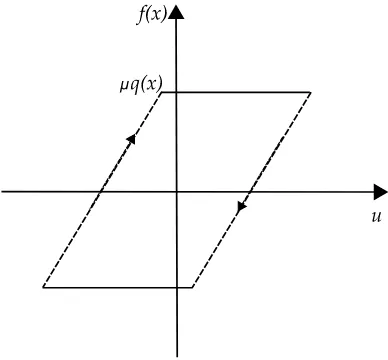
The friction model assumed here is a Coulomb type model. The friction
force at the interface f(x) over a single period of vibration, is assumed to
be a function of the relative displacement u between the two beams. As
hysteresis is approximated by a parallelogram with respect to the relative
displacement, this is a reasonable approximation if the column is undergoing
harmonic vibration. In all cases, the friction force is assumed to be linearly
related to the relative displacement, therefore can be expressed as
f(x) = b+ku, (4)
where b and k are constants that take different values depending on each
stage of the hysteresis and u is the relative displacement between the two
beams. In this paper two distinctive cases are considered, the first one is the
case of full slip has b =sign( ˙x)µq(x), where µis the friction coefficient and
q(x) is the normal load at the interface surfaces. The second case is the full
slip phase.
2.3. Energy Balance Model
The energy considered in this case is the bending energy and the work
done by friction. We assume that the viscous damping is negligible in
com-parison to the friction damping. All the assumptions made before are also
assumed for this analysis.
We assume that the deflection of the beam can be described using the
following equation
w=W1−cos(π 2lx)
where W is the time dependent deflection magnitude at the free end of the
of the beam-column.
For our beam-column, the bending stiffness for a single beam is EI.
Therefore the potential energy due to bending for the whole beam-column,
is defined as
Vb = 2
Z l
0 1 2EI(w
′′)2
dx
= EIπ
2
32l (W
2
). (6)
Next, we define the energy dissipated by friction. For any structure,
the work done by friction is defined as the product of the friction force and
the distance traveled. In the case of our beam-column, the friction force is
f(x) and the distance is the relative displacement between the two beamsu,
therefore the work done
Uf =−
Z t2
t1 Z l
0
µq(x)udxdt, (7)
where µis the coefficient of friction. Now, we need to determine Uf in terms
of the beam-column vibration using Eq. 1. Under pure bending and the full
therefore Eq. 7 becomes
Uf =−
Z t2
t1
Z l
0
µq(x)T w′dxdt
=
Z t2
t1
µq(x)T W(t)dt. (8)
At this stage, we have the energy quantities and we need to apply it to
our beam-column. To analyse the effect of the energy dissipation on the
beam-column vibration, we write the energy expressions at time ti at full
deflection as shown in Fig. 5 where the beam-column has no kinetic energy
and ti+1 =ti+π/wn (after half a period, where again the beam-column has
no Kinetic energy). Then we apply the energy conservation principle which
results in
(EIπ
2
32l )(W
2
i+1−W 2
i) = µq(x)
T wn
(Wi+1−Wi), (9)
where Wi is the tip deflection at time ti and Wi+1 at ti+1. If the deflection
Wi is known, equation 9 can be used to predict the deflection Wi+1 at time
ti+1. Therefore Eq. 9 can be used to predict the maximum deflection of the
beam-column in every half period increment.
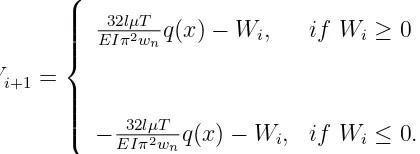
2.4. Simulation Of The Energy Balance Model
The theoretical model was simulated in a Matlab program . Initially the
envelope of vibration is determined which is based on the dominant damping.
During the cycles where friction damping is predominant, Eq. 9 was modified
Wi+1 = 32lµT
EIπ2wnq(x)−Wi, if Wi ≥0
−EIπ32lµT2wnq(x)−Wi, if Wi ≤0.
(10)
Eq. 10 are used to determine the maximum deflection over every half a
period of time as shown in Fig. 5. During cycles where the beam-column
is in stick phase, the envelope was based on only viscous damping which
was determined experimentally (Fig. 13). To define the transition between
predominant friction damping to viscous damping, we need to know the
conditions that cause the transition from slip to stick. From Eq. 10 we can
see that the friction damping is no longer effective when
|W∗ i | ≤
8lµT EIπ2w
n
q(x), (11)
2.5. Dynamic Response Model
In this section, we determine the structural properties of the
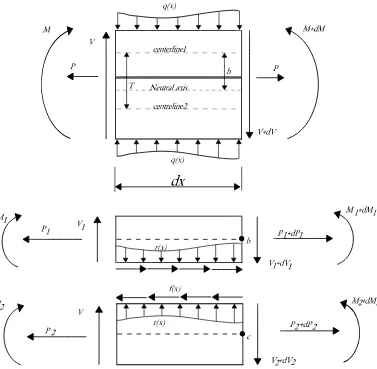
beam-column. First, we relate the internal forces and reactions within the structure
to its deflection under different friction regimes. The forces acting along the
beam-column are shown in the free body diagram of a differential element in
Fig. 6. The beam-column is assumed to be under a transverse and an axial
[image:10.595.204.414.139.216.2]loading.
Fig. 6 shows that the forcesP andV and momentM acting on the whole
separately. The internal moments acting on each beam are still taken about
the neutral axis of the whole structure. The moment acting on the whole
structure on the left hand side can be expressed in terms of the internal forces
and moments as follows
M =M1+M2+P(T −h)−P1T, (12)
where T is the distance between the centrelines of the two beams and h is
the distance between the centreline of the top beam and the neutral axis of
the structure (Fig. 6). Note also P =P1+P2.
The reactions within each beam can be related to its deflection by
con-sidering compatibility, i.e the lateral deflection at any point on the top beam
is equal to the deflection of the lower beam. This can be expressed using
beam theory [15] as follows
d2
w dx2 =w
′′ =− M1
E1I1
=− M2
E2I2
. (13)
Combining Eq. 12 and 13 results in
w′′ =−M −P(T −h) +P1T
E1I1+E2I2
. (14)
In Eq. 14, P1 is unknown and further assumptions are needed to define
it. Differentiating P1 and P2 with respect to xwill result in the friction force
at the interface per length, f(x) [1]
P′
and
P′
2 =f(x). (16)
From this point on, the beams are assumed to be identical, i.e. A1 =
A2 =A and I1 =I2 =I.
Differentiating Eq. 14 with respect to x and combining it with Eq. 15
results in
f(x) = 2EA
T W
′′′+ 1
TM
′. (17)
It should be noted thatP is constant alongx. Differentiating Eqs. 2 and
4, and combining them with Eqs. 3, 15 and 16 leads to
f(x)′′ =k 2
EAf(x) +kT w
′′′. (18)
Combining Eqs. 17 and 18 results in
w′′′′−kαw′′ =kβM −λM′′, (19)
where for identical beams α= 1
2E(
AT2+4I AI ),β =
1
E2IA and λ =
1
2EI.
All the equations, derived so far, describe static conditions. To describe
dynamic conditions we relate the moment to the dynamic deflection. Under
free vibration, the moment is related to the transverse displacement as follows
[15]
∂2
M
∂x2 =−m
∂2
w
∂t2 , (20)
2.5.1. The effect of friction on the beam-column dynamics
Defining the constant of frictionkis one task that can be done only
experi-mentally therefore it will be assumed to take different values depending on the
friction-displacement relation described in Fig.4. The friction-displacement
parallelogram can be divided into sticking and slipping phases. During the
sticking phase, the two beams act as one. Therefore, we assume that the
change in relative displacement uis negligible regardless of the friction force
magnitude f(x). Consequently k → ∞, and equation 19 can be rewritten in the following form
w′′=−β
αM. (21)
Differentiating Eq. 21 twice with respect tox and combining it with Eq. 20
results in
∂4
w ∂x4 =−
2m E(4I+T2A)
∂2
w
∂t2 , if f(x)≥µq(x) . (22) Eq. 22 describes the transverse vibration of a single beam with the same
size of our beam-column with no viscous damping. This means that in the
absence of slip at the interface, the beam-column acts as a single beam.
Equation 22 can be solved exactly — see for example [16].
The second phase in the friction-displacement parallelogram is the
slip-ping phase which is only achievable if the static friction between the columns
is overcome, i.e.
where q(x) is the loading applied by the bolts. To operate effectively, the
bolted friction beam-columns must be designed with the appropriate bolt
tensions to dissipate significant vibration energy when dynamically excited.
The tension in the bolts needs to be selected to allow slipping to take place
under external vibration. Therefore, it is required to define the relation
between the beam dynamics and the bolt tension. First, the friction force
f(x) at the interface needs to be expressed in terms of the moment as follows
f(x) = T A
T2A+ 4IM
′. (24)
Combining Eq. 23 and 24 results in the optimal load q∗(x) at which the
beam-column transfers from slip to stick
q∗(x)≤ T A
µ(T2A+ 4I)M
′. (25)
Once the bolt tension reaches the optimum value the beam-column crosses
from slipping to sticking phase. During the slipping phase the friction force is
assumed to be constant regardless of the magnitude of the relative
displace-ment, therefore k→0. The differential equation Eq. 19 can be simplified to the following form
w′′′′ =−λM′′. (26)
At this stage the neutral axis moves from the single line in Fig. 6 to two
different neutral axes within each beam. We assume that the beams still
f rac∂4
w∂x4
=− m
2EI ∂2
w
∂t2 , if f(x)≥µq(x) . (27) Eq. 27 represents the vibration of a beam with a bending stiffness double
the stiffness of each column and it can be solved exactly see for example [16].
2.6. Simulation Of The Dynamic Response Model
As noted earlier, the model described in Sec. 2.4 provides amplitude
data at a time resolution of half a period. In order to calculate the response
at a higher time resolution a time stepping simulation was developed. The
rest of the modeling in Fig. 5 was based on a time step calculation. Every
step of time ∆t the friction force at the interface is calculated. Then the
stick-slip phase is determined based on equation 1 and the stiffness of the
column is calculated as well as the frequency of vibration as explained in Sec.
2.5. Then, the temporal function of the vibration,, is calculated using the
following Eq.
w =W ∗(cos(wnt−Φ)), (28)
where W is the maximum deflection in every period of time calculated from
Eq. 10, wn is the natural frequency and Φ is the phase shift calculated based
on the change in stiffness that occurs from one time step to another.
during full slip phase is then calculated based on Eq. 1. During full stick, it
is calculated based on
ui =ui−1, (29)
whereui, ui−1 are the relative displacement at time ti and time ti−1.
The theoretical models in Fig 9 and 10 are calculated using this model.
3. Experimental Results
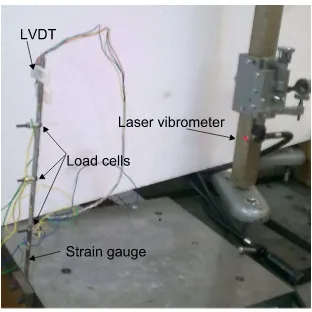
3.1. Set Up
The experimental set up consists of a single friction column composed of
two beams (Fig. 7) pressed against each other using a set of three bolts. The
properties of each beam are listed in appendix A. We monitored the normal
pressure applied by the bolts using load cells. The beam column pressure
was increased gradually and from 0N to 140N per bolt. Every time the
tension in the bolts was increased, we deflected the column and released it
from the deflected position. The velocity at which the structure vibrates was
measured using a laser vibrometer as shown in Fig. 7. We also installed a
number of strain gauges on the outer surfaces of the beams as shown in Fig.
7 to monitor the stress magnitudes as the beam-column vibrates.
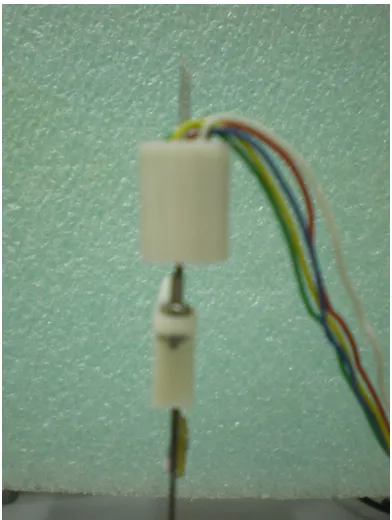
The relative displacement between the two beams was measured using a
of the beam-column as shown in Fig. 7. The top part of the LVDT was fixed
to the outer surface of beam 1 while the bottom part of it was fixed on the
outer surface of beam2, see Fig. 8 The measurements taken from the LVDT
give the total slip from the clamped end up to the point where the LVDT
is installed during the full slip phase. During full stick phase, the LVDT is
supposed to record zero as the lateral planes remain normal to the neutral
axis of the beam.
4. Results and Discussion
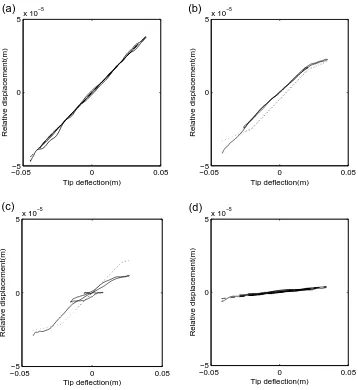
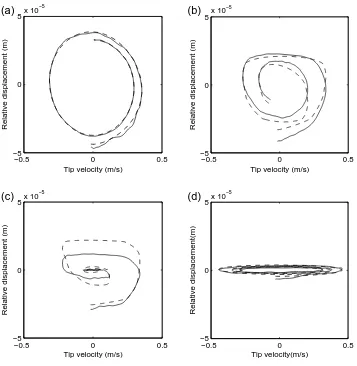
4.1. Relative Displacement Results
The relative displacement depends on the friction dynamics in the column
as described in Sec. 2.1. The experimental results show three cases. First,
under low bolt tension, the structure is in full slip condition all the time
(Fig. 9(a)). At this stage, the relative displacement measured by the LVDT
shows a good agreement with the theoretical values calculated from Eq. 1.
Under high bolt tension the column is in stick mode all the time (Fig. 9(c)).
The relative displacement measured by the LVDT at this stage is due to the
slip that takes place between the top bolt and the position of the LVDT. In
between the two extreme cases, the column crosses from stick to slip mode
in every period of vibration. The relative displacement measurements taken
column is in sticking regime and when the velocity reaches the maximum
value the column switches to slipping regime.
The theoretical model is a combination of the slip then stick motion based
on Eq. 24 and when this reaches the requirement in Eq. 23, the column starts
to slip.
The difference between the measurement and theoretical relative
displace-ment in Fig. 10(a) and (b) is due to the fact that during slipping condition,
the column is not really in full slip whereas the theoretical simulations assume
full slip.
4.2. Validation Of The Theoretical model
The mechanical properties of the specimen used in both the experimental
set up and modeling are given in Fig. 7.
Eq. 10 was used in a numerical model repeatedly to determine the
en-velop of vibration as explained in Sec. 2.4. Despite the simplicity of the
model, it is clear that the theoretical predictions agree very well with the
experimental results. For example, we can see in Fig. 11 that the
vibra-tion magnitude and duravibra-tion is visibly reduced as the loadq(x) is increased.
After a number of cycles it seems that the experimental results converge to
zero whereas the theoretical predictions continues to have a small oscillation.
The reason for that is that during the first cycles of vibration, the friction
predictions. However, when a certain magnitude of vibration is reached, slip
(i.e dynamic friction) no longer occurs and the friction damping drops quickly
to near zero. At this stage the beam-column starts acting as a single beam
with predominant viscous damping which is not included in theoretical
mod-eling. whereW∗
i is the critical vibration amplitude at which the slip to stick
transition occurs. It can be seen that increasing the bolt tension q(x) results
automatically in the increase of W∗
i. As the bolt tension increases, more
relative displacement is required for slip to occur. Hence, slip starts failing
at higher vibration magnitudes, and the column starts behaving as a single
beam with only viscous damping. This can be clearly seen in Fig. 11(b),
where slip fails at higher vibration amplitudes and friction damping becomes
increasingly less effective. Consequently, vibration takes increasingly longer
to converge when bolt tension is increased.
4.3. Frequency analysis
The frequency at which the column vibrates is a proportional to its
stiff-ness. From Eq. 22 and 27, the column stiffness during full stick condition
is double its value during full slip. Therefore, the natural frequency of the
beam-column vibration is expected to double as it operates within the
stick-ing phase. This analysis was confirmed by the frequency analysis run on the
experimental results and shown in Fig. 12(a). Before the full stick status is
Taking the frequency of the whole time response in one does not show how
the frequency changes for a given bolt tension, it merely reveals the
domi-nant frequency (Fig. 12). Inspection of results from column vibrating within
stick-slip condition shows that over a single cycle of vibration, the frequency
starts closer to the full slip case, i.e. low frequency. As the maximum
deflec-tion per cycle decreases the column goes into the full stick regime therefore
the frequency increases (Fig. 14(b)).
4.4. Damping properties
The presence of dynamic friction at the interface has clearly improved the
damping in the structure. Friction damping is typically characterized by a
linear decay envelope of the vibration until a threshold for sticking is achieved
and dynamic friction fails [17]. However in order to compare with viscous
damping, we approximate the decay by an exponential decay curve over
the first three periods of vibration as shown in Fig. 13(a). The equivalent
damping ratio as the bolt tension is increased is displayed in Fig. 13(b).
The equivalent overall damping displayed in Fig. 13(b), shows a significant
improvement of the damping properties in the beam-column when the bolt
tension is properly adjusted. in fact, the equivalent damping ratio around the
optimum bolt tension is approximately ten times higher than the inherent
5. Conclusions
This paper includes an analysis of the friction damping present in a
col-umn composed of two beams bolted together. The analysis and the
experi-mental results confirmed that dynamic friction can be used to improve the
damping properties of the beam-column considerably. A full analysis was
provided explaining the effect of friction on the dynamics of the beam
col-umn and how that changes as the tension in the bolts is varied. Under low
bolt tension, the column has the properties of a single beam with normal
exponential decay whilst for high bolt tension, the column has the properties
of a beam twice as thick as a single beam. This was confirmed by the changes
in natural frequency of the beam-column under both conditions. During the
cycles where dynamic friction is present and bolt tension is appropriately
ad-justed, friction damping can be as much as ten times higher than the inherent
viscous damping.
ACKNOWLEDGMENTS
Hadjila Bournine is sponsored by the Algerian ministry of higher
References
[1] L.Panning, K.Popp, W.Sextro, Vibration damping by friction forces:
Theory and applications. Journal of Vibration and Control, 9:419–448,
2003.
[2] S.P.Timoshenko, History of strength of materials :with a brief account of
the history of theory of elasticity and theory of structures. McGraw-Hill,
1953.
[3] I.H.Mualla, B.Belev, Performance of steel frames with a new friction
damper device under earthquake excitation. Engineering Structures,
24(3):365–371, March 2002.
[4] J.H.Park, B.W.Moon , K.W. Min, S.K. Lee, C.K Kim, Cyclic loading
test of friction-type reinforcing members upgrading wind-resistant
per-formance of transmission towers. Engineering Structures, 29(11):3185–
3196, November 2007.
[5] C.G.Cho, M.Kwon. Development and modeling of a frictional wall
damper and its applications in reinforced concrete frame structures.
Earthquake Engineering & Structural Dynamics, 33(7):821–838, 2004.
struc-tural analysis and design. Engineering Structures, 17(3):187–197, April
1995.
[7] Z.M.Law, S.S.Wu, S.L.Chan, Analytical model of a slotted bolted
con-nection element and its behaviour under dynamic load. Journal of Sound
and Vibration, 292(3-5):777–787, May 2006.
[8] Y.C.Kurama, B.G.Morgen, Characterization of two friction interfaces
for use in seismic damper applications. Materials and Structures,
42:3549, 2009.
[9] L.Gaul, R.Nitsche, Friction control for vibration suppression.
Mechani-cal Systems and Signal Processing, 14(2):139–150, March 2000.
[10] R.Nitsche, L.Gaul, Smart friction driven systems. Institute of physics
publishings, smart materials and structures, 14:231236, 2005.
[11] S.Hurlebaus, J.Wirnitzer , L.Gaul, H.Albrecht, Enhanced damping of
lightweight structures by semi-active joints. Acta Mechanica, 195(
1-4):249–261, 2008.
[12] B.F.Jr.Spencer, S. Nagarajaiah, State of the art of structural control.
Journal of Structural Engineering, 129(7):845–856, 2003.
[13] D.J. Segalman, Modelling joint friction in structural dynamics.
[14] E.J.Berger, Friction modeling for dynamic system simulation. Applied
Mechanics Reviews, 55(6):535–577, 2002.
[15] J.M.Gere, Mechanics of materials. Thomson, Book/cole, 6th edition,
2004.
[16] W.T.Thomson, M.D.Dahleh, Theory of vibration with applications.
Chapman & Hall, 1993.
[17] L.N.Virgin, Introduction to Experimental Nonlinear Dynamics.
Cam-bridge University Press, 2000.
List of Figures
1 Bolted friction beam-column, with two beams and three bolts. 26
2 The total relative displacement between the two beams at the
free end of the column. . . 26
3 The total relative displacement between the two beams at the
free end of the column, (a) The general case, the beam under
axial loading and bending, (b) under pure bending and full
slip, (c) under pure bending and full stick. . . 27
4 The assumed friction model,− − − sticking phase, — slipping
5 The model simulation,
•
defined using the energy
bal-ance model, — calculated using dynamic response
model.
. . . 286 The forces acting withing the beam-column . . . 29
7 The experimental set up, column dimensions: 0.3m×0.0125m×
0.0005m, Young’s modulus : E = 167GP a, Density: ρ =
6970kg/m3
and coefficient of friction: µ= 0.3. . . 30
8 The LVDT used in the experiments. . . 31
9 The total relative displacement between the two beam-columns
at the free end of the column versus the tip deflection, (a)
aver-age bolt tension 0 N, (b) averaver-age bolt tension 23 N, (c) averaver-age
bolt tension 36N, (d) average bolt tension 112N.
− − −theoretical value based on the theoretical tip deflection, ——– the relative displacement measurement from the LVDT . 32
10 The total relative displacement between the two beam-columns
at the free end of the column versus tip velocity, (a) Average
bolt tension 0 N, (b) average bolt tension 23 N, (c) average
bolt tension 36N, (d) average bolt tension 112N.
− − − theoretical value based on the the theoretical tip de-flection, ——– the relative measurement as measured by the
11 The dynamics of the beam-column as the tension in the bolts
is increased, (a) average bolt tension= 0 N, (b) average bolt
tension= 17.3 N (c) average bolt tension = 33.1 N(d) Average
bolt tension = 46 N (e) average bolt tension = 112N
− − − theoretical values , ——– the relative displacement measurement from the LVDT. . . 34
12 The vibration frequency of the beam-column under different
bolt tensions, (a) shows the natural frequency for: − − − bolt
tension 0N, − · − · − bolt tension 33.1 N, —– bolt tension
112N. (b) the dominant frequency as bolt tension is varied. . . 35
13 The effect of bolt tension on the damping ratio and vibration
frequency, (a) the signal envelope, —×— bolt tension= 0N,—
ζ = 0.0128,− − × − −bolt tension= 112N,− − −ζ = 0.0349,
· · × · · bolt tension= 17.3N, · · · ζ = 0.0917, − · × · − bolt tension= 33.1N, - ·− ζ = 0.2216. (b) damping ratio vs bolt tension, — equivalent damping ratio over the whole vibration
time,· · ··equivalent damping ratio over the first three periods of vibration. . . 36
14 The frequency and damping changes over time under an
aver-age bolt tension of 33.1 N (a) vibration amplitude over time
Figure 1: Bolted friction beam-column, with two beams and three bolts.
Figure 2: The total relative displacement between the two beams at the free end of the
[image:27.595.124.499.266.619.2]Figure 3: The total relative displacement between the two beams at the free end of the
column, (a) The general case, the beam under axial loading and bending, (b) under pure
Figure 4: The assumed friction model,− − −sticking phase, — slipping phase.
t1 t2 t3 t4 −0.04
0 0.05
Time
Magnitude
Figure 5: The model simulation,• defined using the energy balance model, — calculated
[image:29.595.187.403.425.587.2]Figure 7: The experimental set up, column dimensions: 0.3m×0.0125m×0.0005m, Young’s
modulus : E= 167GP a, Density: ρ= 6970kg/m3
−0.05−5 0 0.05 0
5x 10
−5
Tip deflection(m)
Relative displacement(m)
−0.05−5 0 0.05
0 5x 10
−5
Tip deflection(m)
Relative displacement(m)
−0.05−5 0 0.05
0 5x 10
−5
Tip deflection(m)
Relative displacement(m)
−0.05−5 0 0.05
0 5x 10
−5
Tip deflection(m)
Relative displacement(m)
(c)
(a) (b)
[image:33.595.127.485.148.538.2](d)
Figure 9: The total relative displacement between the two beam-columns at the free end
of the column versus the tip deflection, (a) average bolt tension 0 N, (b) average bolt
tension 23 N, (c) average bolt tension 36N, (d) average bolt tension 112N.
− − −theoretical value based on the theoretical tip deflection, ——– the relative
−0.5 0 0.5 −5
0 5x 10
−5
Tip velocity (m/s)
Relative displacement (m)
−0.5 0 0.5
−5 0 5x 10
−5
Tip velocity(m/s)
Relative displacement(m)
−0.5 0 0.5
−5 0 5x 10
−5
Tip velocity (m/s)
Relative displacement (m)
−0.5 0 0.5
−5 0 5x 10
−5
Tip velocity (m/s)
Relative displacement (m)
(c) (d)
[image:34.595.127.484.162.528.2](b) (a)
Figure 10: The total relative displacement between the two beam-columns at the free end
of the column versus tip velocity, (a) Average bolt tension 0 N, (b) average bolt tension
23 N, (c) average bolt tension 36N, (d) average bolt tension 112N.
− − − theoretical value based on the the theoretical tip deflection, ——– the relative
0 0.5 1 1.5 2 −0.05 0 0.05 Time(s) Vibration magnitude(m)
0 0.5 1 1.5 2
−0.05 0 0.05
Time(s)
Vibration magnitude(m)
0 0.5 1 1.5 2
−0.05 0 0.05
Time(s)
Vibration magnitude(m)
0 0.5 1 1.5 2
−0.05 0 0.05
Time(s)
Vibration magnitude(m)
0 0.5 1 1.5 2
[image:35.595.138.480.139.578.2]−0.05 0 0.05 Time(s) Vibration magnitude(m) (a) (c) (e) (d) (b)
Figure 11: The dynamics of the beam-column as the tension in the bolts is increased, (a)
average bolt tension= 0 N, (b) average bolt tension= 17.3 N (c) average bolt tension =
33.1 N(d) Average bolt tension = 46 N (e) average bolt tension = 112N
100 101 102 0
0.2 0.4 0.6 0.8 1
Frequency(Hz)
Normalised magnitude
0 20 40 60 80 100 120 140 160
3 4 5 6 7 8 9
Bolt tension (N)
Frequency (Hz)
8 4
[image:36.595.154.457.147.576.2](b) (a)
Figure 12: The vibration frequency of the beam-column under different bolt tensions, (a)
shows the natural frequency for: − − −bolt tension 0N,− · − · −bolt tension 33.1 N, —–
0 20 40 60 80 100 120 0
0.05 0.1 0.15 0.2 0.25 0.3 0.35
Average bolt tension(N)
Damping ratio
0 0.2 0.4 0.6 0.8 1 1.2 1.4 1.6 1.8 2
0 0.005 0.01 0.015 0.02 0.025 0.03 0.035 0.04 0.045 0.05
Time(s)
[image:37.595.156.431.144.544.2]Vibration magnitude(m)
Figure 13: The effect of bolt tension on the damping ratio and vibration frequency, (a) the
signal envelope, —×— bolt tension= 0N,—ζ= 0.0128,− − × − −bolt tension= 112N,
−−−ζ= 0.0349,··×··bolt tension= 17.3N,···ζ= 0.0917,−·×·−bolt tension= 33.1N,
-·−ζ= 0.2216. (b) damping ratio vs bolt tension, — equivalent damping ratio over the
0 0.2 0.4 0.6 0.8 1 −0.05
0 0.05
Time(s)
Vibration magnitude(m)
0 0.2 0.4 0.6 0.8 1
0 2 4 6 8 10
Time(s)
Frequency(Hz)
0 0.2 0.4 0.6 0.8 1
0 0.02 0.04 0.06 0.08 0.1 0.12
Time(s)
Damping ratio
(a)
(b)
[image:38.595.159.436.143.571.2](c)
Figure 14: The frequency and damping changes over time under an average bolt tension
of 33.1 N (a) vibration amplitude over time (b) frequency change over time, (c) damping