I
) I;:
~?1073/5405/81/P
A52..tJ\
EUROPEAN ECONOMIC COMMUNITY
,.,..,~ '
~
Aspects of Effecting Further: Reductions·
in Chlorofluorocarbon Usage 1n the
E~/~
::/· FINAL REPORT
.-7'Prepared for:
[commission of the European Communi ties:
1>\M~s(.l.r
Environment and Consumer Protection Service
EEC Study Contract No: U/80/343
March 1981
METRA CONSULTING GROUP LIMITED
St Mary's House,
42 Vicarag·e Crescent,
London SW11 3LD
Telephone:. 223 7634
Telex:
919173 MCGLDN
Prepared by:
c.
F. P. Bevington
ABSTRACT
CONCLUSIONS ii
1. INTRODUCTION
1.1 Study Objectives 1.2 Background
1.3 Period of Study 1.4 Acknowledgement
1.5 Note on Fluorocarbon system
1.6 References
Numbering
1. 1. 1.
2.
3. 3.
5.
2. CHLOROFLUOROCARBON PRODUCTION AND USE:
EEC, WORLD.AND USA.STATISTICS
2.1 Importance of the Statistical
Perspective 2.2 Data Sources
2.2.1 EEC Statistics 2.2.2 World Statistics 2.2.3 USA Statistics
7.
7.
8.
8.
10.
11.
2.3 Data Presentation 12.
2.4 Commentary on CFC Statistics 24.
2.4.1. F-11/F-12 Production Trends 24.
2.4.2 F-ll/F-12 Sales by EEC
Producers: 1976-79 27.
2.4.3 EEC sales of F-11/F-12 in
Relation to World Sales 29.
2.4.4 Impact on ~orld Sales of
Reduction in Use in EEC 31.
2.4.5 Inter-Community Trading in F-11
and F-12 33.
2.4.6 Need for Data on Other
3.
2.5 Conclusions
2.6 References
AEROSOLS
37. 40.
41.
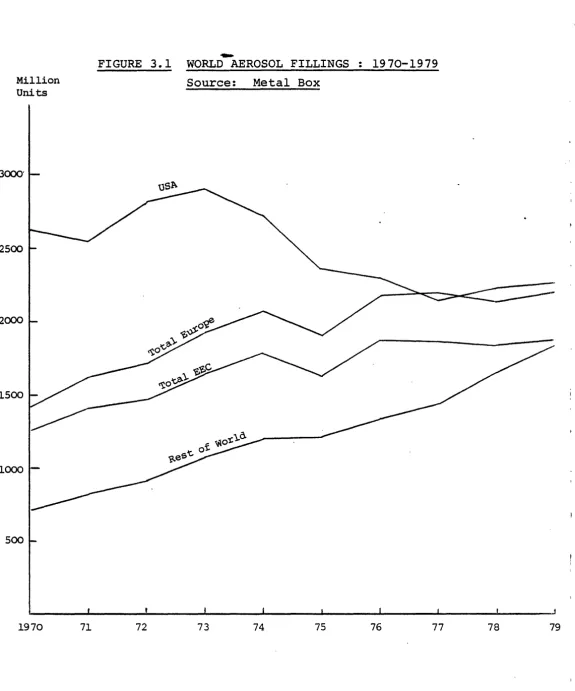
3.1 Aerosol Production Trends 41.
3.2 CFC Propellant Substitution:
Techno-Commercial Situation 47.
3.2.1 Range of Alternative~ 47.
3.2.2 Hydrocarbops
3.2.3 Dimethylefher 51.
3.2.4 Dissolved Gases: Carbon Dioxide
and Nitrous Oxide 53.
3.2.5 Compressed Gases 54.
3.2.6 Pump Sprays 54.
3.2.7 Other Devices 55.
3.2.8 Solvent Problems 55.
3.2.9 Main Trends in Substitution 56.
3.3 Alternative Measures for Further Reducing CFC Usage in Filling Aerosols in the EEC 57.
3.3.1 Reduction Resulting from Council
Decision of March 1980 57.
3.3.2 Extent of Further Reduction to
be Considered 58.
3.3.3 CFCs to be Considered in Further
Reduction Measures 59.
3.3.4 Existing and Proposed Regulation
in Countries within and OUtside the EEC 60.
3.3.5 Options for the EEC
3.3.6 Selection of Options
3.4 Socio-Economic Implications of Further
62. 68 ..
Reductions in CFC Usage in Aerosols 70.
3.4.1 General Approach
3.4.2 Added Value and Job Opportunity Losses Linked with F-11/F-12
Production Cutback 72.
3.4.3 Survey of Aerosol Fillers 79.
3.4.4 Sales Volume Changes due to
CFC Substitution 95.
4.1.1 Dominance of CFC Refrigerants
101.
4.1.2 The EEC Refrigeration Industry
103.
4.1.3 Refrigerants
111.
4.1.4 Alternative Refrigeration Systems 115.
4.1.5 F1uorocarbonRefrigerant Losses
117.
4.1.6 Approaches to Reducing CFC
Refrigerant Emissions
119.
4.1.7 Possibilities for Early Action
on Refrigerant Loss Reduction
128.
4.1.8 Conclusions
129.
4.1.9
Refrigeration References
131.
4.2 Foam Plastics
132.
4.2.1 Use of CFCs as Blowing Agents
132.
4.2.2 Rigid Polyurethane ('PUR/PIR')
Foams
133.
4. 2. 3
Flexible (Open Cell) Polyurethanes
136.
4.2.4 Conclusions
141.
4.3 Solvent Cleaning Applications
4.3.1 Development Trends·
4.3.2 Emission Prevention
4.3.3 Conclusion
143.
143.
i-ABSTRACT
Comparative statistics are presented and analysed for
the production and use of .chlorofluorocarbons F-11
and F-12, and for aerosol fillings in the EEC,
the USA and the rest of the world, principally over
the period 1976 to 1979.
The current techriical situation regarding the
substitution of CFC by non-CFC propellants and
solvents in aerosols is reviewed, and possible
measures are discussed for effecting a reduction
in F-11/F-12 usage in aerosols substantially beyond
the minimum of 30% relative to 1976, required by
the Council Decision of 26 March 1980.
Estimates are given of the losses of added value
and job opportunity which might ensue from a
major
reduction in sales of F-11 and F-12 in the EEC,
and the socio-economic impact of further CFC usage
reduction measures on the aerosol industry is
considered in the light of a survey of aerosol filling
locations, representing the majority of EEC filling
capacity.
Technical and economic possibilities are examined
for reducinq CFC usage and emissions to atmosphere
in connection with the principal non-aerosol uses of
CFCs: refrigeration and air conditioning, foam
I
CONCLUSIONS
A. Chlorofluorocarbon Production and Use: EEC,
World, and USA Statistics.
A.1. In 1976, the reference year for the Council Decision
to reduce F-11/F-12 usage for aerosols in the EEC
by at least 30%, world production of these CFCs
reached a secondary peak of 800 thousand tons but
progressively declined thereafter to 702 thousand
tons in 1979, a fall of 12.2%. Over the same period
EEC output declined by 6.8%, from 326 to 304 thousand
tons, the greater external decline being attributable
to the United States ban on CFC propellants in most
aerosols, which became fully effective in 1979.
A.2. From 1976 to 1979, F-11/F-12 sales for aerosols in
the EEC fell by 22.8% and if this rate of decrease
is maintained the 30% minimum reduction target will
be exceeded in 1981. Outside the EEC, sales for
aerosols in the same period by CMA reporting companies
declined by 53.8%, again reflecting the
u.s.
ban.For areas outside the EEC and the· USA, the reduction
was only 5.1%. In 1979, the EEC accounted for 54%
of world sales for aerosols of 254.6 thousand tons.
A.3. The F-11/F-12 usage pattern in the EEc· is in marked
contrast to that outside. Sales for aerosols in
the EEC in 1979 accounted for 62.2% of sales compared
with 27.6% outside ·the Community, whereas use for
refrigeration was only 9. 2·% in the EEC compared with
i i i
A.4. For the non-aerosol applications of F-11 and F-12,
world sales rose substantially in all categories
and by 34% overall in the period 1976 to 1979. In
the EEC, sales for non-aerosol uses rose by 23.7%,
mainly due to an increase for foam plastics, whereas
sales for refrigeration remained virtually unchanged.
A.S. The net reduction in total F-11/F-12 sales by EEC
producers from 1976 to 1979 was 8.1%, the decrease
of 22.8% in sales fo~ aerosols having been substantially
offset by the rise in sales for foams and other uses.
A.6. The EEC accounted for 34% of world sales totalling
646.6 thousand tons of F-11/F-12 by CMA reporting
companies in 1979, and nearly two thirds of these
EEC sales were for aerosols. It follows that if
the EEC wishes to make another significant contribution
to restricting world usage of F-11/F-12, this would
necessitate a further substantial reduction in use
for aerosols. If the reduction from the 1976 level
of use in aerosols were to be raised to 60%, this
would reduce total world sales by 10% of the 1979
levels. A reduction of 30% in 1979 EEC sales for
non-aerosol applications would reduce the 1979 level
of world sales by less than 4%.
A.7. World production of the other principal fully halogenated
CFCs, F-113 and F-114, is estimated to have risen
from 88,000 tons in 1977 to 109,000 tons in 1979,
when i t represented 12% of world production of F-11,
12,113 and 114. Corresponding EEC production figures
for 1977, the latest year for which data is available,
were 24,000 tons and 7%. There is a case for the
collection of world and EEC annual statistics for all
I
B. Aerosols
B.1. The EEC aerosol fillings total of 1,868 million
units in 1979 was only marginally below the 1976
total of 1,873 million, and represented 30% of the
world total. The fall of 22.8% in F-11/F-12
propellant usage in the EEC over this period is
due to several factors, including CFC substitution
and changes in sales category patterns, but the
respective contributions cannot be quantified.
B.2. Fillings in Greece of 29m units in 1979 are
equivalent to 1.5% of total EEC fillings in that
year. USA fillings were slightly higher in 1979
than in 1978, despite the ·ban on CFCs in most
aerosols. Outside Western Europe and the USA, the
1979 fillings total of 1837m. units was 37.6% above
that for 1976.
B.3. No alternative fluorocarbon propellants to F-11
and F-12 have emerged which satisfy the technical
economic, environmental, biological and other
criteria for large scale application and none is in
prospect. Pump sprays and other devices are not
making significant in-roads into the market for
self-pressurised packaging based on liquefied gas
I
v
B.4. Except for fragrances and a few minor product
sectors, liquefied hydrocarbon gas propellants
are now the established alternatives to CFCs, despite
the disadvantages attaching to their high flammability
and poor solvent properties, often necessitating the
use of auxiliary solvents and diluents such as
alcohols and methylene chloride which are also
subject to regulatory restrictions.
B.S. Dimethylether ('DME'), although flammable, could
become a valuable alternative to hydrocarbon propellants
because of better solvent properties, miscibility
with water and compatibility with fragrances. Wider
acceptance depends upon the results of a toxicity
testing programme, and the availability of more than
one primary supplier in the EEC.
B.6. For effecting reductions in F-11/F-12 usage in filling
aerosols substantially beyond the minimum of 30%
relative to 1976 levels of use, as required by the
Council Decision of 26 March 1981, a number of direct
and indirect regulatory measures can be considered
as well as the government - industry convention concept.
B.7. Direct regulatory measures available include a total
ban with special exemptions; major product sector
bans - e.g. on CFC usage in hairsprays; and CFC
concentration limits. Lack of sectoral usage statistics
makes i t difficult to quantify the outcome of the
second course and the third would be complicated to
devise and expensive to police. Extension of Article
1 of the March 1980 Decision to the chlorofluoroethanes
would only marginally increase CFC propellant usage
reduction but might restrict non-aerosol applications,
I
B.S. Restrictions leading to elimination of F-11/F-12
usage in aerosols in 1984, could reduce EEC output
by about 138,000 tons compared with 1976. The
consequent loss of added value at 1980 prices due to lower sales of CFCs and co-products, allowing for reduced raw material imports, is estimated at ECU 228,220,000 with an associated job opportunity
loss of 8,620. There would be some offset
-possibly as much as 30% - due to increased usage in ·aerosols of hydrocarbon propellants, alcohols, chlorinated hydrocarbons and other materials.
B.9. At a given sales volume, the socio-economic impact
of further CFC restrictions on the aerosol filling sector, aside from development expenditure, is essentially related to the costs and problems of
conversion to flammable propellants. The basic
capital costs of conversion could typically range
B.10.
from ECU 56,000 for a facility producing up to 1 million
units/year on an existing site, to ECU
l,l60rOOC,
_forconversion and re-location of a two-line 20m.· unit/year capacity installation.
Information on 200 filling locations obtained by
postal survey, and on more than 140 others by indirect means indicates that there are up to 400 active fillers in the EEC, with about 70 accounting for 80% of all
fillings. Half the locations surveyed are not equipped
for flammable propellants and nearly 80% of these were reported unsuitable for conversion, but almost all
fillers producing over
.lOrn
units/year are able orB.ll.
B.l2.
I
vii
Further CFC restrictions and the need for more
conversion would result in consolidation of filling
operations on fewer sites. Personnel engaged for
more than 50% of their time on aerosol manufacture
in the EEC may total about 10,000; re-structuring
of the industry might put up to 2000 job opportunities
at risk.
The effect of further CFC restrictions on aerosol
· sales volumes would depend on many factors and is
C.1.
C.l.1.
C.1.2.
C.1.3.
Refrigerati·on
Vapour compression using CFC refrigerants is the predominant system in the manufacture and use of refrigeration and air conditioning equipment in the EEC, and because of its advantages in terms of
economics, efficiency, safety and versatility i t is most unlikely that the davelopment of absorption and other systems will make a significant impact
on this situation.in the next decade. It follows
that practical measures to reduce CFC emissions in this application field must be concentrated on the reduction of preventable losses at all stages from initial manufacture and installation, to the ultimate disposal of equipment.
The principal CFC refrigerants used in the EEC
are F-12,F-22 and F-502. Sales for F-12 for
refrigeration have remained virtually constant at about 20,000 tons annually, over the period 1976 to 1979; statistics for F-22 and F-502 are not available.
There is scope for reducing emissions by equipment design improvement, the earlier detection and cure of leaks and by following less wasteful procedures in charging and servicing, but there is little economic incentive for conservation and i t is
I
ix
C.1.4. : Potentiality also exists for the recovery or
destruction of refrigerant currently vented to
atmosphere on account of contamination or other reason
preventing re-use • . Technology for these measures is
not yet established, and they are likely to prove costly and complicated to implement.
C.l.5.
C.2.
C.2.1.
Before evolving a strategy for reducing CFC refrigerant . emissions in the EEC i t will be essential to have
data on the distribution of losses by source and
equipment, and i t is suggested that in consultation
with industry a survey procedure should be devised
to obtain this. Practical steps that could be taken
meanwhile are the development of equipment design codes, and research on refrigerant recovery and disposal.
Foam Plastics
CFC blowing agents are used in the production of a number of foam plastics, but mainly for flexible
(open cell) and rigid (closed cell) polyurethane. Reliable statistics on CFC usage for the various foams are not available, but much of ·the increase in CFC usage for this application, from 42,000 tons
in 1976 to 56,000 tons in 1979, is attributable
to rigid polyurethane - the production of which
in Western Europe is reported to be growing at a
rate of nearly 9% annually. CFC usage for flexible
•
C.2.2.
C.2.3.
The CFC content of closed cell polyurethane foam
is an essential factor in the low thermal conductivity
of this material,.which has a unique combination
of advantages for thermal insulation; no alternative
non-CFC blowing agents are available for rigid
polyurethane when it is used for this purpose, which
is the major application.
Reductions in CFC
emissions might be made by minimising losses during
foam production and conversion, and possibly by
measures to prevent release during disposal, but
these are only marginal prospects.
In open cell flexible polyurethane foams, CFCs
are used as secondary blowing agents for producing
the softer, lower density grades.
CFC escapes
from the foam during production and the possibility
of recovery from the
proces~ventilation air by
adsorption on active carbon is being explored in
a pilot plant project in England. Methylene chloride
is an alternative blowing agent but toxicity problems
dictate a cautious approach to substitution.
Softer
high density grades of foam can now be made using
recently introduced polyols, and some reduction
in
CFC usage
is likelyto follow from this development.
Vacuum blowing
isa possibility on which research
has been recommenced.
There
isa case for a
co-ordinated research programme
inEurope on the
C.3.
C.3.1.
. I
xi
Solvent Cleaning Applications
The growing use of fully halogenated CFCs, especially
of F-113 for solvent cleaning makes this an application
area which deserves further attention. More information
is needed to quantify the sources of emission, and
it would be useful to discuss
eguipment~designstandards
operating practice and
solven~disposal procedures with
I
1. INTRODUCTION
1.1. Study Objectives
To investigate and report upon:
a) Options for effecting further reductions in
chlorofluorocarbon usage in filling aerosols in the EEC and the socio-economic implications of implementing such reductions and,
b) technical and economic possibilities for
chlorofluorocarbon substitution and usage reduction in non-aerosol applications, particularly in the manufacture of foam plastics, and in refrigeration and air conditioning.
1~2.. Background
The study relates to the possibility that the continuing release of large tonnages of chlorofluorocarbons ('CFCs') into the atmosphere may deplete the earth's stratospheric ozone layer, with harmful consequences for health and the environment.
The EEC is implementing precautionary measures in accordance with Council Decision 80/372/EEC of
26 March 1980, /1/, and in this connection the present study was undertaken to provide the Commission with the technical and socio-economic information and advice
2.
Two previous studies on aspects of reducing
cp·c;:
...
usage in the Community have been carried out by Metra for the Commission, and were the subject
of reports issued in October 1978 and ~une 1980,
/2/, /3/. The first study examined the
socio-economic implications of three scenarios for regulating the use of fully halogenated CFCs in aerosols, and the problems of reducing CFC usage
in the principal non-aerosol applications. The
second was concerned with technical aspects and alternative means of implementing the Council
Decision of 26 March 1980. In the following
text the reports on those studies are cited respectively as Metra 1978, and Metra 1980.
Some of the mater!al presented in the Metra 1978 and 1980 reports has been incorporated in the
present report to make it subs~antially
self-contained, but references to the previous reports are given in instances where readers may wish to consult them for additional detail.
1.3. Period of Study
The investigatory part of the study was conducted
between 1st August and 31st December 1980. Where
I
1.4.
Acknowledgement
Information, data and views were contributed by
numerous private. and public sector organisations,
including nearly 200 companies which participated
in a survey of aerosol fillers, and trade associations
representing the principal industries involved.
Metra gratefully acknowledges the extensive
co-operation and assistance given by these organisations
and by the individual executives concerned.
1.5.
Note on Fluorocarbon Numbering System
The various fluorocarbon compounds mentioned in this
report are designated by a number in accordance with
the internationally accepted system.
Reading from right to left the first digit represents
the number of fluorine atoms in the molecule; the
second is one more than the number of hydrogen atoms;
and the third is one less than the number of carbon
atoms and is omitted when zero.
4.
Other rules, not detailed here, have been devised
...to cover isomers, azeotropes, cyclic and unsaturated
compounds, and the presence of halogens other than
chlorine or fluorine.
In this report the prefix 'F', standing for fluorocarbon,
is placed before the number.
This prefix is used
because it isothat employed in the Council Decision
of March
1980,and in the previous Metra reports.
Other prefixes frequently used are 'FC', also
standing for fluorocarbons, and
~FC',standing for
chlorofluorocarbon.
The disadvantage of the CFC
prefix is that it is inappropriate for compounds
which do not contain chlorine, whereas F or FC
are applicable to all compounds of carbon and fluorine.
·The prefix F and the present universally used numbering
system were originally adopted by Du Pont for their
range of fluorocarbon products marketed under the
tradename "FREON'.
However, some other companies
subsequently adopted tradenames begining with F for
these compounds, and used the same numbering system
and prefix.
Nowadays, the prefix F does not signify
the product of any particular company.
The chlorofluorocarbons most frequently mentioned in
the'present report are as follows:
Fluorocarbon No.
F-11
F-12
F-22
F-113
F-114
Chemical
Formula
CCl3F
CCl2F2
CHC1F 2
Chemical Name
Trichlorofluoromethane
Dichlorodifluoromethane
Aonochlorodifluoromethane
':Cr
~c:1lorotrif 1 uoroethane.
I
1.6. References
1. Official Journal of the European Communities
No. L 90/45, 3 April 1980.
2. Metra: •social and Economic Implications of
Controlling the Use of Chlorofluorocarbons in
the EEC', October 1978. (EEC Study Contract).
3. Metra : 'Aspects of Implementing a Reduct.:)n
in Chlorofluorocarbon' Usage in Aerosols', June
I
2. CHLOROFLUOROCARBON PRODUCTION AND USE:
EEC, WORLD AND USA STATISTICS
2.1. Importance of the Statistical Perspective
CFC release anywhere in the world may contribute to the accumulation of these compounds in the stratosphere, and emission control must therefore be considered both in global and regional terms.
Adequate statistics must be available if quantitative assessments are to be made of the absolute and
relative significance of emissions associated with particular applications and areas, and of the
potential effect on the global release situation of a set of regionally applied control measures.
From the outset of this series of studies,great importance has been attached to obtaining data on CFC production and use in the EEC, and to presenting comparative analyses of EEC and world patterns and trends so that technical and socio-economic aspects
of possible action to r~duce CFC usage and release
in the Community can be viewed in a full perspective.
The following data analusis concentrates on F-11 and F-12, which are the only CFCs for which annual
s.
The Council Decision of March 1980 specifically
~
relates to F-11 and F-12, but the present study is not confined to these compounds and the point will be developed later in this section that i t would be desirable to have data on all CFCs which are manufactured in significant quantities.
2.2. Data Sources
2.2.1. EEC Statistics
For each of the four years 1976 to 1979, aggregate data is available for production and sales of
F-11 and F-12 by the nine chlorofluorocarbon producer-marketers in the EEC.
The data has been provided by the EFCTC - the
European Fluorocarbon Producers Technical Committee of CEFIC, under an arrangement whereby individual producers submit data in confidence to an independent
firm of UK accountants (Peat,Marwick,Mitchell & Co)
who collate the figures.
This exercise was first carried out for the years
1976 and 1977 in conjunction with the first Metra
study, and repeated for the years 1978 and 1979
for the second study. It is the present intention
of the producers that the provision of comparable annual statistics should be continued for so long as the Council Decision of March 1980 remains in
force. The insistence on providing data for the
Production totals include any importation by the
producers from outside the Community. We have
been assured by the EFCTC that with plants running well below capacity such importation is currently negligible, and that they are not aware of any significant importation by non-producers.
Sales are first analysed into home market sales (mainly sales within the country of production),
other EEC sales, and export sales to countries outside
the EEC. Sales within the EEC are further analysed
into four application categories: aerosols;
refrigeration (including air conditioning); foam plastics; and solvent and other uses.
Discrepancies between production and sales totals
have not exceeded 2% in any year, and are attributable.
to stock changes and reporting errors.
For the years 1976 and 1977, the home market sales were also broken down into sales for flexible
polyurethane foams, rigid polyurethane foams and
non-urethane foams. The EFCTC subsequently advised
that this additional analysis could not be given with confidence, mainly because some sales outlets use or market CFC blowing agents for more than one type of foam.
The accession of Greece to the EEC could complicate the provision of comparative statistics for 1981
and thereafter. There is one F-11/12 producer in
Greece, and if confidentiality is to be maintained
the production and use data should be aggregated
with that for the rest of the EEC. This would mean
10.
with those for previous years, but if aggregates ~
including Greece were now to be provided for those
years the Greek figures would be immediately calculable by difference.
This problem needs to be resolved before the
time comes for c9mpilation of the 1981 statistics.
2.2.2. World Statistics
Under a scheme administered by the CMA (the USA Chemical Manufacturers Association) 19 companies,
including all the EEC producers,report their
annual F-11 and F-12 production and sales figures
to an independent firm of
u.s.
accountants whichprepares aggregate tabulations.
On the basis of the reporting company data,
supplementary information and estimates in respect of other producers, and procedures for computing annual and cumulative figures for world production and release, the CMA Fluorocarbon Technical Panel provides the following tabulations of expanded data in respect of F-11 and F-12:
annual and cumulative production, sales
and releases in respect of reporting companies only
annual and cumulative world production
and releases.
The expanded data for sales is given in four
categories:
refrigeration-hermetically sealed;
refrigerationnon hermetic; blowing agents
-closed cell foam; open cell foam and aerosols and
all other production.
These categories do not
correspond with those available for EEC sales,
but the accountants' collations separate the
open cell foam, aerosol and other use categories,
so that by combining the two refrigeration
sub-divisions and the two foam sub-sub-divisions we obtain
a set of four groups which can be directly compared
with the EEC data, viz. aerosols, refrigeration,
foams and other uses.
The world data presented in this report is taken
from CMA papers issued in May 1980,
~/, /2~.2.2.3.USA Statistics
Although F-11/12 sales in the USA dropped following
the regulatory action on CFC usage in aerosols they
still accounted for about 25% of world sales in
1979,and it is of interest to include US figures
in some of the comparisons.
.12.
2.3. Data Presentat~n
The following presentation up-dates the Metra 1980 report by including world and USA data for 1979. In most of the tabulations and diagrams, data for 1976 is compared with that for 1979 because this gives a more readily comprehensible picture and data for the intermediate years are available in
the previous reports. For the same reason, most of
thedata relates to total F-11 and F-12 rather than to the individual compounds; the Council Decision of March 1980 also relates to aggregate totals.
Figure 2.1. graphs world production of F-11 and F-12 over the years 1969-1979 and EEC production from 1976 to 1979.
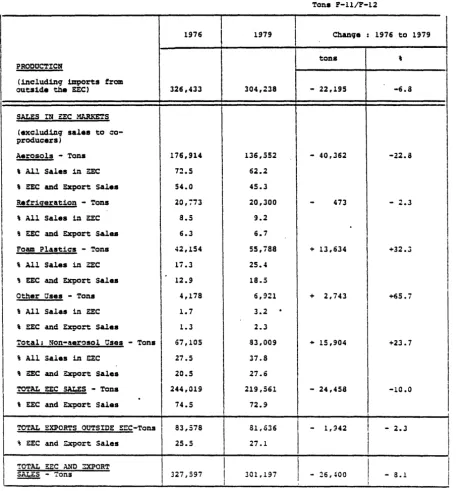
Table 2.1. gives EEC production and sales of F-11/-12 for the years 1976 and 1979, the home
territory and other EEC sales data in the tabulations supplied by the independent accountants through
the EFCTC having been consolidated to give total
EEC sales by category. Sales by category are also
expressed as percentages of all sales in the EEC and of total EEC and export sales and Figure 2.2. illustrates this data diagrammatically.
I
900-
800~
,..
·~ 0 -~ ...t ·~ 700 ~ , 0 ...t -~ ~eJ
-
Ul 600~
.s
~ 0 Ul 500 -o ij Ul ::s 0.p
400 ~ H E-t u 08
c:t: 300
p.
200
100
FIGURE 2.1 CHLOROFLUOROCARBONS F-11 AND F-12 WORLD AND EEC PRODUCTION : 1969-79
Sources: CMA and EFCTC
~
~0
#
cP~-q.
• -9-~
:Yl),
~/ . >V">' ~
~
~e<f
/'Y
~ c~
'3-),.
&),0~
~ ....
),.1-:\.),.\ ~ ....
· Argentina and India
: communist Countr~es,
Total F-ll/F-l2
[image:28.598.30.539.113.770.2]14.
TABLE 2.l.
F-11/F-12 PRO~UCT!ON AND SALES BY ~C ~ROOUc-~; 1976 ~JO 1~79
Tons P-ll/F-12
1976 1979
I
Chane; a : 1976 to 1979tons
'
PRODUCTICN
( includinq imports ~rom
outside the EEC) 326,433 304,238 - 22,195 -6.8
SALES IN U:C MARKETS
I
( axclud.inq sales to co-producers)
Aerosols - Tons 176,914 136,.552 - 40,362 -22.8
'
All Sales in ~ 72.5 62.2'
EEC and Export Sales 54.0 45.3Refri~eration - Tons 20,773 20,300
-
473 - 2.3\ All Salas in ~c a.5 9.2
\ EEC and Export Salas 6.3 6.7
Foam Plastics - Tons 42,154 55,788 + 13,634 +32.3
'
All Sales in ~c 17.3 25.4"
EEC and Export Salas 12.9 18.5Other crses - Tons 4,178 6,921 + 2,743 +65. 7
'
All Salas in EEC 1.7 3.2.
'
EEC and Export Sales 1.3 2.3Total: Non-aerosol Uses - Tons 67,105 S3,009 + 15,904 +23. 7
I
'
All sales in ac 27.5 37.8
'
EEC and ?:xport Sales 20.5 27.6TOTAL EE:C SALES - Tons 244,019 219,561 - 24,458 -10.0
% EEC and Export Sales 74.5 72.9
'
TOTAL EXPORTS OUTSIDE EEC•Tons 83,578 81,636
I
-
1,942 - 2.3~ EEC and Z,xport Sales 25.5 27.1
I
I
'!OTAL EEC A..~O :JCPORT
I
I
I
I
~ - Tons 327,597
I
301,197 - 16,400 - 8.1I
I I
I
[image:29.601.62.530.190.682.2]FIGURE:2.2.
1976
1976
DISTRIBUTION OF EEC AND TOTAL SALES OF
F-11/F-12. BY EEC PRODUCERS
1976 AND 1979
EEC SALES
1979
ALL SALES
16.
I t
· EEC PRODUCER SALES OF F-ll AND F-12 COMP'ARED FOR YEAR 1"979
SALES IN 1979 F-11 F-12
SALES IN EEC Tons
'
Tons'
Aerosols 62,344 51.6 74,208 75.2
Refriqeration 2,253 1.9 18,047 18.3
Foam .P.tastics 49,598 41.0 6,190 6.3
Other Oses 6,&39
s.s
282 0.3TO'l'AL EEC SALES 120,834 100.0 98,727 100.0
EXPORT SALES 37,767 43,869
TOTAL EEC AND
EXPORT SALES 158,601 142,596
EXPORT SALES AS
.
PERCENTAGE OF
TOTAL SALES 23.8% 30.8%
TABLE 2.3 F-11/b.,-12 SALES BY CATEGORY AND TERRITORY FOR CMA REPORTING COMPANIES 1976 AND World Sales Category Year World EEC Excluding EEC 'ooo tons 'ooo tons % world 'ooo tons 1976 432.3 176.9 40.9 255.4 Aerosols 1979 254.6 136.6 53.7 118.0 % Change -'31.1 -22.8 -53.8 1976 152.3 20.8 13.7 131.5 Refrigeration 1979 191.1 20.3 10.6 170.8 % Change + 25.5
-2.3 + 29.9 1976 110.4 42.1 38.1 68.3 Foam Plastics 1979 152.4 55.8 36.6 96.6 % Change + 38.0 + 32.2 + 41.1 1976 29.8 4.2 14.1 25.6 Other Uses 1979 48.5 6.9 14.2 41.6 % Change + 62.8 + 65.7 + 62.5 Totals.
1976 292.5 67.1 22.9 225.4.
Non-aerosol 1979 392.5 83.0 21.1 309.0 categories % Change + 34.0 + 23.7 + 37.1 Totals.
1976 724.8 244.0 33.7 480.8.
All Categories 1979 646.6 219.6 34.0 427.0 % Change -10.8 -10.0 -11.2 Note 'World'=
Total CMA Reporting Company sales for stated category. (CMA Reporting Companies include all the EEC CFC producers) EEC and USA figures are for sales within these territories World USAExcluding EEC
FIGURE. 2 •. 3
18.
DISTRIBUTION
OF F-11
AND
F-12
SALES IN
EEC : COMPARISON FOR YEAR 1979
F-11
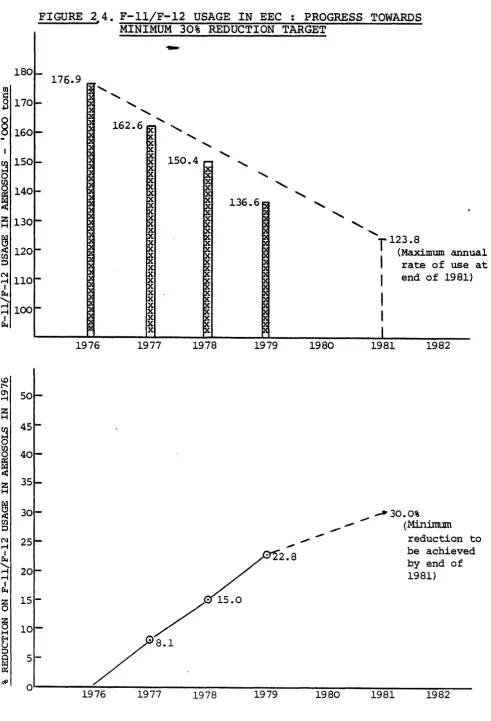
Figure 2.4.
charts progress towards the end of
1981 minimum reduction target of 30% relative to
the 1976 level of use of F-11 and F-12 in filling
aerosols in the EEC.
Table 2.3 categorises world sales by all CMA
reporting companies in 1976 and 1979 and the
percentage changes between these years, with
corresponding data for the EEC and the USA, and
for sales outside the EEC including and excluding
sales in the USA.
Figure 2.5 represents the trends of F-11/F-12
sales in the EEC and the world for the main application
categories over the period 1976 to 1979.
Table 2.4 compares the percentage distribution of
sales of F-11/F-12 by CMA reporting companies in the
EEC, non-EEC countries and the world for 1976 and
1979.
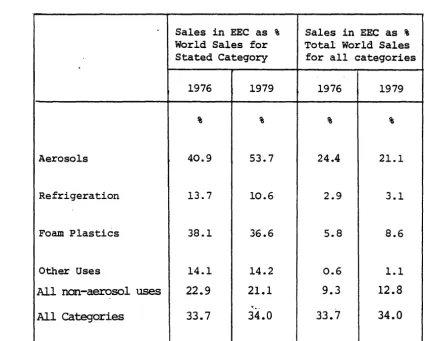
Table 2.5 expresses F-11/F-12 sales in the EEC
_by category as percentages of world sales by CMA
reporting ·companies .. in each .category, and as percentages
of combined world sales for all categories.
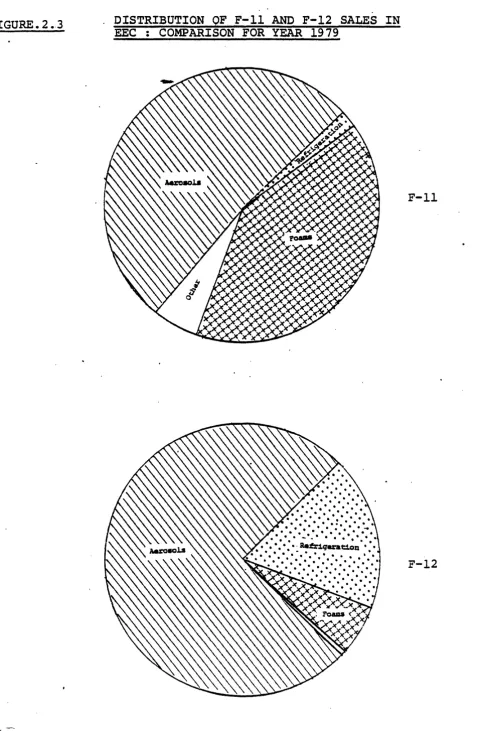
Figure 2.6.
depicts the 1979 distribution by category
20.
FIGURE 2 4. F-11/F-12 USAGE IN EEC : PROGRESS TOWARDS MINIMUM 30% REDUCTION TARGET
0)
=
l80f-.a
170~§
160-I~
150'-0
til
§
UO>-~
l30f-~
~ 1201-0
~ 1101-1 IZ.! ~100~ I IZ.! 1..0 [ ' 0'\ ...-f z 1-1 ~ 0 Ul 0
ffi
IC( z 1-f~
Ul 0 N ...-f I IZ.! ... ...-f ...-f I IZ.!a
15-~ 10
-1-1
E-4 CJ
0
0 5
[image:35.597.69.561.88.810.2]t::LI 0:: dP 0 l76.9 1976 ... ... ... 162.6 ~ '
'
~
~
~
X~ X
I~
X X X X 1977 ...150.4 ,...
1978
/
/8.1
1976 1977 1978
136.6
1979 1980
_,
,..
,..
,..
2.8
1979 1980
'
.,r
123.8I
(Maximum rate of use at annual 1 end of 1981).,
...,.
I
I
I
1981 1982
_., 30.0%
(Mininrum
reduction to be achieved by end of 1981)
TABLE 2.4
PERCENTAGE DISTRIBUTION OF CMA REPORTING COMPANY SALES OF F-11/F-12 BY CATEGORY AND TERRITORY: 1976 and 1979
% TOTAL F-11/F-12 SALES BY CMA REPORTmG
COMPANIES
1976 1979
TERRITORY: EEC Non-EEC World EEC Non-EEC World
Aerosols 72.5 53.1 59.6 62.2 27.6 39.4
Refrigeration 8.5 27.4 21.0 9.2 40.0 29.5
Foam Plastics 17.3 14.2 15.2 25.4 22.6 . 23.6
Other Uses
Non-aerosol
uses
Source:
Note:
1.7 5.3 4.1 3.2 9.7 7.5
--
- -
--27.5
46.9
40.4
37.8
72.4
60.6
100.0 100.0 100.0 100.0 100.0 100.0
CMA and EFCTC statistics
EEC sales distribution relates to sales within the EEC. Non-EEC distribution relates to differences between
[image:36.599.77.497.229.559.2]2'2.
TABLE 2.5.
F-11/F-12 SALES IN EEC BY CATEGORY AS PERCENTAGE OF WORLD SALES
BY CMA REPORTING COMPANmS: 1976 and 1979
Sales in EEC as % Sales in EEC as %
World Sales for Total World Sales
Stated Category for all categories
1976 1979 1976 1979
% % % %
Aerosols 40.9 53.7 24.4 21.1
Refrigeration 13.7 10.6 2.9 3.1
Foam Plastics 38.1 36.6 5.8 8.6
Other Uses 14.1 14.2 0.6 1.1
All non-aerosol uses 22.9 21.1 9.3
12.8
.
All categories 33.7 34.0 33.7 34.0
[image:37.600.61.486.233.574.2]F-11/f-12 : thousand tons (million kilograms) U'1 0 1--'
8
1--' U'1 0 ~--> ~xxxxxxxxxxxxxxxxxxxxxxxxxxxxxxxl 1.0xxxxxxxxxxxxxxxxxxxxxxxxxxxxxxx xxxxxxxxxxxxxxxxxxxxxxxxxxxxxxxx ~
0'\
xxxxxxxxxxxxxxxxxxxxxxxxxxxxxx xxxxxxxxxxxxxxxxxxxxxxxxxxxxxyxx
~
_xxxxxxxxxxxxxxxxxxxxxxxxxxxxx ....,J
xxxxxxxxxxxxxxxxxxxxxxxxxxx ~
xxxxxxxxxxxxxxxxxxxxxxxxxxx. rxxxxxxxxxxxxxxxxxxxxxxxxxxx~;
xxxxxxxxxxxxxxxxxxxxxxxxxxx ~ xxxxxxxxxxxxxxxxxxxxxxxxxx 00 xxxxxxxxxxxxxxxxxxxxxxxxxx
_
~
xxxxxxxxxxxxxxxxxxxxxx~ xxxxxxxxxxxxxxxxxxxxxxx~ -...
\0 ,xxxxxxxxxxxxxxxxxxxxxxxx~ xxxxxxxxxxxxxxxxxxxxxxxxxJ --...] 00 ....,J \0 1--' \0 ~ 0'\ -xxxxxxxx ~ xxxxxxxx ~ xxxxxxxx xxxxxxxx ....,J 00
\5~
I
1--' \0~ 0'\
....,J
~ ~ 00
...J \0
~
tzj ~ c:: {/)t'£l {/)
I
I':I:J~
'tl~
1-3H ()
tr.l 1\.)
8
~ t'£l I':I:J ~ H ~~ 1-3 H
~ 1\.) U'1 0 w
8
w U'1 0 I IRID
tz:itr.l tz:iPJ
()~ CD ~m () ... ~ ::s li
t'£l 0
t'£l o..n
g
tr CD'<
li
m
li
1-3 CD
0 rt ~
0 PI li
1--'
J!m
::S
PI \0
1--'
CD 0
Ul
~~
g ()
~-s
Ul:I::' ~ 0 {/)
g
tr.lM::::-8
l"%j 1-1 GJc:
:tl tz:! N U1 t:D"'rJ t-<1... (')I-'
~"'rJ
I :x11--'
t:tjN l'tJ
om
:x1~ 81:""1 Ht:t:l ZCil G')t:D nt-c:::~&;
~8 Zt:t:l
HG')
t:t:IO
Cll:x1
t<
..
1-1 1--'Z
\.0
--.Jt:t:l 0'\t:t:l
("')
(3~
z
1--'024.
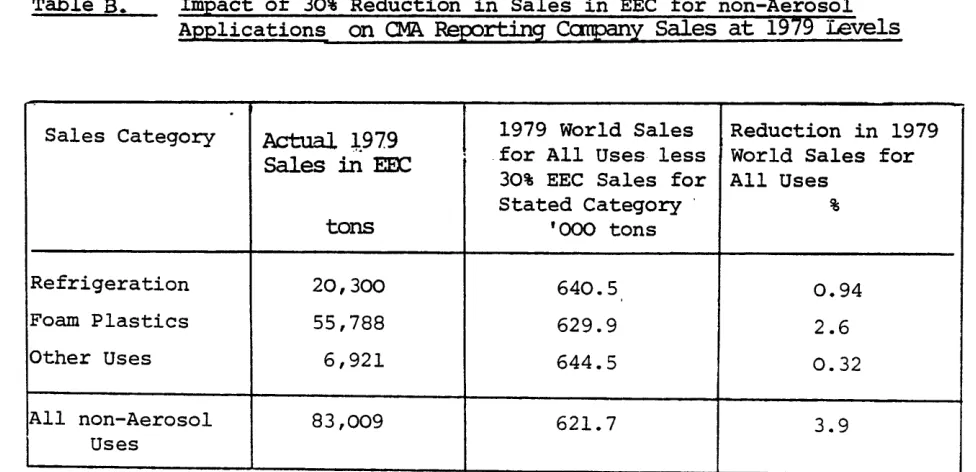
Table 2.6.
shows the impact which reductions in the
~1979 levels of sales of F-11/F12 in the EEC would have
on the total 1979 world sales level.
Table 2.7.
gives F-113 and F-114 statistics for
production and sales by EEC producers in 1977.
Figures
for later years are not currently available for
these two compounds.
Citation of Sources:
The sources cited at the foot
of each table are the original data sources consulted.
In all instances the original data has been further
processed by Metra for presentation. in this report.
The figures have been constructed from the original
and derived data tabulations.
2.4.
Commentary on CFC Statistics
2.4.l.F-11/F-12 Production Trends
As shown by Fig.2.1., world production of both F-11
and F-12 has progressively declined from the secondary
peaks of 1976.
The combined F-11/F-12 total of 799.7
thousand tons in 1976 fell to 702.3 thousand tons in
1979, a drop of 12.2%, and over the same period EEC
production fell from 326.4 to 304.2 thousand tons,
a reduction of 6.8%.
Due to the difierential rate
of decline, EEC output as a proportion of the world
total rose from 40.8% in 1976 to 43.3% in 1979.
With only marginal increases in production recorded
or estimated for the communist countries, Argentina
and India, the net world production decrease is linked
with falling sales of the CMA reporting companies,
I
TABLE 2.6.
IMPACT OF REDUCTIONS IN F-11/F-12 SALES IN EEC ON CMA REPORTING COMPANY WORLD SALES IN 1979
Table A. Impact of Further Reductions in Sales in EEC for Aerosols
on Total CMA Reporting Canpany Sales at 1979 revel.
Reduction in 1976 Reduction in 1979 1979 World Sales Reduction in 1979
Sales of F-11/F-12 Sales for Aerosols less reduction in level of Total
for Aerosols in in EEC ( 136 ,552 1979 sales for World Sales
EEC (176,914 tans) tans) aerosols in EEC
% '000 tons '000 tons '000 tons %
22.8* 40.4* 0.0 646.6
o.o
30+ 53.1 + 12.7 633.9 2.0
40 70.8 30.4 616.2 4 .. 7
so
88.5 48.1 598.5 7.460 106.1 65.8 580.8 10.2
70 123.8 83.5 563.1 12.9
80 141.5
.
101.2 545.4 15.790 159.2 118.9 527.7 18.4
100 176.9 136.6 510.0 21.1
* Actual reduction in 1979
+
Minimum reduction required by C01.mcilDecision of March 1980. {Further
reductions are hY!X>b~tical).
Table
B.
Impact of 30% Reduction in Sales in EEC for non-AerosolApplications on CMA Reporting Canpany Sales at
1979
LevelsSales Category Actual !979
I
1979 World Sales Reduction in 1979Sales in EEx:: for All Uses less World Sales for
30% EEC Sales for All Uses
Stated Category · %
tons '000 tons
Refrigeration 20,300 640.5 0.94
Foam Plastics 55,788 629.9 2.6
Other Uses 6,921 644.5 0. 32
All non-Aerosol 83,009 621.7 3.9
Uses
Source: Metra, from CMA and EFCTC statistics
[image:40.594.74.547.159.601.2] [image:40.594.64.552.551.787.2]I •
26. I ,
'rABLE 2. 7. F-ll3 AND F:-114. PRODUCTION AND SALES BY EEC PRODUCERS IN 1977
"'!: . . . . .
F-113 F-114 TOTAL
F-113 + F-114
PRODUCTION - tons 16,463 7,416 23,879
(.inc:ludinq any· imports
f%"an outside EEC) SAIZS IN EEC
Aerosols - tons 120 5,141 5,261
-' All Sales in EEC 0.87 92.3 27.2
.
' EEC + Export Sales 0.67' 72.2 21.1
· Refrii:eration - tons 132 91 223
\ All Sales in EEC 0.96 1.6 1.2
' EEC + Export Sales 0.74 1.3
-
0.89-Foam P 1astics - tons 655
.
337 992-\ All Sales in EEC 4.8 6.1 5.1
\ EEC + Export Sales 3.7 4.7 4.0
Solvent & Other Oses - tons 12,831
-
12,83111 Al~ Sales in EEC 93.4
-
66.5\ EEC + Export Sales 71.9
-
51.4'l'CTAL EEC SALES - tons 13,738 5,569 19,307
' EEC + Export Sales 77.0 78.2 77.3
TOTAL EXPORTS OCTS:IDE EEC - tons 4,100 1,556 5,656
' EEC + Export Sales
ZJ.o
21.8 22.7 .'l'CTAL EEC + EXPORT SALES - tons 17,838 7,125
. I
24,963/ '
I
for which the main cause has been declining sales for aerosols (Table 2.4.), especially in the United States where the ban on CFC usage in most aerosol
products became fully effective in 1979. However,
if the strong growth over the period 1976 to 1979 of sales in the non-aerosol sectors continues
unchecked, world production decline will eventually be reversed, although the upturn could be delayed by further action outside the USA against usage in aerosols.
2.4.2. F-11/F-12 Sales by EEC Producers: 1976-79
The following important features may be noted in the statistics presented in Tables 2.1 and 2.2, and in Figures 2.2, 2.3. and 2.4.
Sales for aerosols fell from 176,914 tons in 1976 to 136,522 tons in 1979, a reduction
of 22.8%. However, this continued to be the
largest sales category, accounting for 62.2% of sales within the EEC, and 45.3% of total
(EEC + export). sales in 1979.
Progress towards the minimum 30% reduction target in sales for aerosols compared with 1976 was
ahead of that corresponding to a steady linear rate o£ decrease, and if the average annual reduction of 7.6% achieved over the three years continues through 1980 and 1981, the target will
be exceeded. (Fig.2.4)
28.
Sales for Foam Plastics registered substantial
growth, and at 55,788 tons in 1979 were 32.3%
above the 1976 level.
Other Uses in 1979 accounted for the relatively
small fraction of 3.2% of EEC sales, although
at 6,921 tons the volume was 65.7% above that
in 1976.
Export Sales declined slightly, from 83,578
tons
in1976 to 81,636 tons
in1979, but in
relation to total sales the proportion rose
from 25.5% to 27.1%.
The net reduction
inannual sales over the
period was 26,400 tons, or 8.1% of the 1976
total, the reduction in sales for aerosols
having been substantially offset by increased
sales for foam plastics and miscellaneous
uses.
The differing F-11 and F-12 sales patterns
are brought out in Table 2.2.and
~ig.2.3.For F-11 the main non-aerosol use is as a
blowing agent in the manufacture of foam
plastics whereas for F-12 it
isas a
refrigerant.
2.4.3. EEC Sales of F-11/F-12 in Relation to World Sales
The following comments refer to sales by C!~ reporting
companies, which include all EEC producers.
2.4.3.1 Trends: 1976 to 1979 (Table 2.3 and Fig.2.5)
Sales for aerosols outside the EEC declined by 53.8% over the period as compared with 22.8% within the
Community. The disparity is attributable to the
fall of 95.2% in the USA due to ban on CFC usage
in 'non-essential' aerosols, since in the rest of the world the decline in the aerosol sector was only 5.1%.
World sales in the non-aerosol sectors rose by 34.0%
overall, with the non-EEC countries registering increased sales in each non-aerosol sector, despite static
situations in sales for refrigeration in the EEC and USA, and a reduction in USA sales for foam plastics.
The net outcome of the various sectoral changes was that falls of 10 to 11% occurred in total EEC, non-EEC and world sales, and a massive reduction of 43% in
sales in the USA. For areas outside the EEC and the
30.
2.4.3.2 Sales DistributiQn Patterns (Tables 2.4 and 2.5; Fig.2.6)
The sales patterns within and outside the EEC are
in sharp contrast, the divergence having increased
since 1976. In the EEC in 1979, 62.2% of sales
were for aerosols and only 9.2% for refrigeration whereas outside the EEC the proportions were 27.6% and 40.0% respectively.
The proportions for foam plastics were similar (EEC: 25.4%; non-EEC: 22.6%) but solvent and other uses accounted for 9.7% outside the EEC, compared with 3.2% in the Community.
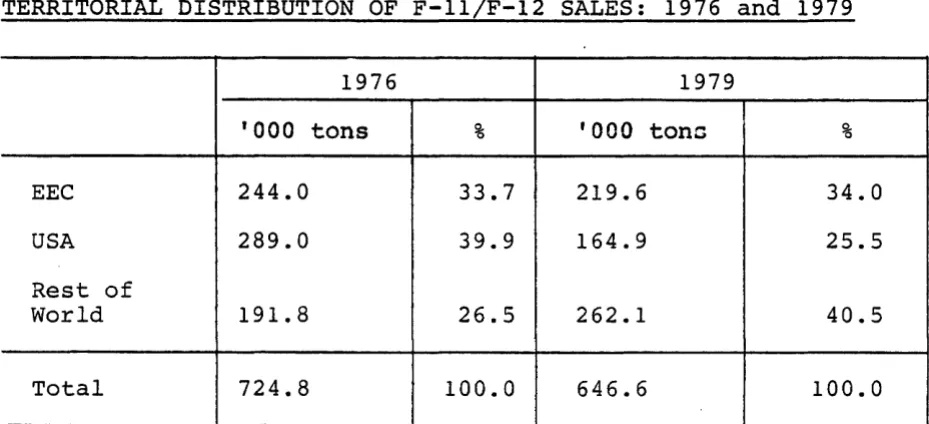
2.4.3.3 Sales Volume Comparison (Tables 2.5 and 2.8; Fig.2.6)
As shown in Table 2.8 below, the fall in USA
sales between ]976 and 1979 virtually reversed the proportions of the world total held by the USA and the rest of the world excluding the EEC, but the proportion accounted for by the EEC has remained at
just over one third of the world total.
TABLE 2.8.
TERRITORIAL DISTRIBUTION OF F-11/F-12 SALES: 1976 and 1979
1976 1979
•ooo
tons % '000 ton a %EEC 244.0 33.7 219.6 34.0
USA 289.0 39.9 164.9 25.5
Rest of
World 191.8 26.5 262.1 40.5
Total 724.8 100.0 646.6 100.0
' '
[image:45.596.57.522.570.782.2]2.4.4.
Taking the individual sales categories (Table 2.5) i t is noteworthy that in 1979 the EEC accounted for 54% of world sales by the reporting companies
for aerosols, but only 11% of those for refrigeration. A more significant perspective is provided by the
ratios of EEC sales by category to total world sales, which in 1979 were aerosols: 21%,
refrigeration: 3%, foam plastics: 9%, and other uses: 1%.
Impact on World Sales of Reduction in Use in EEC
Table 2.6A shows the impact on 1979 world sales of progressively reducing EEC usage in aerosols from the level of usage in 1979 to zero, the 1979
level being already 22.8% below that of 1976. It
will be seen that to reduce 1979 world sales by 10%, the EEC reduction would have to be 60% of the 1976 level.
Turning to the non-aerosol applications, Table 2.6B shows that even if the EEC were able to reduce sales in all of these by 30%, the reduction in world sales at the 1979 level would be only 3.9%.
The foregoing analysis relates to a static situation, and in the current economic recession i t is difficult
to gauge future growth rates. If sales for non-aerosol
32.
a) In the EEC, the minimum reduction of
~
53,000 tons in the 1976 level of use in
aerosols required by the 1980 Council Decision would be neutralised over the course of 10 years by the average rise of 5,300 tons annually in the non-aerosol sales, i.e. by the end of 1986.
b) Worldwide, the reduction in use in aerosols
in the period 1976-81 achieved by action in the EEC and the USA will amount to about
184,000 annual tons. This would be neutralised
in approximately 5.5 years by the 1976-79 average annual increase of 33,300 tons in non-aerosol sector sales, i.e. in the latter
half of 1981. (This calculation ignores changes
in sales for aerosols in countries outside the EEC and USA, which fell by an average of only 1700 tons annually from 1976 to 1979).
Hence, if the EEC wishes to make a significant contribution to retarding world sales growth after 1981, the statistics lead to the conclusion that this would entail additional material reductions in F-11/F-12 usage in aerosols, because the potentiality in the_non-aerosol sales sectors is insufficient.
2.4.5.
I
likely to have narrowed further by the end of 1981.
Thus there is a strong case for the proposition that
any measures to secure additional reductions in usage
for aerosols in the EEC after 1981 should be accompanied
by equivalent measures in those countries outside the
Community which have not yet acted in this direction.
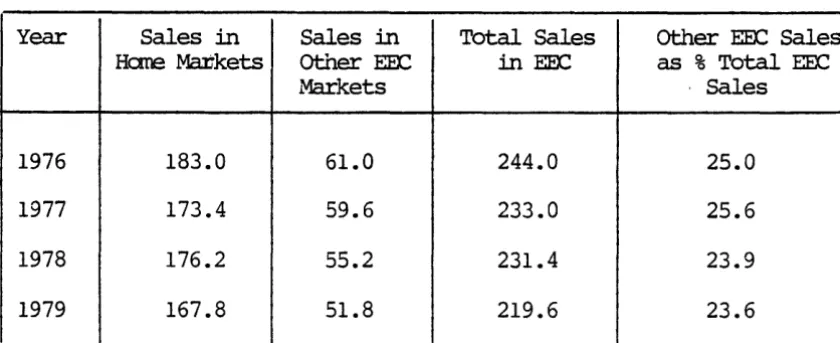
Inter-Community Trading in F-11 and F-12
The extent of inter-Community trading is indicated
by the proportion of producer sales outside their
home markets to their total sales in the EEC.
The
proportions for the years 1976 to 1979 are shown in
Table 2.10. below, which has been constructed from
the original EFCTC data.
It should be noted that
trading between the producers themselves and between
customers of the producers is excluded from these
figures.
A downward trend might be expected in
acontracting
market situation, but there has been only a marginal
decrease from 25.0% in 1976, to 23.6% in 1979.
TABLE
2.9
F-11/F12 SALES OtJrSIDE
EOC PRODu:::ERSHG1E MARE<ETS AS PERCENTAGES
OF
'!UrALEOC
SALES.Year
Sales
inSales
inTotal Sales
other EOC Sales
Hane MaJjkets
Other EEX:! in EOCas % Total EEC
Markets
· Sales
1976
183.0
61.0
244.0
25.0
1977
173.4
59.6
233.0
25.6
1978
176.2
55.2
231.4
23.9
[image:48.597.128.548.615.786.2]2.4.6.
34.
Need for Data OQ.Other Chlorofluorocarbons
Besides F-11 and F-12, two other fullyhalogenated
CFCs are produced and marketed in substantial tonnages
in the EEC. These are the chlorofluoroethanes F-113,
used mainly in solvent cleaning systems, and F-114,
used principally as an aerosol propellant in perfumes,
colognes and shave foams.
For the Metra IJ78 study the EFCTC provided production and use data for F-113 and F-114 for the years 1976
and 1977, and an analysis of the latter set is presented
in Table 2.7.
The EFCTC has not continued collecting data for F-113 and F-114, and the March 1980 Council Decision referred only to F-11 and F-12.
Features of the 1977 EEC figures are:
the sharp differentiation of function, some 93% of EEC sales of each compound being used
in thei~ principal applications
the preponderance of F-113 sales, totalling 17,838 t0ns, compared with 7,125 tons of F-114.
the substantial amount of export business, which at 22.7% of total sales was slightly
lower than the proportion of F-11/F-12 exports in the same year: 25.8%
I
The combined F-113/F-114 sales tonnage of nearly 25,000 tons in 1977 represents 7.4% of total
sales of F-11,12,113 and 114 in that year. Since
that year, F-11/F-12 sales by EEC producers have fallen, F-114 sales have possibly remained fairly static, but the demand for F-113 is believed to
have been rising by as much as 8% annually. If
these trends continue then F-113 and F-114 could
soon comprise 10~ or more o.f the total sales of
these four CFCs.
The CMA does not collect world statistics for F-113 and F-114, but the OECD report of October 1980 quoted the following total production figures supplied by
DuPont. (Table 2.10).
TABLE· 2.10 F-113 and F-114. WORLD PRODUCTION: 1977-79
'000 Tons
1977 1978 1979
Source:
F-113
70 79 91
OECD (from Du Pont)
F-114
18 21 18
Total F-113 + F-114
88 100 109
36.
The total of 109 thousand tons of F-113/F-114 in 1979
~
represents 13% of the estimated world total production of the four fully halogenated CFCs: F-11,12,113 and 114.
The other principal commercial CFC is F-22, CHC1F
2,
which is mainly used as a refrigerant, and because i t is not fully halogenated and therefore more liable
to degradation in the troposphere, i t is regarded as
a very much smaller threat to stratospheric ozone.
No statistics are available for EEC production and
use of F-22, but the OECD - again citing Du Pont
as the source - gives the production in the three years 1977-79 as 102,000; 114,000 and 131,000 tons
respectively. These figures exclude the use of F-22
as a chemical intermediate, e.g. for the manufacture of the fluorocarbon plastic PTFE (polytetrafluoro-ethylene), because that production is not eventually released to atmosphere.
If a similar ratio of total F-22 production to total world sales by CMA reporting companies of F-11/F-12 for refrigeration applies in the EEC, then F-22 production in the EEC in 1979 would have been about 14,000 tons.
The combined world production tonnage of F-113,114 and 22 in 1979 of 240,000 tons represents over 25% of the
2.5.
2.5.1
I
This substantial percentage reinforces our view that there is a case for the regular collection of
annual statistics on all CFCs which aJ:e produced
in significant quantities, both in the world and the
EEC, for so long as there is concern ~Jout the effect
of releases of CFCs on the ozone layer.
A possible·arrangement in the EEC for CFCs other than F-11 and F-12 might be for each producer to submit an annual return to independent accountants
in respect of any other CFC compound of which production {including importation from outside the EEC) had
exceeded, say, 1000 tons. The accountants would
summate the data, but to maintain comnLercial
confidentiality would only provide not:ification to the effect that production of a given compound {or group of compounds) lay in one of three ranges, e.g. 1000 to 10,000 tons; 10,000 to 20,000 tons; and
above 20,000 tons. For production exceeding 20,000
tons there would be a prime facie cas4~ for considering
whether actual tonnage figures should be provided,
in the same way as for the current arrangement applying to F-11 and F-12.
Conclusions
In 1976. the reference year for the Council Decision to reduce F-11/F-12 usage for aerosols in the EEC
2.5.2.
2.5.3.
2.5.4.
38.
a secondary pe~of 800 thousand tons but progressively
declined thereafter to 702 thousand tons in 1979, a
fall of 12.2%. Over the same period EEC output declined
by 6.8%, from 326 to 304 thousand tons, the greater external decline being attributable to the United States ban on CFC propellants in most aerosols, which became fully effective in 1979.
From 1976 to 1979, F-11/F-12 sales for aerosols in the EEC fell by 22.8% and if this rate of decrease is maintained the 30% minimum reduction target will
be exceeded in 1981. Outside the EEC, sales for
aerosols in the same period by CMA reporting companies declined by 53.8%, again reflecting the U.S. ban.
For areas outside the EEC and the USA, the reduction
was only 5.1%. In 1979, the EEC accounted for 54%
of world sales for aerosols of 254.6 thousand tons.
The F-11/F-12 usage pattern in the EEC is in marked
contrast to that outside. Sales for aerosols in
the EEC in 1979 accounted for 62.2% of sales compared with 27.6% outside the Community, whereas use for refrigeration was only 9.2% in the EEC compared with 40% outside.
For the non-aerosol applications of F-11 and F-12, world sales rose substantially in all categories
and by 34% overall in the period 1976 to 1979. In
the EEC, sales for non-aerosol uses rose by 23.7%, mainly due to an increase for foam plastics, whereas sales for refrigeration remained virtually unchanged.
I 1
I :