~
Official Journal
~
of the European Communities
c
118
1:
.
1~,; ~..
.
'
' ..:l.~ ~~·
-~ ·~ . . 1\.j ...
v .
~
I
;.~ ;,~:~.
,,~~0;~
English edition
Contents
2
Volume 21
22 May 1978
Information and Notices
I Information
Commission
The Community coal market in 1977 and forecasts for 1978 ... · · ·
I. Summary survey ... .
1. The coal market in 1977 ... .
2. The coal market outlook for 1978 ... .
II. General economic situation and outlook
III. Coal demand by sectors ... .
1. Steel industry and other coke users ... .
2. Power stations ... .
3. Various industries ... .
4. Domestic ... .
1
1
1
3
4
5
5
5
6
7
IV. Community coal production . . . 7
1. Production statistics . . . 7
(a) Quantitative analysis of output . . . 7
(b) Manpower and productivity . . . 8
2. Financial developments . . . 8
(a) Production costs and proceeds . . . 8
(b) Financial intervention by Member States . . . 8
3. Developments in productive capacity ... . (a) lnYestrnents in coal production and preparation ... . (b) Pit closures ... .
V. Coal prices ... .
1. Coal price developments ... .
2. Coking coal ... .
3. Steam coal ... .
4. Outlook for 1978
(Continued overleaf)
9
9
9
9
9
9
10
Contents (continued) VI. Coke . . . 10
1. Development of coking capacity . . . 10
2. Coke production and coal supplies to cokeries 10 VII. Trade in coal and coke . . . 11
1. Intra-Community trade . . . 11
2. Imports from third countries . . . 11
VIII. Coal and coke stocks . . . 12
1. Producers' coal and coke stocks . . . 12
2. Coal stocks at power stations . . . 13
•
I
(Information)
COMMISSION
THE COMMUNITY COAL MARKET IN 1977 AND FORECASTS FOR 1978
I. SUMMARY SURVEY
1. The coal market in 1977
The Community's energy demand in 1977 is provision-ally estimated to have been only 1·1 % above that of the previous year due mainly to low economic growth with deliberate energy conservation playing a minor role. However, this figure will probably still require correc-tion.
Natural gas, nuclear and hydro-electricity all increased their share, the total from these sources rising from 22 % in 1976 to 24·6% in 1977. By contrast, the share of oil dropped from 55·3 % to 53·7 %, that of coal from 19·5 to 18·8 % and that of lignite and similar fuels from 3·2 to 2·9 %. In total, solid fuels thus met 21·7% of the Community's energy requirements in 1977 compared to 22·7% the previous year. Table 1 gives detailed figures by country based on estimates made on 14 December 1977 as these figures were the only ones available at the moment of going to press.
Coal consumption in the Community in 1977 amounted to about 255 mtce (million tonnes of coal equivalent) compared to 263 mtce in 1976. However, neither this nor the percentage decrease mentioned above represents a drop in the absolute contribution of coal to meeting the Community's energy needs, if the requirements of the steel industry are left out of account. On the con-trary, coal consumption rose from 160 mtce in 1976 to slightly over 162 mtce last year after deducting coal consumed by cokeries and for various other uses in the steel industry.
The modest improvement in the steel industry in 1976 was reversed again in 1977. As a result, coke consump-tion by that industry reached barely 52 million tonnes, 6·8 % below 1976. This was 16 million tonnes less than in 1974, representing a drop in terms of coal of nearly 21 mtce from the level during the last year of a strong steel market.
Coal consumption for electricity generation has seen a further slight rise in 1977, following a spectacular jump of close on 18 % the previous year. Bearing in mind that, unlike in 1976, there was ample water for hydro-electricity in 1977 and that the nuclear contribution to the Community's energy requirements had increased substantially, the progress of coal in electricity gener-ation appears fairly satisfactory. However, from the point of view of developing a Community energy policy, it is less satisfactory that nine-tenths of the 121 mtcc used in power stations was burned in just three member countries: the UK, Germany and France.
No C 118/2 Official Journal of the European Communities 22. 5. 78
CONSUMPTION OF HARD COAL
X 106 tee (Forecasts)
260
Others
240
Domestic
220
200
180
Cokeries
160
140
120
HHHHHHiHH
100
80
Power stations
...
~mmi~iiiiijjj
...
':~~-~~-~_l/l:_r~:~l ~~~~~-~~~~-''"-'"'~~~--~-~
1976
1977
r
'
IMPORTS OF HARD COAL
D
Others-
USSRD
South AfricaP£cf;]
Polandc:::IJ
Australia~
USAX 106 tonnes
4"
~...._40ou , . . . • • • .. . 0 0 0 0 0 ~ 0 ~~~~
ri
~VoU,
D ·'
.··
0
~~
20-
o·o~oDo~~.o:o:e;'--h:O.b:•:
.
.,.--20
o.··'o.<
~o~0
0
'
1976
1977
1918
(Forecast)~
r
'
PRODUCTION OF HARD COAL
- B e l g i u m
- F r a n c e
x 106 tee
160
1976
~
Germany (FR)~
United Kingdom0
180
1977
1978
(Forecast)PRODUCERS' STOCKS
g
Hardcoal~Coke
X 106 tonnes
40-
--4.0
•
"'
2:-.1
•
The rise in production costs continued to slow down in 1977 but market conditions did not allow them to be recouped through sufficient price increases except in the UK. As a result, the financial position of the coal industries in Germany, France and Belgium deteriorated during the year and their need for State aids increased appreciably.
In general, price increases have been moderate but their impact on the market has been obscured by movements in rates of exchange. Thus, while prices of German coal remained unchanged in 1977, its competitive position deteriorated due to the appreciation of the DM in terms of most other currencies including the US dollar. On the other hand, price rises of the order of 15 % by the UK coal industry did not seriously affect its competitiveness. Likewise, the tendency towards price stability for third country coking coal at around $ 62 cif ARA and of steam coal in the 30 to $ 35 region has affected various member countries differently, depending on movements in their rates of exchange in relation to the dollar.
Intra-Community exchanges rose by some 6 % in 1977 and imports from third countries by about 2 %. As third country suppliers, Poland and the US retained respectively first and second places but their predomi-nance is being eroded by growing deliveries from Australia and South Africa. The positions of France followed by Italy as the largest importers have remained unchanged, as has the proportion of about 50 % of third country imports destined for power stations and the rest for the steel industry and other markets.
As the situation in the steel industry has been changing little over the past three years, the cumulative reduction in coal consumption by that industry over the period has amounted to some 60 mtce. Although during the same period, additional coal consumption by the elec-tricity generating industry has totalled about 31 mtce, cheaper supplies of steam coal available from third countries have made it extremely difficult for the Community's coal industry to sell its surplus on this enlarged market except within the framework of national support systems.
The Community's coal industry is thus faced with grow-ing disposal and stockgrow-ing problems as a result of the contraction of the coking coal market, matched by no more than a marginal drop in coking coal imports from third countries, and little progress in the field of elec-tricity generation.
Lower ·British production costs have enabled the UK coal industry to dispose of its output on the home market without undue problems but the coal industries in the other Member States are facing mounting difficult-ies. As by far the largest producer of coking coal and traditional supplier to other Member States, the Ger-man coal industry is particularly severely affected by disposal problems which are reflected in very large stocks of coal and coke.
2. The coal market outlook for 1978
The modest increase in economic activity expected in the Community for 1978 appears unlikely to raise plant utilization sufficiently to provide adequate incentives for a rising level of capital investment.
As a result, no substantial growth in demand for coal and coke by the steel industry can be expected. In fact, unless the investment climate improves during the sec-ond half of the year, this market is likely to be stagnant in 1978.
On the other hand, coal consumption for electricity generation is forecast to grow further, probably at a slightly faster rate than in 1977, to reach about 127 mtce for the Community. This growth is expected to be accompanied by two highly desirable trends: a slight increase in the proportion of coal burned elsewhere than in the major coal producing member countries and a rise in intra-Community power station coal sales. The ·extent of the first will be governed mainly by technical factors, whereas questions of price will tend to exercise a decisive influence on the second.
No appreciable changes can be foreseen in the general industrial market except in the event of some additional conversions to coal-firing in the cement industry. The domestic sector must be expected to continue its con-traction.
Community coal production in 1978 has provisionally been estimated at about the same level as in 1977, sub-ject to two major provisos. These are that output in the Ruhr will be deliberately limited at its 1977 level and that the introduction of productivity incentives in the British coal industry will do no more than halt the downward drift in production of recent years.
No C 118/4 Official Journal of the European Communities 22. 5. 78
the Ruhr will prove mistaken. On the other hand, no valid predictions can be made at this stage in regard to the effects of the introduction of productivity incentives in the UK.
A parallel dichotomy applies to the probable develop-ments of intra-Community exchanges and of imports from third countries in 1978: those of coking coal and coke are unlikely to register any appreciable variations compared to 1977, whereas those of power station coal leave considerable margins of uncertainty. Current estimates are that power station coal imports from third countries will remain at their 1977 level and that in-tra-Community deliveries will rise by around 1 to 1·5 million tonnes but the possibility of further agreements between coal producers and the electricity industry in other member countries leading to an increased share of this market for Community coal should not be dis-counted.
However, neither rising coal-burn for electricity gener-ation during the past three years nor the slight reversal in the trend of intra-Community exchanges and third country imports expected for 1978 are making a serious impact on the following fundamental problems:
continuing heavy dependence of some Member States on oil and gas for electricity generation;
inadequate investment in coal-fired power stations to avoid a steep rise in oil and gas requirements for electricity generation in the 1980s;
great reluctance by the Community's electricity producers, consumers and governments, except in the coal-producing Member States, to share with the coal producers the financial burdens currently aris-ing from the use of Community coal in power stations in competition with third country coal;
mounting difficulties in maintaining and developing the Community's coal-production capacity in the absence of a larger effective intra-Comm!mity power station coal market.
The Commission is continuing its efforts m seeking solutions to these problems.
II. GENERAL ECONOMIC SITUATION AND OUTLOOK
(Table 2)
After a downward trend in the economy earlier in 1977, industrial output and private consumption started to rise in several Member States in the autumn. On the other hand, low plant utilization has continued to in-hibit investment. As the growth in activity in the agricultural and service sectors was also weak, the Community's gross domestic product, for the year as a whole, increased only by 1·9 % in real terms, compared to 4·8 'Yo in 1976.
Unemployment rose until the autumn as increasing numbers of young people came onto the labour market. However, this has since stabilized at 5·7 ')';, of the civilian working population.
In spite of sluggish exports since the summer, the bal-ance of payments of the Communty has continued to improve as a result of lower imports from third count-ries. The rate of inflation in the Community abated during the second half of the year, and differences in this respect between Member States have become less marked.
The outlook, at least for the first half of 1978, gives cause for modest optimism. Exports from the Com-munity to non-member countries are expected to rise and the growth in home demand is likely to accelerate. However, high stocks of some products may have a dampening effect.
Although industrial production is expected to show moderate expansion during the first half of 1978, this is unlikely to improve appreciably plant utilization. Unless this can be achieved later in the year, the increase in the Community's gross domestic product will reach about 3 % for the year as a whole.
III. COAL DEMAND BY SECTORS
1. Steel industry and other coke users
(T abies 4 to 7)
The most severe world-wide steel industry recession in 30 years started in 1975 and has continued since then with little change.
Repeated expectations of sustained recovery have been disappointed, and total steel production in the Com-munity in 1977 of 126 million tonnes was nearly 30 million tonnes below its peak of 1974 and only marginally above its lowest point during the current recession. Still worse from the coal industry's point of view, the drop of close on 24 million tonnes in pig-iron production from its 1974 peak has, in percentage terms, been even slightly more severe.
Developments have differed between Member States in that the recession has been particularly grave in the steel industries of Belgium and Luxembourg, followed by that of Germany, all large consumers of coke tradition-ally produced from Community coal, particularly German coal. Whereas the drop in steel production from its peak in 1974 to 1977 was 32 OJ, in Belgium and Luxembourg and over 26 % in Germany, it was 17 'Yo in France while, for different reasons, that of Italy and the United Kingdom fell only slightly from its 1974 level. However, allowing for the fact that labour rela-tions problems in the British coal and steel industries depressed output in 1974 and therefore taking the pre-vious year as a reference, steel output in the United Kingdom dropped by 22 % from its peak earlier in the decade.
Of the latter three countries, France has large steel works on the coast, better sited to receive their coal and iron ore supplies from overseas than from Community sources. The same applies to Italy, where, furthermore, only about 50 % of steel is produced from pig iron.
As regards the United Kingdom, the steel industry relies largely on indigenous coking coal, supplemented by imports of special qualities from third countries, and is thus not a substantial traditional market for coking coal or coke produced in other Member States.
As the recession in steel production has been particu-larly severe in the German coal industry's most impor-tant markets for coal and coke, its disposal problems have been correspondingly grave and are reflected in steep rises in stocks in spite of deliberate cut-backs in
output. Whereas German coal production in 1977 was some 10 million tonnes below that in 1974, the indus-try's stocks of coal and coke, the latter converted into their equivalent in coal, were some 30 million tonnes higher.
At the time of the compilation of this document, there is nothing to foreshadow a substantial revival in demand for steel in 1978. Accordingly, steel production has been forecast at 129 million tonnes and pig iron production at slightly below 91 million tonnes, the former an in-crease of just over 2 % and the latter of around 3 % over 1977.
The relatively better utilization of certain modern in-stallations on coastal sites compared to some older plant in traditional inland production areas is the prin-cipal explanation of the big drop in specific coke input between 1976 and 1977, particularly in France. With little change expected in 1978, coke requirements by the steel industry are thus unlikely to differ greatly from those in 1977.
Consumption of coke-oven coke by other industries at about 4·8 million tonnes in 1977 showed a slight rise over 1976 and is expected to remain at about this level in 1978. However, in common with all solid fuels, its use for domestic heating continues to decrease.
Taking all markets into account, about 63 million tonnes of coke-oven coke were consumed in 1977. This represents a drop of over 6 'X, from the previous year, but maintenance of this level of demand, or possibly a slight increase, is expected for 1978.
2. Power stations
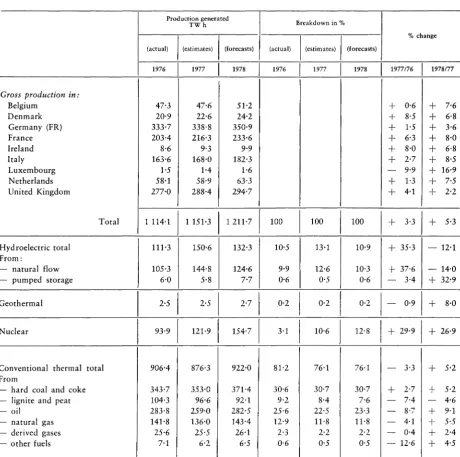
(Tables 8 A, B and C)
Electricity consumption in the Community in 1977 was about 4·5 % above that of the previous year. However, electricity production in the Community was only 3·3 % higher, the explanation for the difference lying in greatly increased net imports of hydraulically generated electricity from Austria, Switzerland and the Scan-dinavian peninsula due to plentiful supplies of water after the previous year's drought.
NoC118/6 Official Journal of the European Communities 22. 5. 78
1976 has been a considerable rise in nuclear generation. On the other hand, electricity production from gas, both natural and by-product, and from lignite, peat and oil all fell, the last-mentioned by 8·7 %. By contrast, coal registered a marginal increase.
Due to attractive prices of indigenous coal in the UK in relation to the price of oil, power station coal-burn in that country rose by about 2 mtce and continued to represent more than half the total for the Community. On the other hand, coal consumption for electricity generation showed no significant changes in France and Italy, but percentagewise important increases were registered in Belgium, Denmark and the Netherlands, while in Germany it dropped by over 4 %.
Total consumption of coal for electricity generation in the Community in 1977 was in the region of 121 mtce, an increase of about 2 % over that in 1976. Although this is small compared to the previous year's rise of close on 18 %, it must be remembered that this tremendous growth was due in part to a severe shortage of water for hydro-electric generation. Judged over the two-year period since 1975, coal-fired electricity gene-ration has risen about twice as fast as total electricity production in the Community.
The consumption of lignite for electricity generation in Germany has been reduced by 8·8 % in 1977 in order to promote the coal-burn in this sector.
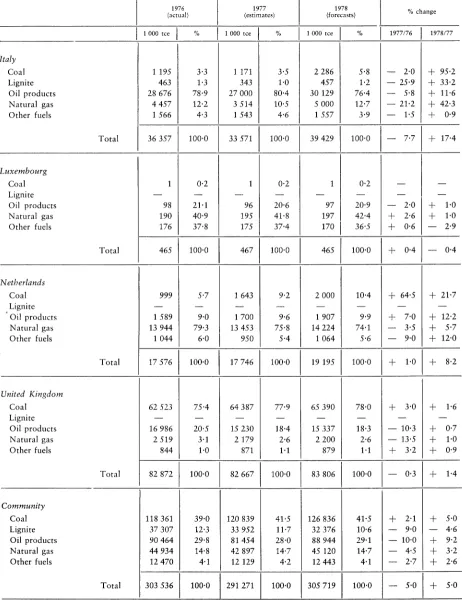
However, there remains a gross imbalance between the different member countries, in that less than 10 % of total coal used for electricity generation was burned outside the UK, Germany and France. Furthermore, deliveries of coal to power stations show a much steeper rise for imports from third countries than from other members of the Community (Table 8 C).
Last year's trend of a moderate increase in coal con-sumption for electricity generation in the Community is likely to continue in 1978. However, various special factors are expected to influence the situation in the Member States.
Electricity producers in Belgium entered the winter of 1977/78 with coal stocks above their usual level. These are expected to be reduced in the course of 1978 with the result that deliveries to power stations may be slightly below coal-burn.
Important increases in power station coal consumption in Denmark and Italy can be forseen for 1978. The likely total of about 4·4 mtce in Denmark brings coal to nearly 55 % of all fuels used for electricity generation, by far the highest percentage in the Community after the UK. Around 1-4 mtce of this may be Community coal. By contrast, projected coal-burn of 2·3 mtce in Italy in 1978 is still less than half the target of 5 mtce to be burned for electricity generation by 1980 and will represent barely 6 % of total fossil fuel, against 76 % represented by oil.
In other Community countries varying moderate in-creases in coal consumption for electricity generation are expected in 1978. Furthermore, the proportion of coal obtained from Community sources instead of from third countries will rise in France and, possibly, else-where.
Lignite and peat consumption by power station was about 34 mtce in 1977 compared to 37 mtce the pre-vious year. An overwhelming proportion of this was used in the approximately 14 000 MW of lignite-fired plant in the Cologne-Aachen area in Germany. The only other Member States where low calorie fuels have a certain national importance are France and ireland, peat consumption in the latter of 1 mtce representing about 34 % of fuel used for electricity generation.
The position of both lignite and peat is likely to remain about the same in 1978.
3. Various industries
(Table 9)
Unlike demand for coal and coke by the steel industry, sales to the general industrial market, particularly of coal, show an upturn in 1977 compared to the previous year. This is particularly notable in the UK, but the same trend is descernible elsewhere.
the same calorific output from more compact installa-tions than conventional coal-fired boilers, combined with greatly reduced noxious flue-gas emission.
Currently, there are no firm indications of a further rise in coal and coke consumption by general industry in 1978 but some possible additional conversions to coal-firing in the cement industry might bring this about. However, the diversity of the general industrial market makes predictions for this particularly difficult.
4. Domestic
(Table 10)
The inexorable decline in the market for domestic solid fuel has continued everywhere in the Community except
in the UK and Ireland. Unlike in the recent past, con-sumption of patent fuels no longer shows a substantially slower rate of decline than that of coal.
Furthermore, in the coal producing Member States, a significant proportion of solid fuels used for domestic purposes consists of concessionary supplies to persons active in or retired from the solid fuel industries. As a Community average, these tonnages amount to 13 % of the total, while in Germany they represent about a quarter. Accordingly, the genuine market for solid fuels is, in effect, smaller than suggested by the figures in Table 10.
There is nothing to indicate a change of trend. Accord-ingly, for the first time, solid fuel consumption in the Community is expected to he below 30 mtce in 1978.
IV. COMMUNITY COAL PRODUCTION
1. Production statistics
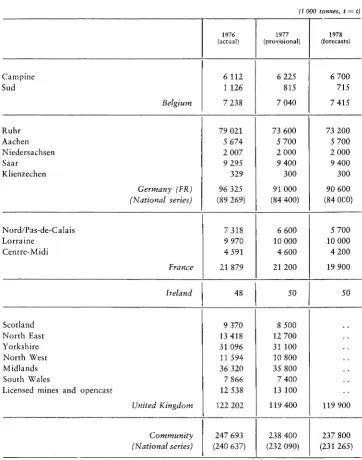
Except for most German production, the producer countries' statistics generally show coal output on a tonne by weight basis (t = t). To allow comparisons with national statistics, the figures showing output by areas in Table 11 are given in t =t. In addition, the. figures for total German 'usable production' as defined. for that country's statistics are shown in brackets.
(a) Quantitative analysis of output
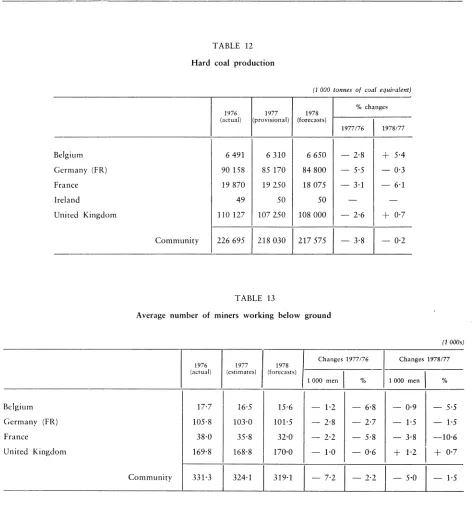
(Tables 11 and 12)
Community coal production in 1977 was about 238 million tonnes (218 mtce), a drop of 10 million tonnes (9 mtce) or 3·8 % below 1976.
Production forecasts made at the beginning of the year proved to be 9 to 10 million tonnes too high both in 1976 and 1977. The principal reasons were the same: adjustment to market conditions through short-time working and preparatory work in place of output in Germany and, in the UK, lower productivity than fore-cast.
The deliberate cutback in production in Germany of some 4·9 million tonnes in 1977 compared to the pre-vious year represents by far the largest element in the drop in total Community production, followed by a reduction in UK output of some 2·8 million tonnes due
to unsatisfactory productivity. In the other areas of the Community output remained stable, except in the coalfield extending from southern Belgium into north-ern France where production is being gradually reduced with a view to ceasing altogether in Belgium in 1982 and in France in 1985.
Two factors make the outlook for 1978 uncertain. The first of these is the reluctance of the German coal indus-try to continue short-time working combined with costly, non-revenue producing preparatory work, in-stead of employing resources of equipment and man-power to potentially greater economic advantage by producing coal. However, in the absence of massive intervention by the German Government or the Com-munity, it is difficult to see a market for the resultant additional output, and forecasts of German production in 1978 have, therefore, been pitched at about the same level as that reached in 1977.
The outlook for the UK coal industry is unclear at the time of the compilation of this document as the effects of the introduction of productivity incentives cannot he forseen at this point. Output for 1978 has therefore been provisionally forecast at the same figures as in 1977.
No C 118/8 Official Journal of the European Communities 22. 5. 78
(b) Manpower and productivity
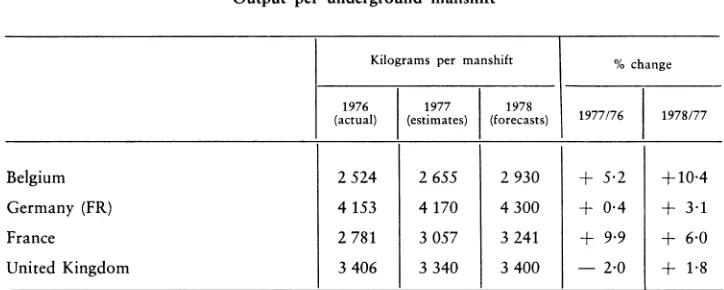
(Tables 13 and 14)
The figure showing a reduction of 7 200 men or 2·2% in underground manpower in the Community's coal industry represents a trend present in all coal-producing Member States. However, it should be noted that in spite of 6 500 underground workers aged 62 and over having left the British coal industry in the summer as a result of new pension rules, the net drop in under-ground manpower in the UK by the end of 1977 was only about 2 000 men (reflected in a drop in average manpower throughout the year of 1 000 men in Table 13).
As in the case of manpower, the development of pro-ductivity shows different trends as between the UK and the other coal-producing member countries. Further-more, certain special factors have distorted productivity developments.
Underground productivity everywhere except in Bel-gium has proved disappointing in 1977 compared to forecasts made at the start of the year. In the case of Germany, the very low increase is primarily a reflection of above normal employment of men in preparatory work instead of coal production in view of the de-pressed market for German coal. On the other hand, the drop in productivity in the UK is widely reckoned to have been due to the absence of effective productivity incentives, and it was only towards the end of 1977 that preliminary arrangements for introducing such incen-tives the following year could be made.
In 1978, developments regarding underground man-power are expected to follow the same lines as in the previous year. However, productivity can be affected by so many unpredictable factors in the fields of pro-duction policy and labour relations that forecasts can never be more than tentative. This is particularly so as regards the UK where the year 1978 might witness a complete turnround in the trend of recent years and a 10 % rise in underground coal production compared to 1977 is not beyond the bounds of possibility.
By the time the revision of the Community coal market forecasts for the current year is prepared by the Commission in the course of the summer, it should be possible to make a realistic assessment of the effects of the introduction of new productivity incentives in the UK and of their likely impact on total output in 1978.
2. Financial developments
(a) Production costs and proceeds
(Table 15)
In all coal-producing countries of the Community, costs have risen more slowly in 1977 than in 1976. This
development was partly due to lower wage rises in 1977 and partly to material costs increasing relatively slightly in line with the general decrease in inflationary press-ures.
The most important factor in developments in tion costs is the relationship between wages and produc-tivity. In 1977, wages rose more than output per under-ground manshift, this discrepancy was especially marked in the British coal mining industry on account of an actual drop in productivity in 1977 compared to 1976. However, a comparison between the increase in costs in the UK and in the other coal-producing Member States must take account of fluctuations of the pound against the currencies of these countries.
The development in the proceeds of the coal industry from 1976 to 1977 differed as between the coal-produc-ing member countries.
In Belgium, there has been a fairly sharp drop in pro-ceeds because prices for coking coal were slightly low-ered and certain quantities of coking coal were sold to power stations at steam coal prices to avoid rising stocks. In Germany, the decrease in proceeds was due to a change in markets: while sales of coking coal - at relatively high prices - have diminished, those of steam coal have stagnated. Higher proceeds in France and the UK were due to price rises.
The diverging development of costs and proceeds has resulted in a deterioration of the profitability of under-takings. The gulf between costs and receipts was widest in Belgium, while the British coal industry operated near the break-even point.
(b) Financial intervention by Member States
(Table 16)
All coal producers in the Community received govern-ment subsidies to cover certain special outgoings, costs or losses in 1977. Due to deteriorating profitability, the subsidies have everywhere been higher than in 1976. The figures in Table 16 are a reflection of the different financial results in the coal mining industry: the situ-ation was worst in Belgium, where the highest subsidies had to be paid, and most favourable in the UK, where only a relatively modest payment was required.
measures bear on production costs, in other cases, special measures guarantee the coal industry prices covering costs of production, thereby allowing subsidies from public funds to be reduced.
A new financial relationship between the French Government and the coal industry was agreed at the start of 1978. Under this, the Government has taken over the industry's liabilities resulting from past but now terminated activities and will pay a flat-rate sub-sidy on coal production of FF 14 per thermie, subject to adjustments in inverse ratio to fluctuations in the price of heavy fuel oil.
3. Developments in productive capacity
(a) Investments in coal production and preparation ·
(Table 17)
The investment boom which started in 1974 continued in 1975 and 1976 in spite of falling coal production. In this period, capital expenditure in coal mines more than doubled. Although annual growth rates in capital ex-penditure are slackening as a Community average, they are still high:
1974/73 1975/74 1976/75
+
22%, +58%,+
40%.Investments commenced or committed for 1977 and 1978 are slightly below the 1976 level, but adding further likely investment, stabilization at a high level is to be expected.
Capital expenditure in the UK and in Germany per tonne of coal produced continues to be the highest, while that in Lorraine is also above the Community average of 3·20 EUA/tonne (1976).
(b) Pit closures
(Table 18)
Closures in 1977 were on a insignificant scale, affecting a total of seven small pits with a combined output of 0·8 million tonnes the previous year.
However, more substantial closures are planned for 1978. These include one pit in the Ruhr producing over two million tonnes and one in the Nord/Pas-de-Calais area with an output exceeding one million tonnes.
V. COAL PRICES
1. Coal price developments
(Tables 19 and 20)
In periods of monetary instability, meaningful com-ments on energy price developcom-ments must take account both of purely internal price movements and of altered price relationships resulting from exchange fluctuations.
The first of these are shown in Table 19 and an attempt is made to represent the latter in Table 20. However, while Table 20 does give a picture of relative price de-velopments of various coals in the Community, it can-not presently indicate movements in the prices of these coals in relation to third country coal quoted in dollars. The Commission hopes, however, to be able to provide such a fuller comparison in clearly tabulated form in its next annual report on the basis of a Regulation agreed by the Governments of the Member States meeting within the Council on 7 November 1977 concerning the provision of improved information to be supplied to the Commission on coal imports from third countries.
Purely internally, developments in 1977 have followed the previous year's pattern of generally moderate in-creases in the list prices of Community coals (Table 19).
However, such changes in terms of national currencies are only one aspect affecting the competitiveness of dif-ferent coals produced in the Community, another hav-ing been moves in rates of exchange. Thus, although German coal prices remained unaltered throughout 1976 and 1977, the exchange appreciation of the DM caused them to rise substantially in terms of the cur-rencies of most other Member States and of imported energy priced in US dollars. On the other hand, in spite of an average price increase of 15 % for British coal, this maintained its competitive lead over other fuels in the UK.
2. Coking coal
No C 118/10 Official Journal of the European Communities 22. 5. 78
year before. However, this drop of around 3 %, in dol-lar terms was substantially greater in terms of the cur-rencies of those Community countries which have been appreciating against the dollar.
Prices of coking coals produced in the Community were generally no more than some 10 to 15 % above the Commission's indicative price for import contracts from third countries. However, the worldwide recession in the steel industry has continued to exert downward pressures on the spot market, resulting in quantities of third-country coking coal an offer at much lower prices with disturbing effects on the Community industry's disposals.
3. Steam coal
The tendency of a rise in steam coal prices of up to $ 5 per tee above the level of 30 to $ 33 cif ARA ruling through most of 1976, apparent at the end of that year, did not establish itself. Accordingly, in terms of the Community's currencies, world market prices of coal for electricity generation remained unchanged or fell in 1977, depending on relative movements in rates of exchange. They thus maintained their position well below the prices of oil or gas competing in the power-station market.
In contrast to the relatively small gap between Com-munity coking coal prices and the Commission's indica-tive price for third-country imports, the price differen-tial between Community and third-country steam coal
for the power-station market ranged from about 20 % for some British coals to over 100 % for German and Belgian coal.
Short distances between coal mines and power stations in the United Kingdom have generally enabled the British coal industry to compete successfully with im-ports from third countries and to dispose of its output to the electricity generating industry without govern-ment subsidies. However, the other Community coal producers' prices have been so much above those of imports from third countries that most of their sales required the framework of one or another kind of government intervention. As such intervention was operated only in the coal-producing Member States and, in practice, affected only each country's own coal industry, it did little to develop a genuine Community market in power station coal.
4. Outlook for 1978
On 1 January 1978, the German coal industry raised its list prices by up to 10 % in spite of adverse market conditions. This rise, like those of a similar order of magnitude likely later in the year in the other coal-pro-ducing Member States, has been forced on the industry by rising costs.
The problem of rising costs forcing the Community coal industry to raise prices, while market conditions dictate price stability or reductions, will probably be the most intractable problem in the field of pricing policy in 1978.
VI. COKE
1. Development of coking capacity
(Table 21)
In the course of 1977, the Community's coking capacity was reduced from 92 to 89·2 million tonnes per annum primarily through closures in Germany.
In the Ruhr, cokeries Radbod and Hugo with a total capacity of 1·1 million tonnes per annum were shut down at the start of the year, and a further two cokeries - Friedrich Thyssen and Konigsborn- were closed at its end. The reasons were the current depressed state of the steel industry, combined with the long-term trend towards integrated steel-works with their own coke-ovens; no replacement of the closed-down facilities is, therefore, currently envisaged.
In 1978, the closure of coke ovens at Vendin in the north of France will reduce French capacity by (H\ million tonnes and further closures in the Ruhr will
diminish German coking capacity by another 2·2 million tonnes. By contrast, new coke ovens with a capacity of nearly two million tonnes are planned to be put into service by the British Steel Corporation.
2. Coke production and coal supplies to cokeries
(T abies 22 and 23)
Although coke-oven coke consumption in the Com-munity in 1977 was some 20 million tonnes lower than in 1974, production has been reduced by only 6·5 million tonnes in 1976 and by about 14 million tonnes in 1977, compared to its 1974 level.
three years have increasingly forced the Community's coke production level more into line with consumption. About half the contraction in coke production has taken
place in Germany, the remainder being spread fairly evenly over Belgium, France, Italy, the Netherlands and the United Kingdom.
VII. TRADE IN COAL AND COKE
1. Intra-Community trade
(Tables 24 and 25)
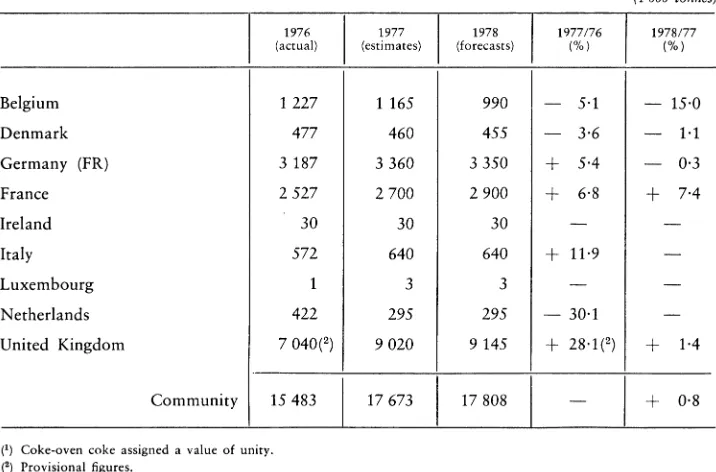
Traditionally, Germany has occupied a pos1t10n of overwhelming importance as a supplier of coal and coke to other Member States, but this position has been progressively eroded primarily for the reasons men-tioned in the previous chapter. During the period of peak activity in the steel industry in 1974, coal de-liveries from Germany to other Community countries amounted to 16·5 million tonnes, plus eight million tonnes of coke, making a total of 26·8 million tonnes with coke reckoned at its coal equivalent. As shown in Table 24, German intra-Community coal deliveries in 1978 are presently expected to be 13·5 million tonnes and those of coke to be 4·4 million tonnes, making a total of 19·2 million tonnes with coke reckoned as coal. However, as explained below, this figure may turn out to be higher as a result of additional sales to the elec-tricity generating industry.
Intra-Community deliveries by the United Kingdom, the second largest source for this trade, have been following a different course. Due to a strike in 1974, the UK coal industry was unable to benefit from the seller's market for both coking coal and power station coal that year, while poor productivity combined with strong demand from the British electricity generating industry have left little exportable surplus in subsequent years.
As a result, UK deliveries in the intra-Community market have been fluctuating between 1·3 and two million tonnes between 1974 and 1977, while those of coke have remained insignificant. However, forecasts of coal deliveries to other Community countries for 1978 at 2·3 million tonnes suggest the possibility of the de-velopment of an upward trend, which might become stronger towards the later part of the year as a result of a hoped for rise in productivity in the British coal industry.
The basic difference between developments in German and British intra-Community coal deliveries during the past years lies in the fact that whereas the former have been primarily to the steel industry, currently experienc-ing a prolonged period of depression, the British coal industry produces mainly coal suitable for the
expand-ing market of electricity generation. However, German coal producers are increasingly active in attempting to secure coal supply contracts to the Community's elec-tricity industry, and further success in this direction might result in the estimate of intra-Community de-liveries in 1978 given in Table 24 being exceeded.
Among recipients in intra-Community coal exchanges, Denmark and France have shown the most promising developments in 1977, which are expected to continue in 1978. In both these countries, coal consumption for electricity generation has risen steeply since 1973. After a period of practically the whole of this increase being met through expanded third country imports, the German coal industry is beginning to secure a growing share of these markets.
Nevertheless, neither these improvements in German sales to power stations in other Member States nor the modest rise forecast for UK deliveries are doing more than very partially reversing the trend of the past few years of shrinking intra-Community trade in coal and coke while imports from third countries have risen steeply. The basic reason for the difficulties of the Community's own coal industry in finding new outlets in the expanding market for power station coal as a substitute for the contracting opportunities in the steel industry lies in the high cost of much Community coal production, compounded, in some instances, by geo-graphical factors giving rise to heavy transportation charges.
2. Imports from third countries
(Tables 26 and 27)
After a rise in coal imports from outside the Com-munity of some 50 % in the years following 1973, these appear now to be reaching stability at between 43 and 45 million tonnes per annum.
No C 118/12 Official Journal of the European Communities 22. 5. 78
million tonnes, while those for the miscellaneous indus-trial and domestic markets have shown a downward trend. However, during the same period, intra-Com-munity deliveries of coal and coke, mainly for the steel industry, have dropped by 25 %.
Among Member States, France has registered by far the largest rise in coal imports from third countries. Whereas these stood at only slightly above five million tonnes in 1973, the figure for 1977 is over 15 million tonnes. Elsewhere, rises have been much more modest, generally not greatly exceeding one million tonnes, while imports into some Member States have hardly risen at all.
During the same period, there has been a movement towards diversification in regard to countries of origin. While in 1973, 75 % of coal from outside the Com-munity came from either the USA or Poland, the
percen-tage of deliveries from these two countries had dropped to under 58 % by 1977. Imports from the USSR, mainly for the general industrial domestic mar-kets, have shown little change, but those from Australia , and South Africa have risen steeply. Furthermore,
vari-ous other coal-producing countries, notably India, have shown keen interest in following up trial sales to the Community's electricity producers with larger de-liveries.
Forecasts for 1978 show a slightly falling trend for imports of coking coal and no change for those destined primarily for power stations. However, there is a possi-bility of further substitution of the latter through in-creased intra-Community exchanges, provided the par-ties can find ways of resolving the difficulpar-ties arising from price differences between Community and third-country coal.
VIII. COAL AND COKE STOCKS
(Tables 28, 29 and 30)
In view of the growing importance of the coal supply position for the Community's electricity generating in-dustry and, conversely, of the financial burdens on the coal industry arising from excessive pithead stocks, the Commission's annual reports on the Community coal market have been providing increasingly detailed tables on coal and coke stocks.
Accordingly, last year's report introduced separate tables for end of year producers' coal and coke stocks (Table 28) and for coal stocks at power stations (Table 29). A further pair of tables has now been added, show-ing producers' stocks of coal by country, type and de-gree of preparation (Table _10 A) and by country, coal-field and type (Table _10 B). However, as at the time of writing this report, this detailed information was avail-able only for the end of September 1977, the position at that date is given in Tables 30 A and B, whereas the totals on Table 28 A are end of year figures.
1. Producers' coal and coke stocks
(Tables 28 and 29)
Table 28 dearly show the very special problems cur-rently affecting the German coal industry in carrying combined coal and coke stocks of over 36 million tonnes, about 10 million tonnes of these for the
Gov-ernment's account in the so-called 'Notgemeinschaft'. 3 6 million tonnes are close on 40 % of German produc-tion in 1977, compared to end of year producers' stocks representing 32 % of production in France, 13 % in Belgium and 12 % in the UK.
Tables28 B, showing stocks of coke, and 30 A, giving a breakdown of producers' stocks by types of coal, demonstrate the connection between high stocks and the depressed state of the steel industry. Thus in Ger-many, out of total stocks of some 36 million tonnes, at least 30 million tonnes consist either of coke or of coals of types V and VI, generally considered as coking coal, and the same applies in France with regard to five million tonnes out of total stocks of 6·8 million tonnes.
The fundamental reasons for current excessive pro-ducers' stocks of coal and coke lie in the fact that while production costs permit a high proportion of Com-munity coal to be offered at prices which are not un-bridgeably out of line with those ruling on the world coking coal market, they arc far too high to be accept-able to electricity producers accept-able to purchase third-country steam coal. The sole, exception to this is the situation in the UK.
2. Coal stocks at power stations
(Table 30)
Stocks carried by the electricity industry at the end of 1977 ranged from 79 days' supplies in the UK to 230 days' in Denmark.
Security of supplies considerations lead electri6ty generating concerns relying on imported coal to carry larger stocks than those close to their own sources of
supplies. This tendency is reflected in Table 30, except for unusually large stocks at Belgian power stations; these are due to a shift of pithead stocks as can be seen from Tables 28 and 29.
No C 118/14 Official Journal of the European Communities
22.5. 78
TABLE 1
Shares of the various forms of primary energy in gross internal energy consumption
(%)
Coal Brown coal Oil Natural Electricity
and and and gas Nuclear and
equivalent equivalent equivalent others (1)
1976
Belgium 22·2 - 54·3 20·1 5·0 - 1·6
Denmark 14·5
-
84·6-
- 0·9Germany (FR) 19·8 10·1 52·4 14·0 2·1 1-6
France 16·1 0·6 64-9 9·9 2·0 6·5
Ireland 7·3 13·7 76·7 - - 2-3
Italy 6·3 0·2 69·2 16·6 0·6 7·1
Luxembourg 41·0 0·4 31·0 8·8
-
18·8Netherlands 4·8
-
42·5 51·0 1-3 0·4United Kingdom 35·4 - 43·2 16·6 4·0 0·8
Community 19·5
I
3·2I
55-3I
16·7I
2-3I
3·01977 (1)
Belgium 21-1
-
56·4 20·3 4·8 - 2·6Denmark 15·4
-
85·5 --
- 0·9Germany (FR) 18·6 9-2 51-6 15·0 3·5 2·1
France 16·6 0·5 60·4 10·8 2·5 9·2
Ireland 7·8 12-9 78·4
-
- 0·9Italy 5-8 0·2 68·3 15-9 0·6 9·2
Luxembourg 37-8 0·3 32·0 8·3
-
21-6Netherlands 4·9
-
38·5 55-6 1-3 - 0·1United Kingdom 34·4 - 43·0 17-1 5·0 0·5
-Community 19·0 2·8 53·9 17·5 3·0 3·8
(') Estimates made on 14 December 1977.
TABLE 2
Gross domestic product in terms of volume
(% variation compared with previous year)
1976 1977 1978
Belgium 3·0 2·4 2-3
Denmark 4·8 0·9 1·5
Germany (FR) 5·6 2·6 3·1
France 5·2 2·3 2·7
Ireland 3·2 5·6 6·0
Italy 5·6 1·8 1·7
Luxembourg 2·8 1·1 1·4
Netherlands 4·6 2·4 2·1
[image:17.595.98.488.146.385.2]United Kingdom 2·8 0·1 3·5
Community 4·8 1·9 2·8
TABLE 3 A
Community coal consumption by sector
p ower stations
Coke ovens
ron and steel industry
Other industries
omestic heating
D
p atent fuel plants
Own consumption
G asworks
Others
at mines
Total (2)
r1) Including statistical adjustments.
1976
I
1977(actual) (estimates)
118 361 120 839
99 400 89 710
3 296 2 645
10 375 12 965
20 266 19 933
5 296 4 915
2 206 2162
1396 1265
2043(1) 1 288
262 639
I
255 722I
(1 000 tonnes of coal equivalent)
1978 1977176
I
1978177(forecasts) (%) (%)
126 836
+
2·1+
5·088 410 - 9-7 - 1-4
2 700 - 19·7
+
2·113 070
+
25·0+
0·818 415 - 3·5
-
8·24 305
-
7·2 - 12·42 320 - 2·0
+
7·31155 - 9·4
-
8·71145 - 37·0 - 11-1
258 356
I
- 2-7I
+
1·0(2 ) There is a slight inconsistency between these figures and the percentages for coal consumption in Table 1 as the latter
takes account of coke put to stock whereas all coal converted into coke is here treated as coal consumed. This different
treatment also explains why coal consumption figures in this report are slightly higher than those shown in the
[image:17.595.111.472.490.714.2]NoC118/16 Offi:ial Journal of the European Communities 22.5. 78
TABLE 3 B
Community coal consumption by country
(1 000 tonnes of coal equivalent)
1976
I
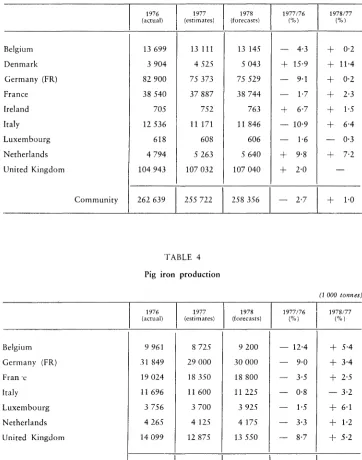
1977 1978 1977176 1978/77 (actual) (estimates) (forecasts) (%) (%)
Belgium 13 699 13111 13 145 - 4·3
+
0·2Denmark 3 904 4 525 5 043
+
15·9+
11-4Germany (FR) 82 900 75 373 75 529 - 9·1
+
0·2France 38 540 37 887 38 744 - 1·7
+
2·3Ireland 705 752 763
+
6·7+
1·5Italy 12 536 11 171 11 846 - 10·9
+
6·4Luxembourg 618 608 606 - 1·6 - 0·3
Netherlands 4 794 5 263 5 640
+
9·8+
7-2United Kingdom 104 943 107 032 107 040
+
2·0-Community 262 639 255 722
I
258 356I
- 2·7+
1·0TABLE 4
Pig iron production
(1 000 tonnes)
1976 1977 1978 1977176
I
1978/77(actual) (estimates) (forecasts) (%) (%)
Belgium 9 961 8 725 9 200 - 12·4
+
5·4Germany (FR) 31 849 29 000 30 000 - 9·0
+
3·4Fran ·c 19 024 18 350 18 800 - 3·5
+
2·5Italy 11 696 11 600 11 225 - 0·8 - 3·2
Luxembourg 3 756 3 700 3 925 - 1·5
+
6·1Netherlands 4 265 4 125 4 175 - 3-3
+
1·2United Kingdom 14 099 12 875 13 550 - 8·7
+
5·2Community 94 650
l
88 375I
90 875I
- 6·6I
+2-8
[image:18.597.122.485.160.621.2]-TABLE 5
Specific coke input in blast furnaces
(kilograms per tonne!
1976 1977 1978
(actual) (estimates) (forecasts)
Belgium 539 540 540
Germany (FR) 482 490 490
France 520 502 500
Italy 470 460 450
Luxembourg 493 485 475
Netherlands 441 450 450
United Kingdom 601 590 590
Community 520 506 cl 505
TABLE 6
Consumption of coke-oven coke in the iron and steel industry
( 1 000 to nnes
1976 1977 1978 1977/76 1978/77 (actual) (estimates) (forecasts) (%) (%)
Belgium 6 134 5 310 5 570 -13-4
+
4-9Denmark 29 40 40 -
-Germany (FR) 18 099 16 790 17 400 - 7·2
+
3-6France 11 010 10 340 10 525 - 6·1
+
1-8Ireland - 10 10 -
-Italy 6 399 6 200 5 900 - 3·1 - 4·8
Luxembourg 2 114 2 055 2 125 - 2-8
+
3·4Netherlands 2 071 2 055 2 080 - 0·8
+
1·2United Kingdom 9 832 9 100 9 500 - 7·5
+
4·4Community
1
55 6881
51 9001
53 1501-
6·81
+
2·4---~
Details:
Input in blast furnaces 48 233 44 720 45 860 - 7·3
+
2·5Sintering 6 966 6 675 6 755 - 4-2
+
1-2 [image:19.596.114.469.470.755.2]No C 118/18 Official Journal of the European Communities
TABLE 7
Community coke-oven coke consumption by sector
( 1 000 tonnes
1976 1977 1978 1977176 1978/77 (actual) (estimates) (forecasts) (%) (%)
Iron and steel industry 55 688 51 900 53 150 - 6·8
+
2·4Other industries 4 578 4 762 4 738
+
4·0 - 0·5Domestic heating 5 132 4 950 4 634 - 3-4 - 6·4
Others 1 657 (1) 1 160 1 140 - - 1·7
Total 67 055
I
62 772I
63 662I
- 6·4I
+
1·4 (1) The figures in this line include statistical adjustments and therefore have only limited significance as regardsdevelop-ments from one year to another.
22.5. 78
[image:20.596.125.483.164.318.2]Gross production in:
Belgium Denmark Germany (FR) France Ireland Italy Luxembourg Netherlands United Kingdom
Total
Hydroelectric total From:
- natural £low
- pumped storage
Geothermal
Nuclear
Conventional thermal total From
- hard coal and coke
- lignite and peat
-oil
- natural gas
- derived gases
- other fuels
TABLE 8 A
Gross electricity generated in the Community
Breakdown by energy sources
Production generated
Breakdown in %
TWh
(actual)
I
(estimates)I
(forecasts) (actual)I
(estimates)I
1976I
1977I
1978I
1976I
1977I
47·3 47·6 51·2
20·9 22·6 24-2
333·7 338·8 350·9
203·4 216·3 233·6
8·6 9·3 9·9
163·6 168·0 182·3
1·5 1·4 1·6
58·1 58·9 63·3
277·0 288·4 294·7
1 114-1
j
1151-3I
1211·7 r100
I
100I
111-3 150·6 132·3 10·5 13·1
105·3 144·8 124·6 9·9 12·6
6·0 5·8 7·7 0·6 0·5
2·5 2·5 2·7 0·2 0·2
93·9 121·9 154·7 3·1 10·6
906·4 876·3 922·0 81·2 76·1
343·7 353·0 371·4 30·6 30·7
104·3 96·6 92·1 9·2 8·4
283·8 259·0 282·5 25·6 22·5
141·8 136·0 143·4 12·9 11·8
25·6 25·5 26·1 2·3 2·2
7·1 6·2 6·5 0·6 0·5
% change
(forecasts)
1978
I
1977/76I
1978/77+
0·6+
7·6+
8·5+
6·8+
1·5+
3·6+
6·3+
8·0+
8·0+
6·8+
2·7+
8·5- 9·9
+
16·9+
1-3+
7·5+
4·1+
2·2100
I
+
3·3)+
5·310·9
+
35·3 - 12·110·3
+
37·6 - 14·00·6 - 3·4
+
32·9-0·2 - 0·9
+
8·012-8
+
29·9+
26·976·1 - 3-3
+
5·230·7
+
2·7+
5·27·6 - 7-4 - 4·6
23·3 - 8·7
+
9·111·8 - 4·1
+
5·52·2 - 0·4
+
2·4 [image:21.597.62.523.162.620.2]No C 118/20
Belgium
Coal Lignite Oil products Natural gas Other fuels
Denmark
Coal Lignite Oil products Natural gas Other fuels
Germany (FR)
Coal Lignite Oil products Natural gas Other fuels
France
Coal Lignite Oil products Natural gas Other fuels
Ireland
Coal Peat Oil products Natural gas Other fuels
Official Journal of the European Communities 22. 5. 78
TABLE 8 B
Fuel consumption by conventional power plants and coverage of requirements in %
Total Total Total Total Total 1976 (actual) I 000 tee
I
%2 706 21·9
-
-5 382 43·5
3 268 26-4
1 017 8·2
-12 373
I
100·03 356 47·3
-
-3 745 52·7
-
--
-7 101
I
100·032 591 32·4
34 600 34-4
10 693 10·6
17 451 17·3
5 279 5·3
100 614
I
100·014 953 34·5
1 259 2·9
21 438 49·5
3 105 7·2
2 544 5·9
43 299
I
100·037 1-3
985 34·2
1 857 64·5
-
--
-2 879 100·0
I
I
I
I
1977 (estimates) I 000 teeI
%3096 26·0
-
-4 -460 37·5
3 351 28·2
992 8·3
11 899
I
100·03 914 51·5
-
-3 691 48·5
-
--
-7 605
I
100·0I
31 143 I 32·5
31 571 33·0
10 857 11·3
17 129 17·9
5 059 5·3
95 759
I
100·015 457 40·2
997 2·6
16 389 42·6
3 076 8·0
2 539 6·6
38 458
I
100·027 0·9
1 041 33·6
2 031 65·5
-I
--
-3 099 100·0
I
I
I
I
1978 (forecasts) 1 000 teeI
%3 235 25·0
-
-5 110 39·4
3 566 27·5
1 045 8·1
12 956
I
100·04 443 54·6
-
-3 691 45·4
-
--
-8 134
I
100·032 629 34·4
29 714 31·3
10 586 11·1
16 857 17·7
5 204 5·5
94 990
I
100·016 814 38·7
1 164 2·7
19 881 45·7
3 076 7·1
2 524 5·8
43 459
I
100·038 1·2
1 041 31·7
2 206 67·1
-
--
-3 285 100·0
% change 1977/76 1 1978/77
+
14-4+
4·5-
-- 17·1
+
14·6+
2·5+
6·4- 2·5
+
5·31-
3·8I +
8·9+
16·6+
13·5-
-- 1-4
--
--
-I +
7·1I +
7·0- 4-4
+
4·8- 8·8 - 5·9
+
1·5 - 2·5- 1·8 - 1·6
- 4·2
+
2·91-
4·81-
0·8+
3·4+
8·8- 20·8
+
16·8- 23·6
+
21·3- 0·9
-- 0·2 - 0·6
1-
11·2I+
13·0- 27·0
+
40·7+
5·7-+
9·4+
8·6-
--
Italy
Coal Lignite Oil products Natural gas Other fuels
Luxembourg
Coal Lignite Oil products Natural gas Other fuels
Netherlands
Coal Lignite Oil products Natural gas Other fuels
United Kingdom
Coal Lignite Oil products Natural gas Other fuels
Community
Coal Lignite Oil products Natural gas Other fuels
TABLE 8 B (cont'd)
Fuel consumption by conventional power plants and coverage of requireml'n •r in%
Total Total Total Total Total 1976 (actual) 1 000 tee
I
1195 463 28 676 4 457 1 566 36 357
I
1 -98 190 176 465I
999 -1589 13 944 104417 576
I
62 523
-16 986 2 519 844
82 872
I
118 361 37 307 90 464 44 934 12 470 303 536
I
% 3·3 1·3 78·9 12·2 4·3 100·0 0·2 -21-1 40·9 37·8 100·0 5·7 -9·0 79·3 6·0 100·0 75-4 -20·5 3·1 1·0 100·0 39·0 12-3 29·8 14-8 4·1 100·0I
I
I
I
1977 (estimates) 1 000 tee ~ %1 171 3·5
343 1·0
27 000 80·4
3 514 10·5
1 543 4·6
33 571
I
100·01 0·2
-
-96 20·6
195 41·8
175 37·4
467
I
100·01 643 9·2
-
-1700 9·6
13 453 75-8
950 5·4
17 746
I
100·064 387 77·9
-
-15 230 18·4
2 179 2-6
871 1-1
82 667
I
100·0120 839 41·5
33 952 11·7
81 454 28·0
42 897 14·7
12129 4·2
291 271 100·0
I
I
I
I
I
1978 (forecasts) 1 000 teeI
%2 286 5·8
457 1·2
30129 76·4
5 000 12·7
1557 3-9
39 429
I
100·01 0·2
-
-97 20·9
197 42·4
170
I
36·5465
I
100·02 000 10·4
-
-1907 9·9
14224 74·1
1 064 5·6
19 195
I
100·065 390 78·0
-
-15 337 18·3
2 200 2-6
879 1·1
83 806
I
100·0126 836 41·5
32 376 10·6
88 944 29-1
45 120 14·7
12 443 4·1
305 719
I
100·0% change 1977/76 1 1978/77
-
2·0+
95·2- 25·9
+
33·2- 5·8
+
11-6-21-2
+
42-3-
1·5+
0·91-
7-7I
+
17·4-
--
-- 2·0
+
1·0+
2·6+
1·0+
0·6-
2·9I
+
0·41-
0·4+
64·5+
21·7-
-+
7·0+
12·2-
3·5+
5·7- 9·0
+
12·0I
+
1·0I
+
8·2+
3·0+
1·6-
-- 10·3
+
0·7- 13·5
+
1·0+
3·2+
0·9I
-
0·3I
+
1-4+
2·1+
5·0-
9·0 - 4·6- 10·0
+
9·2- 4·5