Rochester Institute of Technology
RIT Scholar Works
Theses Thesis/Dissertation Collections
5-1-1980
Spatial filtering of a projection printer, using
partially coherent light
Leon Vlahakes
Follow this and additional works at:http://scholarworks.rit.edu/theses
This Thesis is brought to you for free and open access by the Thesis/Dissertation Collections at RIT Scholar Works. It has been accepted for inclusion in Theses by an authorized administrator of RIT Scholar Works. For more information, please [email protected].
Recommended Citation
SPATIAL FILTERING OF A PROJECTION PRINTER ,
USING PARTIALLY COHERENT LIGHT
by
Leon John Vlahakes
A thesis submitted in partial fulfillment of the requirements for the degree of Bachelor of Science in the School of Photographic Arts and Sciences in the College of Graphic Arts and Photography of the Rochester Institute of Technology
May, 1980
Signature of the Author ••••••••••••••••••••••••••••••••••••• Photographic Science
and Instrumentation
Certified by .•••••••••••••••••••••••••••••••••••••• -•••••••••
Thesis Adviser
Accepted by •••••••••••••••••••••••••••••••••••••••••••••••••
SPATIAL FILTERING OF A PROJECTION PRINTER
USING PARTIALLY COHERENT LIGHT
by
Leon John Vlahakes
Submitted to the
Photographic Science and Instrumentation Division in partial fulfillment of the requirements
for the Bachelor of Science degree
at the Rochester Institute of Technology
ABSTRACT
This investigation applied the technique of spatial
filtering to a projection printer utilizing partially co
herent illumination. The affect of filtering on image qual
ity parameters such as resolution, edge gradient and MTF
were determined for a black and white film. Edge gradient
analysis was used to derive MTF data from sampled edges.
A source diameter of 3 mm and spatial filter diameters of
.6, 2.2, and 3.0 mm were used.
Spatial filtering was seen to have a drastic affect
on edge gradient and MTF. Increasing the filter diameter
resulted in a decrease of cutoff frequency of the system.
Spatial filtering had the affect of boosting low frequency
could not be detected, indicating that the alterations made
to the system are not significant to be detected visually.
Resolution was found to fluctuate only 15 percent between the
application of each filter. Despite gross changes in other
imaging characteristics, resolution remained nearly unchanged,
indicating that resolution is a poor discriptor of image
ACKNOWLEDGMENTS
Many thanks to John F. Carson of the Photoscience
department for his assistance throughout this project. His
assistance with mathematical treatments was invaluable. Also,
to Richard Norman for fabricating needed equipment.
TABLE OF CONTENTS
List of Tables ii
List of Figures j-ii
Introduction 1
Experimental 12
Results 19
Conclusions 24
References 25
LIST OF TABLES
Filter Cutoff Frequencies 16
LIST OF FIGURES
Optical Frequency Spectrum. 2
Young's Experiment 2
Transform Plane 4
Filtered Fourier Transform 4
Extended Source Transform 5
Theoretical Transfer Curves 8
Optical Schematic 13
Edge Traces 20
MTF curves 22
Spatially Filtered Images (mm)., 28
Unfiltered (A) and Filtered (B) Images
Using 2.2 mm Filter 29
INTRODUCTION
The technique of spatial filtering has existed since
1
Ernst Abbe (1893) first applied it to coherent microscope
imaging systems. In recent years, it was found that optical
image processing, or spatial filtering, could be used for
image enhancement and data processing. The periodic nature
of image components is broken down into its'
Fourier series
in a coherent imaging system. This concept is more readily
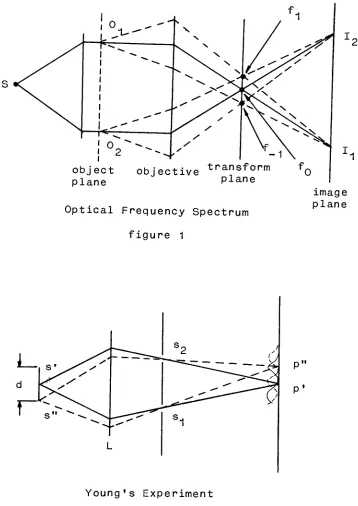
seen in figure 1. At the transform plane, or the conjugate
plane to source S, the objective lens resolves a trans
mission object into its*
various Fourier series components.
The spatial frequencies denoted as f__. through f. indicate
the presence of a specific spatial frequency in the object
plane, with higher frequency as the distance increases from
the optical axis. This investigation is concerned with
attenuating the fundamental frequency fQ, and determining
2 its'
affect on various image quality parameters.
The concept of spatial filtering must be applied to
an optical system utilizing a coherent or partially coherent
illuminating geometry. A general overview of cohernece can
be demonstrated by Young's experiment, illustrated in fig
ure
2.3
Choosing a point s'
on an extended quasi-monochro
object objective transform
fQ
plane Plane
Optical Frequency Spectrum
figure 1
image
plane
P"
P'
Young's Experiment
[image:10.553.97.455.136.642.2]pattern is generated on the screen after passing through
two pinholes, s.. and s2, due to an optical path differ
ence. Similarly, source point s"
will generate a fringe
pattern out of phase with the previous one, as will be
true with source points across the source width d. The af
fect of a finite source size is to produce a superposition
of these sinusoidal patterns resulting ia a final sinu
soidal wave form of the same frequency, and lower modulation.
As the source size d increases, the visibility of these
sinusoidal patterns decreases due to a drop in modulation.
The degree of coherence for a source is directly related to
the visibility of the fringes it produces when used in the
geometry shown in figure 2. The fringe visibility is de
pendent upon: 1) the optical path difference for each source
point, which must satisfy the condition that
OPD <<
a^X
w
where = average wavelength
= bandwidth
hich limits the size of the source, and 2)
which limits the spectral . output of the illuminating source,
will behave as a coherent, quasi-monochromatic source.
In an ideal coherent imaging system arranged in the
geometry shown in figure 2, the frequency spectrum present in
the transform plane will be represented by a series of delta
functions , illustrated in figure 3. The frequency domain
f f f
-1 T0 1
Transform Plane
figure 3
of a transmission object lends itself to filtering at this
Fourier transform plane as indicated in figure 4. The
1 ,,
filter
f-1
fO
fc f1
Filtered Fourier Transform
figure 4
dashed line represents a filter having a binary transmisr-.
at all other frequencies. The net result of this filtering
is an image with the dc component of the objects Fourier
frequency spectrum deleted.
Extending this principle to a finite source size,
it can be seen that a superposition of shifted frequency
spectra occurs. Figure 5 demonstrates the affect of a finite
(f0-s>
filter
-f -s
max f
f
0 c
Extended Source Transform
figure 5
source size on the Fourier transform of a transmission ob
ject. A source point located at the center of the extended
source will produce a frequency spectrum centered about the
vertical axis in figure 5, shown with solid lines. Similarly,
a source point at the edge of the extended source will pro
duce a frequency spectrum which is shifted by an amount s, shown with dashed lines. It is readily seen that when a
binary filter with cutoff frequency
fQ
is applied to the spectrum, its' affect on the various shifted frequencyspectra is different. In the case of figure 5, when the
the dc frequency component f is selectively removed. The
spectrum shifted by an amount s, is affected quite differ
ently. The function is shifted such that -f -s and f^-s
max 0
pass unfiltered, while f -s is filtered by the binary
max J J
spatial filter- In the former case, the dc component can
be effectively attenuated, while in the latter case, the dc
is passed unfiltered. It can be seen that when an extended
source is used in an optical system, a spatial filter cannot
be effectively applied to the dc component selectively.
A superposition of shifted frequency spectra causes other
low frequency information to be filtered as well.
A one dimensional mathematical model can be derived to
predict the affect of spatial filtering when using an ex
tended source. The illuminating system is assumed to be
incoherent, and the affects of diffraction are neglected.
Utilizing a one dimensional sinusoidal object t(x),
its'
frequency spectrum T(f) may be found by taking its'
Fourier transform.
t(x)= t0+ mtQcos 27Tf0x
where: t_= average transmission
f = fundamental frequency
m= modulation
In complex terms, the sinusoidal object may be written as
tO
i2T7fnx .tO
-i2rrf vt(x)= t_ + me + me 1<:"Tox
In frequency space, the Fourier transform may be expressed
as,
*o
to
T(f)=
FCt(xfj = t S(f)+ mS(f+fn)+
mS(f-fn) .
2 2
A filter function of tf(nfQ)=tf(f ) will now be applied to
T(f).
tf(f)T(f)= tQS(f)tf(f ')+
2mtf(f+f0)S(f+f0)
+ -mtf(f-f^)S(f-f )
2 0 o
Taking the Fourier transform of the filtered frequency
spectrum, the filtered object is obtained.
t(x)= tf(f')
F[T(fj] =t0tf(f')+
2mtf(f'+f0)el27rfOX
to .,-. - , -i2TTfnx
+ mtf(f'-fQ)e 0
Image irradiance is found to be
I(x,f',f0)= |t(x)| 2 = t(x)(t*(x))
t
I(x,f,f0)=jt02tf2(f')+
2m2(tf2(f'+f0)+tf2(f-f0)j]
dc term
+ [t02mtf(f')cos2TTf0x
(tf(f+f0)+tf(f'-f0)F]
first harmonic
[-?
m tf(f '-f0)tf(f'+f0)cos2n2f0second harmonic
8 -p co c H O H C o ta cd <+- jr ^L o o CNJ o oo 1-o CO T" co CD o > "t C 1 o CO c_
o A-> CD CM t-i
<t-
T-c CO 3 c ctj
CO
O >> c CD
O O H C
T"
c 3
<D rH D) 3 d H
a o
<t-o 0) H
00 . P
<<- CD C O CD O CO H- --o CM
tM CO CO CM
For graphical purposes, let
first harmonic modulations first harmonic
^ and the
d-c term
second harmonic modulation= second harmonic
#
dc term
Figure 6 illustrates the affect of applying a spatial
filter to an incoherent imaging system. Both first harmonic
and second harmonic modulation are plotted versus frequency.
A filter transmission of .1 was chosen, and object modula
tion of .5. Frequency units are shown as 0 through 200 with
a filter cutoff frequency of 80. It can be seen that at the
filter cutoff frequency the second harmonic modulation is
beginning to increase, while the filter has a notching affect
on the first harmonic modulation. Other models were generated
at various filter functions, and it was observed that second
harmonic modulation increased with increased filter cutoff
frequencies. In terms of image quality, it believed that
this increased second harmonic modulation will be observed
as "ringing" in edges imaged with the above filtered optical
system.
As mentioned previously, spatial filtering must be
applied to an optical system having coherent or partially
coherent illumination. The degree of coherence for an imag
ing system has been shown to have a marked affect on image
10
affect of coherence on two point resolution was investigated
4
by Grimes and Thompson . Their study was based on the sep
aration distance of two point objects necessary to have them
resolved in the imaging plane over varied coherence inter
vals. It was found that resolution increased with incoher
ent illumination, that is, the separation distance necessary
between the two object points decreased with greater incoher
ence. A more quantitative analysis of the affect of the
coherence inter val on image resolution was performed by
5
Radl . Radl concluded that as the degree of coherence of the
illuminating source increased, the resolution dropped by a
factor of two, until a coherent imaging system was reached.
Radl also investigated the affect of coherence on image
sharpness. In the same coherence length range examined for
resolution, it was illustrated that acutance increased by
a factor of three, with increasingly, coherent illumination.
Prior work by Kinzly yielded similar results when using
edge gradient as a criterion. With increasing^coherence,
the edge gradient was found to increase approximately 25
percent.
The implication of this dependence of resolution and
image sharpness on the degree of coherence of the illumin
ating source at the object plane is that subjective and ob
jective image quality will vary with optical printer ge
ometry and illuminating systems. Past work in the area
11
sharpness as a function of coherence. Increasing the degree
of coherence will result in images of higher sharpness,
but lower resolution, and vice versa when the degree of
coherence is decreased. An optical printer that would max
imize resolution and sharpness would prove valuable when
attempting to produce high quality images.
It is hypothesized that the technique of spatial
frequency filtering applied to an optical printer using a
partially coherent illuminating system will exhibit increased
sharpness and sinusoidal modulation at a particular optical
geometry. The objective of this investigation is to deter
mine the affect of spatial filtering on the image quality
parameters described above and apply the math model described
12
EXPERIMENTAL
The optical configuration used for the experimental
work is illustrated in figure 7. A 100 watt mercury arc
source was utilized due to its'
high power in the blue spec
tral region. A 436 nm interference filter with a bandpass
of 9 nm and a peak transmittance of .5 was used to selec
tively transmit the mercury line at 435.8 nm. This filter
will provide a blue spectral output which corresponds to the
sensitivity of many black and white materials. It is assumed
that this spectral distribution provides a quasi-monochromatic
condition, and therefore the necessary degree of coherence
to perform spatial filtering. The converging beam is in
cident on a double piece of ground glass to produce a totally
diffuse source, whose size is determined by an aperture mask,
which is labeled effective source. This effective source is
located 65 mm from the rear element of the first condenser.
A source diameter of 3 mm was chosen to facilitate the man
ufacturing of spatial filters, to be described later. Using
the van Cittert-Zernike theorem, the coherence interval,v,
of the 3 mm filtered source may be determined by the expression,
3.83rX
v=
13 CD CD U> C cd cd E rH h a \ / \ / \ / \ / v /
\ / CD
\ / H>
\ /
P
o
\ / CD)
\ j +> XI
14
where r=distance from first condenser
a=source diameter
-\=average wavelength
v_ 3.83(65mm) (.000436mm)
2TT(3mm)
*= .0058 mm
The value of .011 mm was found
by Radl to produce
incoherent imaging properties, such as maximum resolution and
minimum sharpness when using a similar optical geometry. An
estimated coherence interval of .0058 mm shows increased in
coherence over Radl's experimental work, but will still pro
duce similar imaging properties.
The condensers used were two Wollensak Raptar 152 mm
f/2.8 aerial lenses used back to back. These optics provide
maximum performance when a long conjugate is used on the ob
ject side, and using them as a pair retained these properties.
Spacing between the condensers was approximately 235 mm, which
produced a source image at a magnification of 1.0 located
160 mm from the second condenser. A Komura 135 mm f/5.6
enlarging lens was used as an objective, and was positioned
so the source image was approximately 2 mm from the rear ele
ment of the objective. This source image is also the loca
tion of the transform plane, which lent it to spatial fil
tering. The transmission object was located 16 mm from the
15
with a magnification of 5.3.
The theoretical cutoff frequencies for both incoher
ent and coherent imaging systems can be predicted to first
order with the following expressions.
incoherent cutoff v. = ine
*Neff
-jv = = 65 cyc/mm
.000436mm(35)
coherent cutoff v . =
-coh
2?lNeff
^ 32 cyc/mm
where N __=
effective f/number
eff
N = N(1+MAG)= 5.6(1+5.3)
Nefr
35Refering to figure 1, the distance between frequency
values f. and
fn can also be estimated to first order knowing
the wavelength of the quasi-monochromatic illumination and the
distance s from the last element of the second condenser to
the transform plane. Using this value, the cutoff frequency
i
(cyc/mm-mm)=
^s
(.000436mm) (160mm)
16
for various filters may be found by multiplying a given filtei
radius by the above conversion factor. Table 1 lists the
approximate cutoff frequencies in the Fourier transform plane
of the filters used.
Table 1
Filter Cutoff Frequencies
filter radius cutoff frequency
3mm 4.2cyc/mm
1.1 15.4
1.5 21.0
A test object was produced by contact printing a high
contrast tri-bar resolution target imaged on a glass plate
onto 35mm Kodak Fine Grain Positive Release Film and proces
sed in Kodak D-76 developer. The resolution test object was
produced having a transmission modulation of approximately
.5. A pre-exposure fog was first given to obtain the neces
sary transmission values for a modulation of .5.
With a source diameter of 3.0 mm, spatial filter
diameters of .6, 2.2, and 3.0 mm were chosen as a represen
tative range. Filters were constructed by first drilling
holes at the above diameters halfway through 2 inch plexi
glass squares, measuring their diameter on a measuring micro
scope. The holes were then filled with black paint, and the
opaque plexi-glass filters were contact printed onto Kodak
Kodalith high contrast film, which resulted in a mask of
17
Fine Grain Positive Release Film to produce spatial filters
of a density of approximately 1.0. Fine Grain
Positive film
was chosen because of its low base plus fog density which
transmitted the maximum amount of energy in the high frequen
cy range, while the thin emulsion would minimize the phase
shift encountered due to an
increased optical path length
when passing through the emulsion of the filtered
region.
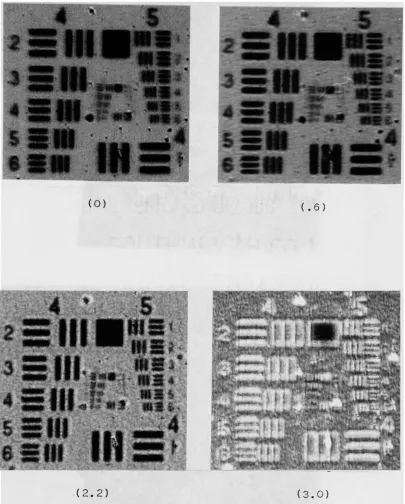
Images of the .5 modulation resolution target
were made
onto Fine Grain Positive film, using a 35mm camera back as a
film plane. Test images were produced without a spatial
filter, and with each of the filters having diameters of
.6,
2.2, and 3.0 mm. Resolving power test images were viewed
under 60X magnification by 5 trained observers to determine
the affect of spatial filtering on resolving power. Sensi
tometric exposures were made and processed with all test
images. Exposures between all test images were within 10
percent.
A JoyceLobel
scanning microdensitometer was used
to evaluate the images. Edge information present in the reso
lution target allowed edge gradient analysis and resolution
data to be obtained from one test target. The .5 modulation
target had a D . of
.10, and a D equal to .61, which is
a
min ' max ^ '
a medium contrast target with which all analysis was done.
All targets were scanned with the effective slit dimensions
of .01mm X ,23mm.
18
at a magnification of 15X, and are located in appendix A,
figure A-1 . A pictorial scene was also photographed on Kodak
Tri-X pan film and imaged with the unfiltered projection sys
tem. The image was then printed using the 2.2 mm spatial
filter and conclusions were drawn. Prints were evaluated
by inspection for overall sharpness to determine the affect
19
RESULTS
As mentioned previously, all edge images were scan
ned on a Joyce-Lobel recording microdensitoin-eter, and density
profiles were obtained. The edges were sampled at intervals
such that sixteen samples were obtained. These density values
were converted to effective exposure by tracing them back
through the density versus relative log exposure curve.
Normalized irradiance values were then plotted as a function
of distance along the sampled edge and are illustrated in
figure 8. It can be seen that increased ringing occured
in the edge images, which appears as normalized irradiance
values greater than 1, as the mathematical model predicted.
The number in parenthesis indicates the diameter of the filter
in millimeters used with the 3 mm source. An edge gradient
value was not assigned to this data as a descriptor due to
the increasing assymetry of the curves. By inspection, the
edge gradient, as determined by the slope of the linear por
tion of the curve, would be nearly invariant despite the gros
sly changing shape of the edge irradiance functions.
The unfiltered case (0) produced an edge with no
ringing, the steepest apparent edge gradient, and essentially
no toe portion to the irradiance curve. As the filter size
20 CM st O) CO CO CO CO CO o CO r-CM E E CO M CD
CD O 00
o cti c c CD cd 1- C
p 3
CO CD D)
H O) H
21
length of the toe portion of the curve and the amount of
ringing present in the images is evident.
The modulation transfer function was determined by
differentiating normalized edge irradiance values and using a
sixteen point Cooley-Tukey Fast Fourier Transform stored as
a Fortran subroutine in the Xerox Sigma 9 computing system
at RIT. The affect of spatial filtering on MTF is illustrated
by figure 9. The cutoff frequency for the unfiltered case
is found to be approximately 49 cyc/mm. This value is in
reasonable agreement with the previously determined theoret
ical incoherent and coherent cutoff frequencies of 65 cyc/mm
and 32 cyc/mm respectively. The intermediate experimental
cutoff frequency of 49 cyc/mm is a reasonable estimate for
this partially coherent imaging system. Resolving power was
subjectively found to be 14 cyc/mm.
Applying the .6 mm spatial filter to the system
results in a cutoff frequency of approximately 41 cyc/mm,
or a decrease of 16 percent. Modulation values were found
to be lower across all frequencies. This is visually evident
on images of the test targets located in appendix A, figure
A-1. Overall modulation for the test
image (.6) is seen to
have decreased. Ringing in the image of the tri-bar target
can also be detected, causing resolving power to drop to 11
cyc/mm.
Spatial filtering with the 2.2 mm filter resulted
22
-J- O
LO
o
E E o >v CO o
>> CO
o CD o>
N^ > . CD
>> 3 L
o O 3 c O CD u_ t-i
O 3 1-
0-CM
CD C
<+-2
23
of 60 percent. Modulation was found to have increased in the
range from 3 cyc/mm to 6 cyc/mm by about 30 percent. Look
ing at the test print in figure A-1 of (2.2), a slight in
crease in modulation can be seen over other cases previously
mentioned. Resolving power was determined to be 12 cyc/mm, an increase of 1 element over the image filtered with the
.6 mm filter.
Pictorial prints, figure A-2, were made with the
(2.2) filter, and it was determined that no significant change in image quality was attained with the spatial filtering
technique. The two photographs are indistinguishable when
imaged with the optical geometry described.
Attenuating the entire source diameter caused a phase
reversal in the image, which is evident in figure A-1, (3.0).
The MTF of this system yielded a cutoff frequency of approx
imately 10 cyc/mm. Severe ringing is encountered in this case
as seen in the normalized irradiance versus distance plot,
figure 7, which results in normalized irradiance values great
er than one. Values of modulation are also in excess of one
in the frequency range 0-6 cyc/mm. Difficulty in reading the
resolution target made resolution values meaningless, and there
24
CONCLUSIONS
Spatial filtering has been seen to have a drastic
affect on image quality parameters such as edge gradient, and
the modulation transfer function. Resolution, however, has
been found to be a poor descriptor of this imaging system. A
60 percent decrease in cutoff frequency, and varying inter
mediate values of modulation caused only a 10 percent decrease
in resolving power by inspection of the data of the unfiltered
system and that of the system filtered with the 2.2 mm oclusion.
The general trend has been a decrease in cutoff frequency
and an increase in low frequency modulation with the use of
spatial filtering.
Subjectively, however, the use of spatial filtering
was found to have no significant affect on image quality at
the 5.3X magnification used. Any changes in image quality
should have been noticed at low magnifications due to the
increased low frequency modulation. It is therefore con
cluded that with the system geometry and illumination char
acteristics used, the magnitude of Changs of projection char
25
26
REFERENCES
J.W. Goodman, Introduction to Fourier Optics,
(McGraw Hill Co., 1968) p. 142.
R.A. Phillips, American Journal of Physics,
37, 536(1969).
E. Hecht and A. Zajac, Optics, (Addison-Wesley Publish
ing Co., Reading,Mass. , 1976) pp.424-426.
D. Grimes and B. Thompson, Journal of the Optical Society
of America, 57, 1330(1967).
B. Radl, Image Quality Dependence on Partial Coherence
in a Projection Printer, (RIT, 1979).
R. Kinzly, Journal of the Optical Society of America,
27
28
;=NI
(0) (.6)
;*5-3SJJ}
ID]
i-mWt&l^
(2.2) (3.0)
Spatially Filtered Images (mm)
[image:36.554.67.472.107.611.2]29 a (0 CD OJ rd H ^-, CO ' c. CU "O P CD rH <L- -H 0 LL P CM
-H E |
H <
LL
CM CD
o C
C CM 3
Cti O)
C5 H
- C