Variation of PSA value in men and risk of high-grade prostate cancer, analysis of the PLCO
Study
Mathieu Boniol, PhDa,b,*, Philippe Autier, PhDa,b, Paul Perrin, PhDc, Peter Boyle, PhDa,b a
University of Strathclyde Institute of Global Public Health at iPRI, Lyon, France; b International Prevention Research Institute (iPRI), Lyon, France; c CHU-Lyon Sud, Pierre-Benite, France
* Corresponding author
Professor Mathieu Boniol
University of Strathclyde Institute of Global Public Health at iPRI
International Prevention Research Institute
95 cours Lafayette, 69006 Lyon, France
Tel: +33 4 72 17 11 85
Fax: +33 4 72 17 11 90
Email: [email protected]
Keywords: Epidemiology; Prostate cancer; PSA; Screening
Word count of the abstract: 238
Acknowledgements
Authors thank the National Cancer Institute for access to the Prostate, Lung,
colorectal and Ovarian Cancer Screening Trial database. The interpretation and reporting of
these data are the sole responsibility of the authors.
Conflicts of Interest
Word count of the abstract: 238
Objective: To investigate variations of PSA levels among men with an initial normal PSA level
in the PLCO Study.
Methods: Data were extracted from the PLCO study dataset on all men in the intervention
arm, with two tests performed in a period of less than two years and with an initial result of
the first test below 4 ng/mL. The range of variation between first and second tests was
computed. Risks of cancer stratified on Gleason score were computed using logistic
regression.
Results: 31,286 men had two PSA tests within two years and with an initial value below 4
ng/mL. From the first to second test, the median variation of PSA levels was 3.4% (IQR: -15%;
+26%). The variation in PSA value was not associated with the delay between first and
second test (p=0.36), with age (p=0.16), BMI (p=0.41) and race (p=0.12).
2,781 prostate cancers were diagnosed during follow-up. Adjusting for age and initial PSA
level, the risk of prostate cancer increased linearly with increasing PSA level at second test,
with an odds ratio of 1.079 (95% CI (1.058, 1.101)) for each percent increase in PSA level.
However, the variation in PSA was not associated with a higher Gleason score (p<0.95 for
level variations in cancer of Gleason score <7 vs ≥7).
Conclusions: While an increase in PSA level over time is associated with increased risk of
prostate cancer, this association is not related to more aggressive tumors.
1 Word count: 2,572
Introduction
The risk of prostate cancer is directly related to the level of total prostate specific
antigen (tPSA) measured in blood 1. PSA is being considered the best biochemical marker for prostate cancer and is widely used for early detection, diagnosis and monitoring. But the
evaluation of use of PSA in screening activities showed that PSA testing induced substantial
over-diagnosis of prostate cancer, mainly due to poor specificity of the test.
It is known that serial measurements of an individual’s tPSA concentration, even
when all results are obtained by a single method, may fluctuate with higher amplitude than
can be explained by the assay’s analytical variation 2-4. This reflects an additional component of intra-individual or within-subject variation, known as biological variation.
Variation of PSA level could lead to unnecessary biopsies if based on a single
measurement. It has been shown in the Polyp Prevention Trial that, following an initial
abnormal PSA level, an important proportion of men returned to normal PSA level at the
subsequent visit (26% for an initial value above 2.5 ng/ml and 30% for an initial value above
4 ng/ml) 5.
The normal variation of PSA level has been evaluated in the past in few studies, and
already an important variation in men has been reported. In a series of eight men with
adenocarcinoma of the prostate, the maximum variation above and below the mean were of
19.3% and 17.7% 6.
The biological variation of tPSA has implications for screening and diagnosis. Single
measurements may not be sufficiently precise for screening and diagnosis. Replicate samples
and calculation of the mean concentration may improve precision by reducing the
2 dispersion. Monitoring of tPSA requires an estimate of either the change needed for
significance or, alternatively, of the significance of the change.
However, subsequently there have been investigations of variation in tPSA from most
recent sources (e.g. 7-10) without any real conclusions being drawn and a lack of cohesion between findings and hypotheses investigated.
Therefore, variations of PSA levels were studied in men participating in the
intervention arm of the PLCO Study 11 and with an initial PSA level below 4 ng/mL. This database has a major advantage of standardization of the follow-up of men and a good
quality monitoring of patients and follow-up.
Material and methods
Data were extracted from the PLCO study dataset of August 2012 on all of the 38,340
men in the intervention arm. These Cancer Data Access System (CDAS) datasets are slightly
more up to date than the original report at 13 years of follow-up with reclassification of
some events based on updated data and further review, and this could explain slight
discrepancies in numbers from this report as compared to the article of Andriole et al (2012) 11
.
All potential PSA measurements were extracted for each man, so these could be part
of the annual test in the intervention or any additional test performed during follow-up. We
included men who received two valid PSA tests performed in a period of less than two years,
thus excluding 576 individuals with greater delay between two tests. As our objective was
the evaluation of PSA variability in men considered having an initial normal test, we excluded
2577 men who did have an initial abnormal with a PSA value of 4 ng/ml or above. Because
3 2343 individuals with no PSA measurement were also excluded. Some of these exclusion
criteria could be overlapping.
Unlike other reports on the subject 5, the analysis was restricted to the first two tests and did not include any further tests. This decision was based on the fact that including more
tests for men could introduce a bias in the analysis. For example, men with more tests could
have a reduced global variation because of smoothing effect of combining more information.
In addition, there could be a differential risk of cancer: men with more tests could be under
more surveillance because more at risk of cancer (for example because of a family history);
alternatively men with more tests could be at a lower risk of cancer because of prolonged
latency, and men without cancer have necessarily more PSA tests than men with a cancer
diagnosed few years after inclusion.
The prostate cancer incidence data for this study were collected up to 31 December
2009, and any occurrence of prostate cancer was included. Data on Gleason score were
extracted and classified with lesions less than 7 versus tumors with a Gleason score of 7 or
more.
The variation of PSA level between the first and second test was expressed in
percentage of variation relative to baseline value: [Variation = (Second PSA-First PSA)/ First
PSA]. This computation allows for the baseline value to be taken into account. Hence a
change from 1 ng/ml to 1.5 ng/ml would be a 50% variation similarly to a change from 2
ng/ml to 3 ng/ml would be a 50% variation. It then gives less variation for a change from 3 to
3.5 than from a change from 1 to 1.5. To describe the overall variation of PSA measured
between first and second measurement, either positive or negative, the absolute value of
4 Test of the association between PSA level at baseline and other factors was
conducted in a bivariate analysis with chi-square test.
The evaluation of the impact of individual factors, as well as baseline PSA value, on
the total variation was performed with a multivariate linear regression. The impact of age,
BMI, tobacco smoking, delay between first and second test, initial PSA value was estimated.
Risks of prostate cancer according to PSA level variations using logistic regression
were also computed. This model was adjusted for age at entry in the trial, initial PSA value
and variation in PSA between first and second test.
All analyses were conducted with SAS version 9.2 (SAS Institute, Inc., Cary, NC, USA).
Results
Among the 38,340 men participating to the intervention arm, 31,286 men had two
PSA tests within two years and with an initial value below 4 ng/mL, a level widely taken as
the upper limit of normal.
The PSA level measured in the first test was significantly (p<0.0001 chi-square test)
associated with age (Table 1).
The association of baseline PSA value was also found for BMI (p<0.0001 chi-square
test), for which lower PSA values were observed for obese patients (median 0.94 ng/ml
among the 7,337 obese patients: BMI above 30 kg/m2) and for overweight men (median 1.06 ng/ml among the 15,392 overweight patients: BMI between 25 and 30 kg/m2), as compared to men with normal BMI (median 1.11 ng/ml among the 7,880 patients with normal weight:
BMI between 18.5 and 25 kg/m2). Tobacco smoking was also significantly associated with a lower PSA level at baseline (p<0.0001 chi-square test): the median PSA for current smokers
5 smokers which PSA level was 1.08 ng/ml. The effect of tobacco smoking was independent of
BMI as in an linear regression of PSA value at baseline adjusted on BMI status, current
smoker had on average 0.10 ng/ml (95%CI (-0.14, -0.07)) less than never smokers. Race was
not significantly associated with PSA level at baseline (p=0.09 when comparing the six
different ethnic groups and p=0.25 when comparing PSA levels between non-Hispanic white
men versus non-Hispanic black men).
The median duration between first and second test was 344 days (interquartile range
[IQR]: 324; 365). From the first to second test, the median variation of PSA levels was 3.4%
(IQR: -15%; +26%) indicating that for a quarter of men the PSA level at second test was 15%
lower than at first test, and that for another quarter of men the PSA level at second test was
26% higher than at first test (figure 1).
In other words, for half of men, the change in PSA level between the first and the
second test exceeded 20%. The variation in PSA value was not significantly associated with
the delay between first and second test (p=0.36 GLM model), with age (p=0.16), with BMI
(p=0.41) and with race (p=0.12). In terms of total variation, the PSA value varied either
positively or negatively by an average of 18% between first and second test (interquartile
range: 9.2%, 36.8%).
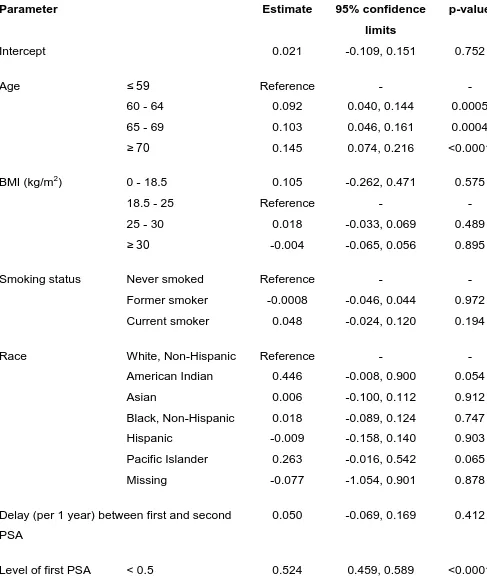
In a multivariate model of the variation of PSA, older age was significantly associated
with higher variation in PSA between first and second test. In addition the baseline value of
PSA was strongly associated with total variation: lower initial value of PSA tended to be
associated with greater total variation (table 2).
2,781 prostate cancers were diagnosed during follow-up. Adjusting for age and initial
PSA level, the risk of prostate cancer increased linearly with increasing PSA level at second
6 Table 3 shows the distribution of prostate cancer cases by variation of PSA level between
first and second test.
However, the variation in PSA was not associated with a higher Gleason score
(p=0.95 for level variations in cancer of Gleason score <7 vs ≥7 in a logistic regression model
adjusting for age and baseline PSA value). Compared to men with decrease or no change in
PSA level over time, men with variations in level of 50% or more had a 4.2 (95% CI 2.8-6.2)
greater risk to be diagnosed with a lesion having a Gleason score of 5 or less, a 2.0 (95% CI
1.7-2.4) greater risk to be diagnosed with a cancer of Gleason score ≥6 but below 8, and a
2.5 (95% CI 1.7-3.7) greater risk to be diagnosed with a cancer of Gleason score ≥8.
Discussion
In one quarter of men with an initial PSA level less than 4 ng/mL, the level of a
second PSA test performed on average one year later will be 20% lower, while for another
quarter of men it will be 20% higher. While an increase in PSA level over time is associated
with increased risk of prostate cancer, this association seems stronger for cancers of low
Gleason score than for potentially more aggressive cancers.
Boddy et al (2004) found in a series of 14 patients with benign prostatic biopsy and
an initial PSA level below 4 ng/ml that the coefficient of variation of PSA was 14.1% 12. This figure is in line with our observation of an average coefficient of variation of 18.8%.
A study focusing on PSA in relation to prostate volume found a yearly increase of PSA
associated with PSA baseline value 13. While this report also found that the initial PSA level was an important factor, lower values were found to be associated with greatest variability.
As Nichols et al (2012) used a different metric, the variation of PSA expressed as the
7 findings remained unchanged with greater variation observed for the lower values of PSA at
baseline.
The initial PSA level was lower among obese and overweight men as reported in
previous studies 14,15. In a study conducted in healthy men, free of prostate cancer, in Washington State, the geometric mean of PSA was 1.18, 1.12, and 0.94 for respectively
normal, overweight and obese men 14. These levels of PSA by obesity status were also observed in this report. Wright et al reported that this association was however partially
confounded with use of aspirin and non-steroidal anti-inflammatory drugs (NSAID) 14 which
we could not evaluate in these data. We found that further changes in PSA over time were
not associated with BMI level.
Ethnicity is a factor associated with access to care and PSA testing is not spared from
this inequality. In men with high PSA level, fewer non-Hispanic black men would conduct a
repeated PSA test as compared to non-Hispanic white, in particular for those not in the age
eligible for Medicare (less than 65) 16. However, when adjusting for age, baseline PSA and other factors, we did not found an association between change in PSA level and ethnicity as
we could have expected that if non-Hispanic black men had fewer tests. As the PLCO study
was restricted to men with two tests within two years and in the intervention arm of the
PLCO study, and because PLCO study is a randomized trial, these could have selected the
populations and reduced the impact of inequality of access to care by ethnic group.
In the PCPT study, the level of PSA was further related with severity of the disease.
Prostate cancer with a Gleason score of 7 or above were 40 % with a PSA above 4 ng/ml, as
compared to 21 % for those with a Gleason score below 7. Even among those with a PSA
8 or above being above 2 ng/ml as compared to 35% of those with a Gleason score less than 7 1
.
While we demonstrated that an elevated PSA provided an increasing risk of prostate
cancer, the results from the PLCO study are in contradiction with the PCPT study, as we
found that the initial level of PSA was unrelated to the severity of disease.
Our study has potential limitations. First, a strict selection was used with only men
with two tests within two years and no initial value of PSA greater than 4ng/ml. However,
this represented 81.6% of the initial sample and therefore a strong bias is unlikely. A
contamination by previous PSA tests could have created a bias in the evaluation of PSA
variation, however the PLCO study excluded men with more than one PSA blood test in the
previous three years. The PLCO study design adds also some limitation but also bring major
advantages for the present research. On one hand, participants to PLCO study constitutes, as
for any prospective study, a selected population with higher levels of education, lower
history of chronic disease. Hence, variations of PSA between two test could be slightly
different in the general population. On the other hand, this design enable to investigate
variation of PSA in an homogeneous population which received regular opportunity to take a
PSA test. Other design conducted in population would have been confronted to greater
biases such a self-selection for the number of tests, intervals between tests, all these related
to individual’s characteristics such as perception of risk, health status, socio-economic level,
etc.
Our study supports the idea that PSA testing cannot be considered as a perfect
marker of prostate cancer risk. This weakness is inherent to PSA as it measures a
characteristic of the prostate which is the release of an antigen in the blood. PSA is also a
9 Variation in PSA was not associated with higher Gleason score. This observation is in
agreement with the lack of effectiveness of PSA Velocity above PSA alone which was
illustrated by several studies 19.
PSA alone at low values does not seem to be a good indicator of risk of prostate
cancer as it does not help to differentiate aggressive versus indolent tumors. The use of PSA
10 References
1. Thompson IM, Ankerst DP, Chi C, et al.: Assessing prostate cancer risk: results from the Prostate Cancer Prevention Trial. J Natl Cancer Inst 2006; 98: 529-534.
2. Bunting PS: A Guide to the Interpretation of Serum Prostate Specific Antigen Levels. Clin Biochem 1995; 28: 221-241.
3. Price CP, Allard J, Davies G, et al.: Pre- and post-analytical factors that may influence use of serum prostate specific antigen and its isoforms in a screening programme for prostate cancer. Ann Clin Biochem 2001; 38: 188-216.
4. Yan Y: Intraindividual variation of prostate specific antigen measurement and implications for early detection of prostate carcinoma. Cancer 2001; 92: 776-780.
5. Eastham JA, Riedel E, Scardino PT, et al.: Variation of serum prostate-specific antigen levels: an evaluation of year-to-year fluctuations. JAMA 2003; 289: 2695-2700.
6. Maatman TJ: The role of prostate specific antigen as a tumor marker in men with advanced adenocarcinoma of the prostate. J Urol 1989; 141: 1378-1380.
7. Down L, Metcalfe C, Martin RM, et al.: Seasonal variation in prostate-specific antigen levels: a large cross-sectional study of men in the UK. BJU Int 2011; 108: 1409-1414.
8. Connolly D, van Leeuwen PJ, Bailie J, et al.: Daily, monthly and seasonal variation in PSA levels and the association with weather parameters. Prostate Cancer Prostatic Dis 2011; 14: 58-62.
9. Inman BA, Zhang J, Shah ND, et al.: An examination of the dynamic changes in prostate-specific antigen occurring in a population-based cohort of men over time. BJU Int 2012; 110: 375-381.
11 11. Andriole GL, Crawford ED, Grubb RL, 3rd, et al.: Prostate cancer screening in the randomized
Prostate, Lung, Colorectal, and Ovarian Cancer Screening Trial: mortality results after 13 years of follow-up. J Natl Cancer Inst 2012; 104: 125-132.
12. Boddy JL, Dev S, Pike DJ, et al.: Intra-individual variation of serum prostate specific antigen levels in men with benign prostate biopsies. BJU Int 2004; 93: 735-738.
13. Nichols JH, Loeb S, Metter EJ, et al.: The relationship between prostate volume and prostate-specific antigen variability: data from the Baltimore Longitudinal Study of Aging and the Johns Hopkins Active Surveillance Program. BJU Int 2012; 109: 1304-1308.
14. Wright JL, Lin DW and Stanford JL: The effect of demographic and clinical factors on the relationship between BMI and PSA levels. Prostate 2011; 71: 1631-1637.
15. Culp S and Porter M: The effect of obesity and lower serum prostate-specific antigen levels on prostate-cancer screening results in American men. BJU Int 2009; 104: 1457-1461. 16. Barocas DA, Grubb R, 3rd, Black A, et al.: Association between race and follow-up diagnostic
care after a positive prostate cancer screening test in the prostate, lung, colorectal, and ovarian cancer screening trial. Cancer 2013; 119: 2223-2229.
17. Roehrborn CG, Boyle P, Gould AL, et al.: Serum prostate-specific antigen as a predictor of prostate volume in men with benign prostatic hyperplasia. Urology 1999; 53: 581-589. 18. Nadler RB, Humphrey PA, Smith DS, et al.: Effect of inflammation and benign prostatic
hyperplasia on elevated serum prostate specific antigen levels. J Urol 1995; 154: 407-413. 19. Loughlin KR. PSA velocity: a systematic review of clinical applications. Urol Oncol.
2014;32(8):1116-25.
13 Figure legends
Figure 1. Distribution of the percentage variation of PSA level between first and second
measurement in the PLCO study. The blue curve is a kernel density estimation with
1 Word count: 2,572
Introduction
The risk of prostate cancer is directly related to the level of total prostate specific
antigen (tPSA) measured in blood 1. PSA is being considered the best biochemical marker for prostate cancer and is widely used for early detection, diagnosis and monitoring. But the
evaluation of use of PSA in screening activities showed that PSA testing induced substantial
over-diagnosis of prostate cancer, mainly due to poor specificity of the test.
It is known that serial measurements of an individual’s tPSA concentration, even
when all results are obtained by a single method, may fluctuate with higher amplitude than
can be explained by the assay’s analytical variation 2-4. This reflects an additional component of intra-individual or within-subject variation, known as biological variation.
Variation of PSA level could lead to unnecessary biopsies if based on a single
measurement. It has been shown in the Polyp Prevention Trial that, following an initial
abnormal PSA level, an important proportion of men returned to normal PSA level at the
subsequent visit (26% for an initial value above 2.5 ng/ml and 30% for an initial value above
4 ng/ml) 5.
The normal variation of PSA level has been evaluated in the past in few studies, and
already an important variation in men has been reported. In a series of eight men with
adenocarcinoma of the prostate, the maximum variation above and below the mean were of
19.3% and 17.7% 6.
The biological variation of tPSA has implications for screening and diagnosis. Single
measurements may not be sufficiently precise for screening and diagnosis. Replicate samples
and calculation of the mean concentration may improve precision by reducing the
Highlighted Manuscript (without author identifiers)
2 dispersion. Monitoring of tPSA requires an estimate of either the change needed for
significance or, alternatively, of the significance of the change.
However, subsequently there have been investigations of variation in tPSA from most
recent sources (e.g. 7-10) without any real conclusions being drawn and a lack of cohesion between findings and hypotheses investigated.
Therefore, variations of PSA levels were studied in men participating in the
intervention arm of the PLCO Study 11 and with an initial PSA level below 4 ng/mL. This database has a major advantage of standardization of the follow-up of men and a good
quality monitoring of patients and follow-up.
Material and methods
Data were extracted from the PLCO study dataset of August 2012 on all of the 38,340
men in the intervention arm. These Cancer Data Access System (CDAS) datasets are slightly
more up to date than the original report at 13 years of follow-up with reclassification of
some events based on updated data and further review, and this could explain slight
discrepancies in numbers from this report as compared to the article of Andriole et al (2012) 11
.
All potential PSA measurements were extracted for each man, so these could be part
of the annual test in the intervention or any additional test performed during follow-up. We
included men who received two valid PSA tests performed in a period of less than two years,
thus excluding 576 individuals with greater delay between two tests. As our objective was
the evaluation of PSA variability in men considered having an initial normal test, we excluded
2577 men who did have an initial abnormal test with a PSA value of 4 ng/ml or above.
3 test and 2343 individuals with no PSA measurement were also excluded. Some of these
exclusion criteria could be overlapping.
Unlike other reports on the subject 5, the analysis was restricted to the first two tests and did not include any further tests. This decision was based on the fact that including more
tests for men could introduce a bias in the analysis. For example, men with more tests could
have a reduced global variation because of smoothing effect of combining more information.
In addition, there could be a differential risk of cancer: men with more tests could be under
more surveillance because more at risk of cancer (for example because of a family history);
alternatively men with more tests could be at a lower risk of cancer because of prolonged
latency, and men without cancer have necessarily more PSA tests than men with a cancer
diagnosed few years after inclusion.
The prostate cancer incidence data for this study were collected up to 31 December
2009, and any occurrence of prostate cancer was included. Data on Gleason score were
extracted and classified with lesions less than 7 versus tumors with a Gleason score of 7 or
more.
The variation of PSA level between the first and second test was expressed in
percentage of variation relative to baseline value: [Variation = (Second PSA-First PSA)/ First
PSA]. This computation allows for the baseline value to be taken into account. Hence a
change from 1 ng/ml to 1.5 ng/ml would be a 50% variation similarly to a change from 2
ng/ml to 3 ng/ml would be a 50% variation. It then gives less variation for a change from 3 to
3.5 than from a change from 1 to 1.5. To describe the overall variation of PSA measured
between first and second measurement, either positive or negative, the absolute value of
4 Test of the association between PSA level at baseline and other factors was
conducted in a bivariate analysis with chi-square test.
The evaluation of the impact of individual factors, as well as baseline PSA value, on
the total variation was performed with a multivariate linear regression. The impact of age,
BMI, tobacco smoking, delay between first and second test, initial PSA value was estimated.
Risks of prostate cancer according to PSA level variations using logistic regression
were also computed. This model was adjusted for age at entry in the trial, initial PSA value
and variation in PSA between first and second test.
All analyses were conducted with SAS version 9.2 (SAS Institute, Inc., Cary, NC, USA).
Results
Among the 38,340 men participating to the intervention arm, 31,286 men had two
PSA tests within two years and with an initial value below 4 ng/mL, a level widely taken as
the upper limit of normal.
The PSA level measured in the first test was significantly (p<0.0001 chi-square test)
associated with age (Table 1).
The association of baseline PSA value was also found for BMI (p<0.0001 chi-square
test), for which lower PSA values were observed for obese patients (median 0.94 ng/ml
among the 7,337 obese patients: BMI above 30 kg/m2) and for overweight men (median 1.06 ng/ml among the 15,392 overweight patients: BMI between 25 and 30 kg/m2), as compared to men with normal BMI (median 1.11 ng/ml among the 7,880 patients with normal weight:
BMI between 18.5 and 25 kg/m2). Tobacco smoking was also significantly associated with a lower PSA level at baseline (p<0.0001 chi-square test): the median PSA for current smokers
5 smokers which PSA level was 1.08 ng/ml. The effect of tobacco smoking was independent of
BMI as in an linear regression of PSA value at baseline adjusted on BMI status, current
smoker had on average 0.10 ng/ml (95%CI (-0.14, -0.07)) less than never smokers. Race was
not significantly associated with PSA level at baseline (p=0.09 when comparing the six
different ethnic groups and p=0.25 when comparing PSA levels between non-Hispanic white
men versus non-Hispanic black men).
The median duration between first and second test was 344 days (interquartile range
[IQR]: 324; 365). From the first to second test, the median variation of PSA levels was 3.4%
(IQR: -15%; +26%) indicating that for a quarter of men the PSA level at second test was 15%
lower than at first test, and that for another quarter of men the PSA level at second test was
26% higher than at first test (figure 1).
In other words, for half of men, the change in PSA level between the first and the
second test exceeded 20%. The variation in PSA value was not significantly associated with
the delay between first and second test (p=0.36 GLM model), with age (p=0.16), with BMI
(p=0.41) and with race (p=0.12). In terms of total variation, the PSA value varied either
positively or negatively by an average of 18% between first and second test (interquartile
range: 9.2%, 36.8%).
In a multivariate model of the variation of PSA, older age was significantly associated
with higher variation in PSA between first and second test. In addition the baseline value of
PSA was strongly associated with total variation: lower initial value of PSA tended to be
associated with greater total variation (table 2).
2,781 prostate cancers were diagnosed during follow-up. Adjusting for age and initial
PSA level, the risk of prostate cancer increased linearly with increasing PSA level at second
6 Table 3 shows the distribution of prostate cancer cases by variation of PSA level between
first and second test.
However, the variation in PSA was not associated with a higher Gleason score
(p=0.95 for level variations in cancer of Gleason score <7 vs ≥7 in a logistic regression model
adjusting for age and baseline PSA value). Compared to men with decrease or no change in
PSA level over time, men with variations in level of 50% or more had a 4.2 (95% CI 2.8-6.2)
greater risk to be diagnosed with a lesion having a Gleason score of 5 or less, a 2.0 (95% CI
1.7-2.4) greater risk to be diagnosed with a cancer of Gleason score ≥6 but below 8, and a
2.5 (95% CI 1.7-3.7) greater risk to be diagnosed with a cancer of Gleason score ≥8.
Discussion
In one quarter of men with an initial PSA level less than 4 ng/mL, the level of a
second PSA test performed on average one year later will be 20% lower, while for another
quarter of men it will be 20% higher. While an increase in PSA level over time is associated
with increased risk of prostate cancer, this association seems stronger for cancers of low
Gleason score than for potentially more aggressive cancers.
Boddy et al (2004) found in a series of 14 patients with benign prostatic biopsy and
an initial PSA level below 4 ng/ml that the coefficient of variation of PSA was 14.1% 12. This figure is in line with our observation of an average coefficient of variation of 18.8%.
A study focusing on PSA in relation to prostate volume found a yearly increase of PSA
associated with PSA baseline value 13. While this report also found that the initial PSA level was an important factor, lower values were found to be associated with greatest variability.
As Nichols et al (2012) used a different metric, the variation of PSA expressed as the
7 findings remained unchanged with greater variation observed for the lower values of PSA at
baseline.
The initial PSA level was lower among obese and overweight men as reported in
previous studies 14,15. In a study conducted in healthy men, free of prostate cancer, in Washington State, the geometric mean of PSA was 1.18, 1.12, and 0.94 for respectively
normal, overweight and obese men 14. These levels of PSA by obesity status were also observed in this report. Wright et al reported that this association was however partially
confounded with use of aspirin and non-steroidal anti-inflammatory drugs (NSAID) 14 which
we could not evaluate in these data. We found that further changes in PSA over time were
not associated with BMI level.
Ethnicity is a factor associated with access to care and PSA testing is not spared from
this inequality. In men with high PSA level, fewer non-Hispanic black men would conduct a
repeated PSA test as compared to non-Hispanic white, in particular for those not in the age
eligible for Medicare (less than 65) 16. However, when adjusting for age, baseline PSA and other factors, we did not found an association between change in PSA level and ethnicity as
we could have expected that if non-Hispanic black men had fewer tests. As the PLCO study
was restricted to men with two tests within two years and in the intervention arm of the
PLCO study, and because PLCO study is a randomized trial, these could have selected the
populations and reduced the impact of inequality of access to care by ethnic group.
In the PCPT study, the level of PSA was further related with severity of the disease.
Prostate cancer with a Gleason score of 7 or above were 40 % with a PSA above 4 ng/ml, as
compared to 21 % for those with a Gleason score below 7. Even among those with a PSA
8 or above being above 2 ng/ml as compared to 35% of those with a Gleason score less than 7 1
.
While we demonstrated that an elevated PSA provided an increasing risk of prostate
cancer, the results from the PLCO study are in contradiction with the PCPT study, as we
found that the initial level of PSA was unrelated to the severity of disease.
Our study has potential limitations. First, a strict selection was used with only men
with two tests within two years and no initial value of PSA greater than 4ng/ml. However,
this represented 81.6% of the initial sample and therefore a strong bias is unlikely. A
contamination by previous PSA tests could have created a bias in the evaluation of PSA
variation, however the PLCO study excluded men with more than one PSA blood test in the
previous three years. The PLCO study design adds also some limitation but brings major
advantages for the present research. On one hand, participants to the PLCO study
constitutes, as for any prospective study, a selected population with higher levels of
education, lower history of chronic disease. Hence, variations of PSA between two tests
could be slightly different in the general population. On the other hand, this design enables
to investigate variation of PSA in a homogeneous population which received regular
opportunity to take a PSA test. Other design conducted in the population would have been
confronted to greater biases such a self-selection for the number of tests, intervals between
tests, all these related to individual’s characteristics such as perception of risk, health status,
socio-economic level, etc.
Our study supports the idea that PSA testing cannot be considered as a perfect
marker of prostate cancer risk. This weakness is inherent to PSA as it measures a
characteristic of the prostate which is the release of an antigen in the blood. PSA is also a
9 Variation in PSA was not associated with higher Gleason score. This observation is in
agreement with the lack of effectiveness of PSA Velocity above PSA alone which was
illustrated by several studies 19.
PSA alone at low values does not seem to be a good indicator of risk of prostate
cancer as it does not help to differentiate aggressive versus indolent tumors. The use of PSA
10 References
1. Thompson IM, Ankerst DP, Chi C, et al.: Assessing prostate cancer risk: results from the Prostate Cancer Prevention Trial. J Natl Cancer Inst 2006; 98: 529-534.
2. Bunting PS: A Guide to the Interpretation of Serum Prostate Specific Antigen Levels. Clin Biochem 1995; 28: 221-241.
3. Price CP, Allard J, Davies G, et al.: Pre- and post-analytical factors that may influence use of serum prostate specific antigen and its isoforms in a screening programme for prostate cancer. Ann Clin Biochem 2001; 38: 188-216.
4. Yan Y: Intraindividual variation of prostate specific antigen measurement and implications for early detection of prostate carcinoma. Cancer 2001; 92: 776-780.
5. Eastham JA, Riedel E, Scardino PT, et al.: Variation of serum prostate-specific antigen levels: an evaluation of year-to-year fluctuations. JAMA 2003; 289: 2695-2700.
6. Maatman TJ: The role of prostate specific antigen as a tumor marker in men with advanced adenocarcinoma of the prostate. J Urol 1989; 141: 1378-1380.
7. Down L, Metcalfe C, Martin RM, et al.: Seasonal variation in prostate-specific antigen levels: a large cross-sectional study of men in the UK. BJU Int 2011; 108: 1409-1414.
8. Connolly D, van Leeuwen PJ, Bailie J, et al.: Daily, monthly and seasonal variation in PSA levels and the association with weather parameters. Prostate Cancer Prostatic Dis 2011; 14: 58-62.
9. Inman BA, Zhang J, Shah ND, et al.: An examination of the dynamic changes in prostate-specific antigen occurring in a population-based cohort of men over time. BJU Int 2012; 110: 375-381.
11 11. Andriole GL, Crawford ED, Grubb RL, 3rd, et al.: Prostate cancer screening in the randomized
Prostate, Lung, Colorectal, and Ovarian Cancer Screening Trial: mortality results after 13 years of follow-up. J Natl Cancer Inst 2012; 104: 125-132.
12. Boddy JL, Dev S, Pike DJ, et al.: Intra-individual variation of serum prostate specific antigen levels in men with benign prostate biopsies. BJU Int 2004; 93: 735-738.
13. Nichols JH, Loeb S, Metter EJ, et al.: The relationship between prostate volume and prostate-specific antigen variability: data from the Baltimore Longitudinal Study of Aging and the Johns Hopkins Active Surveillance Program. BJU Int 2012; 109: 1304-1308.
14. Wright JL, Lin DW and Stanford JL: The effect of demographic and clinical factors on the relationship between BMI and PSA levels. Prostate 2011; 71: 1631-1637.
15. Culp S and Porter M: The effect of obesity and lower serum prostate-specific antigen levels on prostate-cancer screening results in American men. BJU Int 2009; 104: 1457-1461. 16. Barocas DA, Grubb R, 3rd, Black A, et al.: Association between race and follow-up diagnostic
care after a positive prostate cancer screening test in the prostate, lung, colorectal, and ovarian cancer screening trial. Cancer 2013; 119: 2223-2229.
17. Roehrborn CG, Boyle P, Gould AL, et al.: Serum prostate-specific antigen as a predictor of prostate volume in men with benign prostatic hyperplasia. Urology 1999; 53: 581-589. 18. Nadler RB, Humphrey PA, Smith DS, et al.: Effect of inflammation and benign prostatic
hyperplasia on elevated serum prostate specific antigen levels. J Urol 1995; 154: 407-413. 19. Loughlin KR. PSA velocity: a systematic review of clinical applications. Urol Oncol.
2014;32(8):1116-1125.
12 Figure legends
Figure 1. Distribution of the percentage variation of PSA level between first and second
measurement in the PLCO study. The blue curve is a kernel density estimation with
E. Figure(s): #1
Table 1. Distribution of men with an initial PSA value below 4 ng/ml by age and
PSA value at entry in the intervention arm of the PLCO study.
Age group
PSA value
ref: ≤ 59 60-64 65-69 ≥ 70 Total
PSA <0.5 n 1,790 1,527 911 461 4,689
% 17.0% 15.3% 13.0% 12.4%
PSA 0.5-1 n 3,943 3,259 2,008 996 10,206
% 37.4% 32.6% 28.6% 26.7%
PSA 1-1.5 n 2,228 2,076 1,387 698 6,389
% 21.1% 20.8% 19.8% 18.7%
PSA 1.5-2 n 1,161 1,212 1,005 527 3,905
% 11.0% 12.1% 14.3% 14.1%
PSA 2-3 n 983 1,266 1,098 668 4,015
% 9.3% 12.7% 15.6% 17.9%
PSA 3-4 n 441 647 612 382 2,082
% 4.2% 6.5% 8.7% 10.2%
Total n 10,546 9,987 7,021 3,732 31,286
Table 2. Predictors of the percentage variation in PSA level between first and
second test in the PLCO study. Results from a multivariate linear model
adjusting for all variables
Parameter Estimate 95% confidence
limits
p-value
Intercept 0.021 -0.109, 0.151 0.752
Age ≤ 59 Reference - -
60 - 64 0.092 0.040, 0.144 0.0005
65 - 69 0.103 0.046, 0.161 0.0004 ≥ 70 0.145 0.074, 0.216 <0.0001
BMI (kg/m2) 0 - 18.5 0.105 -0.262, 0.471 0.575
18.5 - 25 Reference - -
25 - 30 0.018 -0.033, 0.069 0.489
≥ 30 -0.004 -0.065, 0.056 0.895
Smoking status Never smoked Reference - -
Former smoker -0.0008 -0.046, 0.044 0.972
Current smoker 0.048 -0.024, 0.120 0.194
Race White, Non-Hispanic Reference - -
American Indian 0.446 -0.008, 0.900 0.054
Asian 0.006 -0.100, 0.112 0.912
Black, Non-Hispanic 0.018 -0.089, 0.124 0.747
Hispanic -0.009 -0.158, 0.140 0.903
Pacific Islander 0.263 -0.016, 0.542 0.065
Missing -0.077 -1.054, 0.901 0.878
Delay (per 1 year) between first and second
PSA
0.050 -0.069, 0.169 0.412
Level of first PSA < 0.5 0.524 0.459, 0.589 <0.0001
[image:31.595.48.535.179.765.2](ng/ml) Ref: 0.5 - 1 Reference - -
1 - 1.5 -0.060 -0.119, -0.001 0.045
1.5 - 2 -0.114 -0.184, -0.045 0.001
2 - 3 -0.128 -0.197, -0.059 0.0003
Table 3. Distribution of prostate cancer cases according to PSA levels
PSA (ng/mL) Men without prostate
cancer (percentage )
Gleason < 7
(percentage)
Gleason ≥ 7
(percentage)
Total
< 0.5 4, 643 (16.29) 19 (1.22) 26 (2.17) 4,688
ref: 0.5 - 1 9,924 (34.81) 142 (9.13) 136 (11.37) 10,202
1 - 1.5 5,914 (20.75) 245 (15.75) 226 (18.9) 6,385
1.5 - 2 3,398 (11.92) 275 (17.67) 228 (19.06) 3,901
2 - 3 3,208 (11.25) 473 (30.4) 324 (27.09) 4,005
3 - 4 1,418 (4.97) 402 (25.84) 256 (21.4) 2,076
Total 28,505 1,556 1,196 31,257
Missing PSA 29