City, University of London Institutional Repository
Citation:
Webster, J., Trieu, K., Dunford, E. & Hawkes, C. (2014). Target Salt 2025: A Global Overview of National Programs to Encourage the Food Industry to Reduce Salt in Foods. Nutrients, 6(8), pp. 3274-3287. doi: 10.3390/nu6083274This is the published version of the paper.
This version of the publication may differ from the final published
version.
Permanent repository link:
http://openaccess.city.ac.uk/14499/Link to published version:
http://dx.doi.org/10.3390/nu6083274Copyright and reuse: City Research Online aims to make research
outputs of City, University of London available to a wider audience.
Copyright and Moral Rights remain with the author(s) and/or copyright
holders. URLs from City Research Online may be freely distributed and
linked to.
nutrients
ISSN 2072-6643
www.mdpi.com/journal/nutrients
Article
Target Salt 2025: A Global Overview of National Programs to
Encourage the Food Industry to Reduce Salt in Foods
Jacqui Webster 1,*, Kathy Trieu 1, Elizabeth Dunford 1 and Corinna Hawkes 2
1 The George Institute for Global Health, Food Policy Division, World Health Organization
Collaborating Centre on Population Salt Reduction, Sydney 2050, Australia;
E-Mails: ktrieu@georgeinstitute.org.au (K.T.); edunford@georgeinstitute.org.au (E.D.)
2 World Cancer Research Fund, Policy and Public Affairs, London WC1B 3HH, UK;
E-Mail: c.hawkes@wcrf.org
* Author to whom correspondence should be addressed; E-Mail: jwebster@georgeinstitute.org.au; Tel: +61-299-934-520; Fax: +61-299-934-250.
Received: 16 July 2014; in revised form: 7 August 2014 / Accepted: 11 August 2014 / Published: 21 August 2014
Abstract: Reducing population salt intake has been identified as a priority intervention to reduce non-communicable diseases. Member States of the World Health Organization have agreed to a global target of a 30% reduction in salt intake by 2025. In countries where most salt consumed is from processed foods, programs to engage the food industry to reduce salt in products are being developed. This paper provides a comprehensive overview of national initiatives to encourage the food industry to reduce salt. A systematic review of the literature was supplemented by key informant questionnaires to inform categorization of the initiatives. Fifty nine food industry salt reduction programs were identified. Thirty eight countries had targets for salt levels in foods and nine countries had introduced legislation for some products. South Africa and Argentina have both introduced legislation limiting salt levels across a broad range of foods. Seventeen countries reported reductions in salt levels in foods—the majority in bread. While these trends represent progress, many countries have yet to initiate work in this area, others are at early stages of implementation and further monitoring is required to assess progress towards achieving the global target.
1. Introduction
At the World Health Assembly in May 2013, all Member States of the World Health Organization signed up to the target to reduce salt intake by 30% by 2025 [1]. Salt reduction has been shown to be one of the most cost-effective, and in some cases, cost-saving ways of reducing the growing burden of non-communicable diseases, primarily through reducing the incidence of cardiovascular diseases and strokes [2]. The physiological requirement for salt is less than 1 gram per day [3], however, most populations are eating between 9 and 12 grams [4]. Excess salt intake progressively elevates blood pressure levels throughout life, which greatly increases the risks of vascular disease [5,6] and is likely responsible for about half of the disease burden ascribed to high blood pressure [7]. In the US, it is projected that an intervention reducing salt by 3 g/day would save between 10 and 24 billion dollars in health costs each year [8]. Similarly high levels of health care savings have been found in other countries—including low and middle income economies.
The contribution of different foods to salt in the diet varies across the globe, with as much as 95% of dietary salt estimated to come from processed foods in the UK compared to 63% in Japan (20% from soy sauce alone). In contrast, as much as 76% of dietary salt comes from home cooking in the South of China [9]. Whilst the relative proportion of each differs from country to country processed products contributing to salt in the diet usually include bread, breakfast cereals, processed meats, dairy products, soups and sauces (particularly soy sauce and fish sauce in many Asian countries), biscuits and salty snacks [10]. Where processed foods contribute significantly to salt in the diet it means that, even if people try to reduce their salt intake by not adding salt, they will still consume large amounts in the foods that constitute their usual diets. This means it is very difficult to reduce population salt intake by approaches that seek to change consumer behavior because the salt that is obvious to individuals (the salt that they add during cooking or at the table) is only a fraction of their daily consumption [11]. The most effective means of reducing salt consumption in these cases is to reduce the salt content of manufactured and catered foods as this does not rely on changes to consumer behavior [4,12]. The WHO and numerous national and regional government advisory groups, including the United Kingdom’s Scientific Advisory Group on Nutrition, The United States Institute of Medicine and the Pan American Health Organization, have therefore been encouraging manufacturers to reduce the salt levels in processed foods for many years [13–15] and specific examples of countries who have taken this route are well reported, including Finland and Japan in the 1970s and the UK in the 2000s [16,17].
2. Methods
2.1. Search Strategy
As part of a broader review of progress on national salt reduction initiatives, this study identified and documented programs to engage the food industry to reduce salt in foods by:
• Systematically reviewing peer-reviewed and grey literature and consulting international experts. • Recording programs in a database based on pre-defined criteria.
• Sending questionnaires to country program leaders to supplement/verify information.
The systematic search of the peer-reviewed if the literature included the following databases: Cochrane Central Register of Controlled Trials (CENTRAL), Cochrane Public Health Group Specialized Register, MEDLINE, EMBASE, Effective Public Health Practice Project Database, Web of Science, TRoPHI databases and LILACS database. Search terms used included “salt”, “sodium”, “strategy”, “intervention”, “initiative” or “government”. A targeted search for pertinent grey literature documents was conducted in OpenGrey, Google, World Health Organization and regional office databases and websites, governmental websites (e.g., Food Standards Agency, Public Health Agency of Canada, Centers for Disease Control and Prevention), scientific or non-governmental organization websites (e.g., Institute of Medicine, Food Safety Authority of Ireland, Heart Foundation) and international or national salt reduction associations (e.g., World Action on Salt and Health).
A database of initiatives on salt reduction initiatives was established based on the information identified. Details were verified through questionnaires sent to country contact people. Information on programs to engage the food industry to reduce salt in foods was then extracted and analysed.
2.2. Inclusion and Exclusion Criteria
National strategies were defined as having government involvement and either a written strategy or one or more specific initiatives focused on reducing salt. Programs of work with the food industry were defined as either a series of meetings or established forum, or the development of voluntary or regulatory targets for salt levels in foods for the industry to achieve in a given timescale. Government statements or policies stating that the food industry should reduce salt in foods were not viewed as engagement with the food industry to reduce salt in foods.
2.3. Data Extraction and Analysis
3. Results
3.1. Approach to Working with the Industry and Product Categories
Out of the 83 countries that were identified with salt reduction strategies in place or planned, 59 countries reported programs of work with the industry to reduce salt in foods. Twelve others reported future plans in this area. Approaches to working with the food industry vary between negotiating commitments through industry meetings, agreeing voluntary targets for specific product categories, or establishing mandatory limits (legislation).
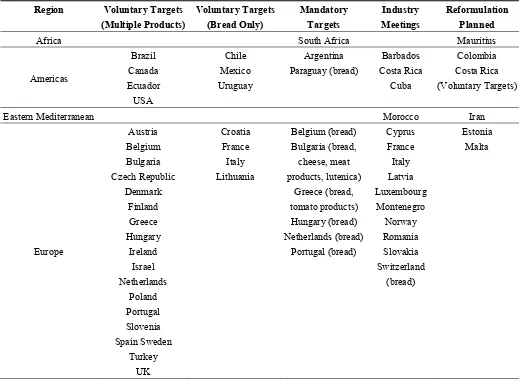
[image:5.595.38.558.407.790.2]Twenty three out of the 59 countries reported industry meetings and 38 had established voluntary and/or mandatory sodium content targets. Thirty five countries established voluntary targets. Out of these, twenty two had voluntary targets for multiple food products (15 in Europe, 3 in the Americas and 4 in the Western Pacific Region), eight had voluntary targets just for bread, four countries had targets for bread and processed meats and one country had targets just for dehydrated soups and sauces. Nine countries had established mandatory sodium targets, all of which had a target for bread. Two countries (South Africa and Argentina) had mandatory targets for a range of food products, two countries had mandatory targets for up four product categories and five countries (all in Europe or the Americas) had mandatory targets for bread only (See Table 1).
Table 1. National approaches to working with the food industry to reduce salt in foods.
Region Voluntary Targets
(Multiple Products) Voluntary Targets (Bread Only) Mandatory Targets Industry Meetings Reformulation Planned
Africa South Africa Mauritius
Americas Brazil Canada Ecuador USA Chile Mexico Uruguay Argentina Paraguay (bread) Barbados Costa Rica Cuba Colombia Costa Rica (Voluntary Targets)
Eastern Mediterranean Morocco Iran
Table 1.Cont.
Region Voluntary Targets
(Multiple Products)
Voluntary Targets (Bread Only)
Mandatory Targets
Industry Meetings
Reformulation Planned
Eastern Mediterranean Morocco Iran
South East Asia
Bangladesh * Indonesia Sri Lanka Thailand
Sri Lanka (Mandatory targets)
Western Pacific
Australia Cook Islands
Fiji Korea New Zealand *
Mongolia Federated States of Micronesia
Japan Malaysia New Caledonia
Singapore
French Polynesia Guam Samoa Solomon Islands
Tonga Vanuatu Viet Nam
* Non-governmental organization leading reformulation.
3.2. Mechanisms for Monitoring
There are a number of different approaches to monitoring salt levels with varying degrees of comprehensibility, objectivity, accuracy and resource intensiveness. At the least objective and resource intensive end of the spectrum, food companies can be asked to report on the changes they have made (industry self-report). In the middle, regular food label surveys can be undertaken to establish baseline salt levels [18] and monitor changes [19,20] and branded food composition databases can be established to ensure progress by food companies can be evaluated [20]. At the other end of the spectrum chemical analysis of food composition is the most accurate and transparent way of monitoring changes to sodium levels in foods.
Forty four of the 59 countries with food industry programs reported having established monitoring mechanisms. The most frequently reported approach was chemical analysis of food (15), or chemical analysis with some other form of monitoring: chemical analysis of foods and databases (8), chemical analysis and industry report (5) or chemical analysis of foods and survey of food labels (2). Ten countries reported using just other forms of monitoring: database (3), food label surveys (2) and industry self-report (5). Three countries indicated that they were using three methods to monitor salt levels in foods. One country (Ecuador) indicated it was monitoring progress but did not specify a mechanism.
3.3. Documented Changes in Salt Levels
All of the reductions that were reported were where there were targets for salt levels for that particular food category. The majority were voluntary targets. Argentina, Belgium and the Netherlands reported reductions where mandatory targets were in place.
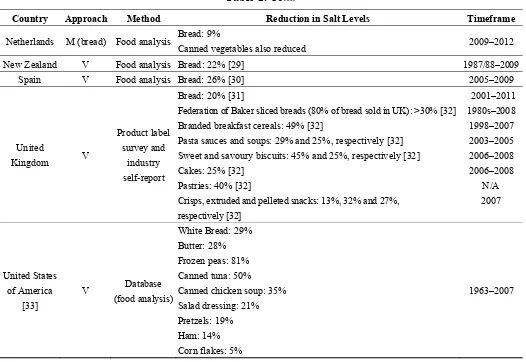
[image:7.595.40.558.212.762.2]The majority of the reductions reported (68%) were based on chemical analysis of food, except for Austria, Italy and Malaysia which were based on industry self-report, and Australia, Canada and the UK where reductions were based on product surveys (See Table 2).
Table 2. Impact of programs of industry engagement on salt levels in foods.
Country Approach Method Reduction in Salt Levels Timeframe
Argentina V * Food analysis Bread: 18% [21] 2009–2010
Australia [22] V Product label survey
Bread: 9%
Breakfast cereals: 25% Processed meats: 8%
2010–2013
Austria V Industry self-report Not across the sector-surveyed 112 bakeries and found
30 tonnes of salt reduced in bread/pastry 2011–2013
Belgium M Food analysis Bread: 6% [23] 1990–2009
Canada V Product label survey
Not across the sector-small survey of sodium levels on labels found a 11% reduction in pantry breads, 14% in breakfast cereals and 8% in canned soups
2009–2011
Chile V Food analysis Bread (maraquetta): 38% [24] 2010–2012
Finland V Food analysis Bread: 20% [25]
Meat products, cheese and ready meals: 20%–25% [26] 1990s–2009
France [27] V Food analysis
Bread: 12%
Pizzas & quiches: 23% Soups: 32%
Mixed dishes: 17%
2008–2011 2003–2011 2003–2011 2003–2011
Ireland [28] V Food analysis
White Bread: 18% Wholemeal bread: 29%
Breakfast cereals: 30% in biscuit based cereals to 59% in cornflake based cereals
Fresh and packet soups: 12% and 19% respectively Cooking sauces: 35% in Bolognese sauce to 71% in black bean sauce
Butter: 18%
2003–2013
2003–2011
2005–2013 2004–2012
2007–2011
Italy V (bread) Industry self-report (currently being analyzed)
Reductions in baking products, sauces, processed meats
(salami, ham) 2013
Malaysia IM Industry self-report
Not across the sector. 30 high in salt food items have reduced salt content by 1% to 40%
Biscuit categories: 11%–35% Tomato sauce: 9.5%–40% Instant noodles: 2%–20%
Flavorings cubes/powder: 1.1%–16% Frozen meat: 13%
2011–2012
Table 2.Cont.
Country Approach Method Reduction in Salt Levels Timeframe
Netherlands M (bread) Food analysis Bread: 9%
Canned vegetables also reduced 2009–2012
New Zealand V Food analysis Bread: 22% [29] 1987/88–2009
Spain V Food analysis Bread: 26% [30] 2005–2009
United
Kingdom V
Product label survey and
industry self-report
Bread: 20% [31]
Federation of Baker sliced breads (80% of bread sold in UK): >30% [32] Branded breakfast cereals: 49% [32]
Pasta sauces and soups: 29% and 25%, respectively [32] Sweet and savoury biscuits: 45% and 25%, respectively [32] Cakes: 25% [32]
Pastries: 40% [32]
Crisps, extruded and pelleted snacks: 13%, 32% and 27%, respectively [32]
2001–2011 1980s–2008 1998–2007 2003–2005 2006–2008 2006–2008
N/A 2007
United States of America
[33]
V Database (food analysis)
White Bread: 29% Butter: 28% Frozen peas: 81% Canned tuna: 50%
Canned chicken soup: 35% Salad dressing: 21% Pretzels: 19% Ham: 14% Corn flakes: 5%
1963–2007
V: Voluntary sodium targets established; M: mandatory sodium targets established; IM: negotiating commitments to lower sodium through industry meetings. * Argentina’s targets became mandatory in 2012, after the period of change reported here.
3.4. Extent of Reductions
Reductions ranged from 6% (Belgium) to 38% (Chile) in breads with the UK, Canada, New Zealand and Ireland all also reporting between 20% and 30% reductions in breads. For other product categories, reductions range from 5% (cornflakes, USA) to 81% (frozen peas, USA) (See Table 2).
4. Discussion
This is the first comprehensive global overview of progress to work with the food industry to get companies to reduce salt in foods. The number of countries reporting food industry has more than doubled since a previous review in 2010 [17]. Fifty nine countries, 80% of the countries with national strategies to reduce salt, now include programs of work with the food industry.
bread, or for bread and other food categories. Two countries, South Africa and Argentina, have recently established legislation for a wide range of product categories.
All of the countries that have demonstrated an impact have set targets for salt levels in foods except for Malaysia, which just negotiated the reductions through industry meetings. Mostly the targets were voluntary, although three countries (Netherlands, Belgium and Argentina) reported reductions in salt levels in breads as a result of mandatory targets. Other countries with voluntary and legislated targets had yet to report on progress.
Many public health experts believe regulation is a much stronger driver for industry reformulation than voluntary agreements as it usually carries a penalty for non-compliance [34,35]. Yet many voluntary programs seem to be making progress. That said, whilst the targets for salt levels in foods in Finland are currently voluntary, the effectiveness of Finland’s salt reduction program is often attributed to the introduction of legislative requirements to label the salt content of foods in the 1980s. Products containing more than a specified amount of salt had to carry a high salt warning, which resulted in food companies reformulating products to avoid this and some high salt products disappearing off the market altogether [36]. Likewise, the success of the UK initiative, whilst based on voluntary agreements, is attributed to sustained strong government leadership and pressure, reinforced by robust monitoring mechanisms, and underpinned by active NGOs [17,32].
In some countries laws are difficult to introduce, taking a considerable amount of time to move through bureaucratic processes. They may also be less flexible, so that once a law is established it’s difficult to change. Had the UK Food Standards Agency targets been enshrined in law initially, for example, it would have taken longer to revise them once it became apparent that the food industry was going to be able to make larger reductions in a shorter timescale. For this reason, many countries prefer to adopt voluntary approaches, establishing partnerships with the food industry to negotiate agreements and ensuring adequate monitoring mechanisms are in place to hold the food industry to account. Often the penalty for non-compliance in these cases is the threat of negative publicity when surveys highlighting the salt content of foods are published [18,19].
On the other hand, arguments in favour of legislation include the fact that fiscal penalties for non-compliance can be introduced, legislation is more difficult to disband if a new government comes into power and it is better at creating a level playing field for the industry as all companies are forced to comply [37]. Most laws for salt levels in foods are relatively newly established so there has been insufficient time to demonstrate an impact. Ongoing monitoring of the legislation in Argentina, South Africa and other countries is now required to demonstrate the feasibility and likely impact of legislation to other countries with a view to supporting uptake in other countries.
a 30% reduction by 2025. This fact was recognized by the UK Food Standards Agency when it first developed their Salt Model in 2003. Whilst this established that just four food product categories (white bread, bacon and ham, breakfast cereals and homemade meat-based dishes) contributed around 40% of non-discretionary salt to the UK diet, a whole range of other food categories (cheese, sausages, fat spreads, baked beans, milk and cream, other bread, soup, pizza, crisps and savory snacks and meat pies) each contributed between 2% and 4% so the only way to effectively reduce population salt intake was to target this wide range of product categories.
The EU Framework for national salt reduction initiatives also suggests that Member States select at least five categories to focus on and make stepwise reductions seeking to achieve a 16% reduction on average for these food products over four years [38,39].
However, out of the 17 countries that had demonstrated an impact, only five countries reported reductions across a wide range of product categories. Canada, Finland, Italy and Australia reported reductions in three product categories. The Netherlands reported reductions in salt levels in bread and canned vegetables. The other seven countries reported reductions just in bread. Whilst it may have not been possible to capture all the reductions made through the research undertaken here, it seems clear that more countries will need to get the food industry to reduce salt in a greater number of product categories to achieve subtle long-term changes in consumer preferences for less salty foods and to maximize the opportunity for achieving the global targets for salt reduction.
Most (73%) of the countries had mechanisms in place for monitoring the progress of industry salt reduction programs, with analysis of food composition to determine sodium content being the most frequently reported monitoring mechanism (73%). Out of the 17 countries that had demonstrated an impact, 14 were based on analysis of food composition. Whilst food analysis is undoubtedly the most accurate method of assessing individual food products, it can be expensive to do comprehensively. Key elements required for this type of monitoring are that it be objective and transparent in both methods and outcomes, be undertaken in a systematic way on a regular basis and that it be quantitative in nature. For the purpose of improving the nutritional composition of the food supply there are some key issues that need to be addressed—data accuracy and reliability, the ability to update information regularly, the ability to access data easily and affordably, completeness of coverage, independent third-party monitoring and brand/product-specific information.
Whilst not reported on in this research, the Global Food Monitoring Group (FMG) has begun work to collate data on the nutritional composition of processed foods in multiple countries using comprehensive large scale product label surveys [20] with the aim of objectively and transparently monitoring changes in the nutritional composition of processed foods globally. Currently, the FMG has representation from 31 countries, with over 200,000 products (both packaged and processed at the barcode level and food service items) included (68). Data have already been used by public health researchers to show the often wide variation in sodium levels in foods [40–43].
inaccurate cases generally containing less risk-associated nutrients (such as sodium and saturated fat) than the specified value on the label [44–46]. Whilst product sales data could provide more insight into the precise impact of changes in salt content of different food products on population salt intake, these data are usually expensive to access and have limits on usage and sharing of information, and comprehensive branded information across the whole product category is provides and adequately robust and more feasible assessment [47].
Where monitoring is based on food analysis it is not always clear, from the data reported by countries, whether sodium reductions have been made across the board or just for some brands in the category. Whilst it is encouraging if some brands, particularly leading brands, are making changes in the right direction, it is important to make sure that changes are being made across the board as far as possible. The FMG approach provides an alternative approach to doing this and it is important that the public health researchers responsible for these surveys are linked with the government representatives responsible for salt reduction strategies to ensure that larger scale product label surveys can be used in parallel with food composition analysis where appropriate.
In fact, building on that theme of cross-sector collaboration, whilst a key strength of the research here is the systematic comprehensive approach, one limitation is that national surveys of this kind rely on the point of view of one country representative. Whilst in most cases they are responsible for the government strategy, they do not always have a complete overview of all of the relevant work in the country, or the perspectives of different stakeholders in the complex food policy environment. In future, multi-stakeholder research would be useful to supplement some of the survey findings. Such research could also help to establish a deeper understanding of what the main factors that contribute to the effectiveness and sustainability of different programs are. This could include technical limits on salt reduction and the potential use of salt substitutes to overcome this, the nature of marketing of lower salt content, the role of NGO and advocacy organisations in both lobbying and monitoring progress, and the potential for international government and food industry agreements to support progress.
This review has focused on engagement with the food industry to reduce salt in foods. However, most salt reduction strategies are multi-faceted and comprise of parallel programs to change consumer attitudes and behaviours relating to salt often backed by clearer front of pack labeling. The relative impact of these different elements and how they inter-relate with each other will be the subject of a subsequent review by the authors. Integrating salt reduction into broader nutrition education, health promotion and non-communicable disease prevention programs [48] should also be a priority, particularly where resources are scarce and there is limited workforce capacity.
5. Conclusions
under a voluntary framework. Whilst almost one third of the countries with programs in place have already demonstrated an impact, most programs are at early stages of implementation, the scope of existing programs will need to be widened and many countries still need to develop programs to ensure the global target of a 30% reduction by 2025 can be achieved, this in turn will prevent millions of avoidable deaths globally and reduce the health care budgets of countries by many millions of dollars each year.
Acknowledgments
The authors would like to thank national country contacts who responded to the questionnaires and provided additional information. We would also like to thank the World Health Organization staff and international experts who helped to identify initiatives and facilitate introductions to country contacts including Godfrey Xuereb, Cherian Varghese, Peter Hoejskov, Norm Campbell, Branka Legetic, Rodrigo Rodriguez-Fernandez, Feisul Mustapha, Victoria Target and Fabienne Meier.
Jacqui Webster was supported by a Heart Foundation and Stroke Foundation Postdoctoral Research Fellowship, was awarded a University of Sydney Travelling Research Fellowship, and received additional funding from the World Health Organization, the National Health and Medical Research Council and the Victorian Health Promotion Foundation for work on salt reduction during the period of this research.
Author Contributions
Webster, J. designed the study. Trieu, K. conducted the survey, established the data management systems and undertook the preliminary analysis. Webster, J. produced the first draft of the manuscript. Dunford, E. contributed material on monitoring approaches. Hawkes, C. provided input to study design and edited the draft manuscript. All authors reviewed and approved the final draft.
Conflicts of Interests
Jacqui Webster is currently Director of the World Health Organization Collaborating Centre on Population Salt Reduction at the George Institute for Global Health. From 2003 to 2003, she led the team responsible for implementing the UK Government’s salt reduction strategy. She frequently meets with food companies and food industry trade groups in the context of this work.
The other authors declare no conflict of interest.
References
1. World Health Organization. A Comprehensive Global Monitoring Framework Including Indicators and a Set of Voluntary Global Targets for the Prevention and Control of Non-Communicable Diseases. Available online: http://www.who.int/nmh/events/2012/ discussion_paper2_20120322.pdf (accessed on 27 June 2014).
3. Dahl, L.K.; Leitl, G.; Heine, M. Influence of dietary potassium and sodium/potassium molar ratios on the development of salt hypertension. J. Exp. Med. 1972, 136, 318–330.
4. He, F.J.; MacGregor, G.A. Reducing population salt intake worldwide: From evidence to implementation. Prog. Cardiovasc. Dis. 2010, 52, 363–382.
5. Strazzullo, P.; D’Elia, L.; Kandala, N.B.; Cappuccio, F.P. Salt intake, stroke, and cardiovascular disease: Meta-analysis of prospective studies. BMJ 2009, 339, b4567, doi:10.1136/bmj.b4567. 6. Mohan, S.; Campbell, N. Salt and high blood pressure. Clin. Sci. 2009, 117, 1–11.
7. Asaria, P.; Chisholm, D.; Mathers, C.; Ezzati, M.; Beaglehole, R. Chronic disease prevention: Health effects and financial costs of strategies to reduce salt intake and control tobacco use.
Lancet 2007, 370, 2044–2053.
8. Bibbins-Domingo, K.; Chertow, G.M.; Coxson, P.G.; Moran, A.; Lightwood, J.M.; Pletcher, M.J.; Goldman, L. Projected effect of dietary salt reductions on future cardiovascular disease. N. Engl. J. Med. 2010, 362, 590–599.
9. Anderson, C.A.; Appel, L.J.; Okuda, N.; Brown, I.J.; Chan, Q.; Zhao, L.; Ueshima, H.; Kesteloot, H.; Miura, K.; Curb, J.D.; et al. Dietary sources of sodium in China, Japan, the United Kingdom, and the United States, women and men aged 40 to 59 years: The INTERMAP study.
J. Am. Diet Assoc. 2010, 110, 736–745.
10. Mattes, R.D.; Donnelly, D. Relative contributions of dietary sodium sources. J. Am. Coll. Nutr.
1991, 10, 383–393.
11. Campbell, N.R.C.; Johnson, J.A.; Campbell, T.S. Sodium Consumption: An Individual’s Choice?
Int. J. Hypertens. 2012, 2012, 6, doi:10.1155/2012/860954.
12. Stamler, J.; Rose, G.; Stamler, R.; Elliott, P.; Dyer, A.; Marmot, M. INTERSALT study findings: Public health and medical care implications. Hypertension 1989, 14, 570–577.
13. Scientific Advisory Committee on Nutrition. Salt and Health; The Stationery Office: London, UK, 2003.
14. Institute of Medicine. Strategies to Reduce Sodium Intake in the United States; The National Academies Press: Washington, DC, USA, 2010.
15. Legetic, B.; Campbell, N. Reducing salt intake in the Americas: Pan American Health Organization actions. J. Health Commun. 2011, 16, 37–48.
16. He, F.J.; MacGregor, G.A. A comprehensive review on salt and health and current experience of worldwide salt reduction programmes. J. Hum. Hypertens. 2009, 23, 363–384.
17. Webster, J.L.; Dunford, E.K.; Hawkes, C.; Neal, B.C. Salt reduction initiatives around the world.
J. Hypertens. 2011, 29, 1043–1050.
18. Webster, J.L.; Dunford, E.K.; Neal, B.C. A systematic survey of the sodium contents of processed foods. Am. J. Clin. Nutr. 2010, 91, 413–420.
19. Trevena, H.; Dunford, E.; Neal, B.; Webster, J. The Australian Food and Health Dialogue—The implications of the sodium recommendation for pasta sauces. Public Health Nutr. 2014, 17, 1647–1653.
20. Dunford, E.; Webster, J.; Metzler, A.B.; Czernichow, S.; Ni Mhurchu, C.; Wolmarans, P.; Snowdon, W.; L’Abbe, M.; Li, N.; Maulik, P.K.; et al. International collaborative project to compare and monitor the nutritional composition of processed foods. Eur. J. Prev. Cardiol. 2012,
21. NCD Health Promotion and Control Department, Ministry of Health. “Menos SAL, Mas VIDA” Initiative—Experience in Argentina. Available online: http://www.paho.org/hq/index.php? option=com_docman&task=doc_download&gid=15753&Itemid= (accessed on 25 June 2014). 22. Trevena, H.; Neal, B.; Dunford, E.K.; Wu, J. An Evaluation of the effects of the Australian Food
and Health Dialogue targets on the salt content of bread, breakfast cereals, and processed meats.
Nutr. J. 2014, in press.
23. Laquiere, I. Federal Public Service Health, Food Chain Safety and Environment, Brussels, Belgium. Belgium: Situation of Salt in Bread. 2012, Unpublished work.
24. World Action on Salt and Health. Chile—Salt Action Summary. Available online: http://www.worldactiononsalt.com/worldaction/southamerica/53711.html (accessed on 13 January 2014).
25. Salovaara, H. Technologies of Salt Reduction in Bread: Issues, Problems and Solutions. Available online: http://ec.europa.eu/health/nutrition_physical_activity/docs/ev20091021_salovaara_en.pdf (accessed on 25 June 2014).
26. World Health Organization. Mapping Salt Reduction Initiatives in the WHO European Region; WHO Regional Office for Europe: Copenhagen, Danmark, 2013.
27. De L’Agence Nationale de Sécurité Sanitaire de L’alimentation de L’environnement et du Travail. Relatif au Suivi des Teneurs en sel des Principaux Vecteurs Entre 2003 et 2011 et Simulation des Impacts sur les Apports en sel de la Population Française. Available online: http://www.anses.fr/Documents/NUT2012sa0052.pdf (accessed on 25 June 2014).
28. Food Safety Authority of Ireland. Monitoring of Salt in Processed Foods: Septemeber 2003 to April 2014. Available online: https://www.fsai.ie/uploadedFiles/Science_and_Health/Salt_and_ Health/Salt_Surveys_2003_onwards.pdf (accessed on 20 June 2014).
29. Vannoort, R.; Thomson, B. 2009 New Zealand Total Diet Study—Agricultural Compound Residues, Selected Contaminant and Nutrient Elements; Ministry of Agriculture and Forestry: Wellington, New Zealand, 2009.
30. Ballesteros, J. Workshop on Salt Reduction in Bread. Available online: http://ec.europa.eu/health/ nutrition_physical_activity/docs/ev20091021_ballesteros_en.pdf (accessed on 25 June 2014). 31. Brinsden, H.C.; He, F.J.; Jenner, K.H.; MacGregor, G.A. Surveys of the salt content in
UK bread: Progress made and further reductions possible. BMJ Open 2013, 3, e002936, doi:10.1136/bmjopen-2013-002936.
32. Wyness, L.A.; Butriss, J.L.; Stanner, S.A. Reducing the population’s sodium intake: The UK Food Standards Agency’s salt reduction programme. Public Health Nutr. 2012, 15, 254–261. 33. Earl, R.U.S. Industry Approaches to Salt Reduction. Available online: http://new.paho.org/hq/
dmdocuments/2011/salt_mtg_gma.pdf (accessed on 25 June 2014).
34. Webster, J. Reformulating Food Products for Health: Context and Key Issues for Moving forward in Europe; European Commission: Brussels, Belgium, 2009.
35. Monteiro, C.A.; Gomes, F.S.; Cannon, G. The snack attack. Am. J. Public Health 2010, 100, 975–981.
37. Campbell, N.R.; Neal, B.C.; MacGregor, G.A. Interested in developing a national programme to reduce dietary salt? J. Hum. Hypertens. 2011, 25, 705–710.
38. High Level Group on Diet Physical Activity and Health. National Salt Initiatives: Implementing the EU Framework for Salt Reduction Initiatives. Available online: http://ec.europa.eu/health/ archive/ph_determinants/life_style/nutrition/documents/national_salt_en.pdf (accessed on 25 June 2014).
39. Food Standards Agency. Working with Catering Businesses for Healthier Choices. Available online: http://collections.europarchive.org/tna/20100927130941/http://food.gov.uk/healthiereating/healthyc atering/cateringbusiness/ (accessed on 26 June 2014).
40. Christoforou, A.K.; Dunford, E.K.; Neal, B.C. Changes in the sodium content of Australian ready meals between 2008 and 2011. Asia Pac. J. Clin. Nutr. 2013, 22, 138–143.
41. Dunford, E.; Webster, J.; Woodward, M.; Czernichow, S.; Yuan, W.L.; Jenner, K.; Ni Mhurchu, C.; Jacobson, M.; Campbell, N.; Neal, B. The variability of reported salt levels in fast foods across six countries: Opportunities for salt reduction. CMAJ 2012, 184, 1023–1028.
42. Dunford, E.K.; Eyles, H.; Mhurchu, C.N.; Webster, J.L.; Neal, B.C. Changes in the sodium content of bread in Australia and New Zealand between 2007 and 2010: Implications for policy.
Med. J. Aust. 2011, 195, 346–349.
43. Ni Mhurchu, C.; Capelin, C.; Dunford, E.K.; Webster, J.L.; Neal, B.C.; Jebb, S.A. Sodium content of processed foods in the United Kingdom: Analysis of 44,000 foods purchased by 21,000 households. Am. J. Clin. Nutr. 2011, 93, 594–600.
44. Cook, K.K.; Gregory, N.R.; Weaver, C.M. Agreement between analytical values and label declarations of sodium content of processed packaged foods. J. Am. Diet Assoc. 1990, 90, 1085–1088.
45. Pantazopoulos, P.; Kwong, K.; Lillycrop, W.; Wong, L.; Gao, Y.; Chalouh, S.; Samadhin, M.; Ratnayake, W.M.; Krenosky, S.; Dumais, L.; et al. Trans and saturated fat on food labels in Canada: Fact or fiction? Can. J. Public Health 2011, 102, 313–316.
46. Fabiansson, S.U. Precision in nutritional information declarations on food labels in Australia.
Asia Pac. J. Clin. Nutr. 2006, 15, 451–458.
47. Ng, S.W.; Dunford, E. Complexities and opportunities in monitoring and evaluating US and global changes by the food industry. Obes. Rev. 2013, 14, 29–41.
48. World Cancer Research Fund. WCRF International Food Policy Framework for Healthy Diets: NOURISHING. Available online: http://www.wcrf.org/policy_public_affairs/nourishing_ framework/ (accessed on 14 July 2014).