Validation of Algorithms to Estimate Distribution
Network Characteristics Using
Power-Hardware-in-the-Loop Configuration
Maria Segovia, Islam Rohouma, Qiteng Hong
University of StrathclydeGlasgow, UK
Stephane Chretien, Paul Clarkson
NPLLondon, UK
Abstract— Distribution system operators (DSOs) require accurate knowledge of the status of the network in order to ensure the continuity and quality of power supply. In this context, the National Physical Laboratory (NPL) and the Power Network Demonstrations Centre (PNDC) have been working together in the development and validation of optimal sensor placement and network topology estimation algorithms. This paper presents the description of two of these algorithms as well as the topology configuration of the PNDC distribution network considered to gather measurements for the validation of the algorithms. A Power-Hardware-in-the-Loop (P-HiL) configuration has been used as the testbed, where a number of physical measurement devices are installed in the physical network and an extended number of devices are virtually installed in the simulate network. The applications of the proposed algorithms to the measurements along with results from the P-HiL tests are presented in the paper.
Index Terms—Optimal sensor placement, topology estimation, hardware in the loop, distribution network measurements.
I. INTRODUCTION
At present distribution grids are comprised of a large number of nodal points but a limited number of measurements mainly due to economic reasons. However, the distribution network landscape is changing, with increasing penetration of distributed energy resources and energy storage devices at medium and low voltage levels. The behaviour of the network is becoming more dynamic due to for example the intermittent nature of distributed generation (DG) [1]. Therefore, distribution system operators (DSOs) require accurate knowledge of the network status in order to ensure the continuity and reliability of power supply, i.e. knowledge of voltage levels and power flow at nodal points and branches, as well as the network topology is required.
In this context, a joint European research project ‘Sensor Network Metrology for the Determination of Electrical Grid Characteristics’ (ENG63) has been initiated with a key element on the development of network characterizing algorithms to estimate grid parameters and topology, as well
as the application of such algorithms in the context of real distribution networks for comprehensive validation. The Power Network Demonstration Centre (PNDC) is one of the partners in this project, and as such is working with the National Physical Laboratory (NPL) to test the developed algorithms by providing real measurements from the distribution network at the centre.
The PNDC is a research facility on Smart Grids applications at the University of Strathclyde. The centre has an outdoor compound with interconnected 11 kV and 400 V networks and can be configured as an urban, hybrid (urban/rural) or rural network, with a capability of emulating 11 kV distribution lines of up to 60 km in length. Furthermore, the centre has a real time digital simulator (RTDS) system able to simulate a wide range of power system networks and interact with the PNDC distribution network extending its capabilities [2].
This paper provides an overview of two of the algorithms developed/applied for the ENG63, i.e. an optimal sensor placement algorithm and a topology algorithm. The paper also describes the P-HiL configuration at PNDC that couples the physical network and simulated grid modelled in RTDS to obtain measurements for the validation process of the ENG63 algorithms. As part of the process, high accuracy Current Transformers (CTs) and Voltage Transformers (VTs) have been installed on the PNDC network, so the uncertainty in the measurements is reduced.
II. PROPOSED NETWORK CHARACTERIZING ALGORITHMS This section provides an overview of the algorithms utilized for the European project ENG63, i.e. an optimal sensor placement algorithm and a topology determination/verification algorithm.
A. Optimal sensor placement algorithms
Distribution networks at present are comprised of a large number of nodal points but a limited number of measurement points. The transition to smart grids, with more generation at the low voltage and medium voltage, as well as storage, require an accurate knowledge of voltage levels and power flows at the nodal points and branches, however it is not cost effective to obtain measurements at every node and branch.
Estimation of the values of electrical parameters (e.g. voltage) at nodes and branches can be done using state estimation algorithms. A number of real measurements can be combined with state estimation techniques to obtain accurate up to date nodal voltage and power flows. With a limited number of sensors to be placed, the aim of the optimal placement sensor algorithms is to select the optimal location in order to obtain the most accurate estimations of these values.
The placement method proposed in this paper is based on the idea that the measurement operator should be well conditioned. One possible way to specify such conditioning is based on the Restricted Isometry Property coming from Compressed Sensing theory [3]. This property is extensively used in recent Burer-Monteiro types of factorisations for solving certain Semi-Definite programming problems in Matrix Compressed Sensing [4]. In practice, however, the Restricted Isometry Property can be verified in polynomial time, having to resort to weaker properties such as incoherence [5]. The coherence of an operator is the maximum (absolute) scalar product between the image of two canonical basis matrices by the measurement operator. A measurement operator is said to be incoherent if the coherence is small. The relationships between incoherence and a weak version of the Restricted Isometry Property were studied in [6] and improved in [7].
Based on these previous considerations, the following approach is adopted: extract the smallest set of measurements matrices such that the resulting measurement sub-operator has coherence below a given prior value. This can be intuitively performed by selecting measurements which are as orthogonal to each other as possible. One particularly efficient approach was recently devised in [8]. The idea is to start with a random measurement matrix and add up new matrices which have small scalar product with the previously selected ones. This is performed by minimizing the Euclidean norm of the scalar products. The algorithm steps are given below:
1. Set s = 1. Choose a random singleton {j} ∈ {1,…,p} 2. Let j’∈{1,…,p}\{j} minimizing
'
j t j
X
X
3. Set T = {j,j’} and
( )
T t TX
X
2 2λ
η
( )=
4. while η(s)≥ 1 - ε do
5. Set j(s)∈ argmin j∈(1,…,p)\T
2 ' j t j
X
X
6. Set 2
( )
22
μ
α
X
X
ss
j t T s ) ( ) (
=
7. Set T = T ∪ {j(s)}
8. ( ) ( )
(
)
− − + − − =
= = + s i s s i s s s i i s i 2 2 2 0 2 2 1 1 1 2 1 ) ( ) ( ) ( 2 ) ( , min η η μ α μ α η η9. s ← s+1
being X ∈ ℜn×p, λ
i the ith eigenvalue,
1
+ +
+
−
=
λ
so sλ
so sε
and μ the coherence value.Other approaches have also been proposed in [9] using Eigenvalue optimization and the Self and Liang asymptotic theory of constrained estimation problems. The greedy approach described above was observed to me more scalable, an essential property for large networks.
B. Topology detemination/verification algorithms
Optimal operation of the distribution network depends not only on the correct estimation of nodal voltages and power flows, but also its operational topology [10]. Knowledge of the correct topology is essential for safety service restoration after outages, failure identification, grid reconfiguration, etc. [11],[12].
Most of the literature on topology determination algorithms is based on state estimation results and measurements matching different topologies, e.g. [13], however the accuracy of these algorithms is limited by the state estimator [11]. In [11], [12] an algorithm based on times series analysis of phasor measurement units (PMUs) is proposed. The algorithm compares a trend vector, obtained from system observations with a library of possible topology transitions. However PMUs are not yet extended on distribution networks. The author in [14] utilises weighted least squares (WLS) of the measurements residues to determine the topology of the network.
The algorithm considered here was proposed in [15], and it aims at learning the grid operational structure for radial distribution networks, assuming that the vast majority of distribution grids are operated as radial networks and switches in the network are used to achieve one radial configuration out of many possibilities. This algorithm has been tested by the authors using simulated networks, our aim for ENG63 is to apply it to measurements obtained from the PNDC network.
[image:2.612.317.561.66.179.2]The algorithm is based on graph theory, being a graph an ordered pair of vertices and edges (V, E), where the edges join pairs of vertices [16] (see Figure 1). A graph can represent different structures, in this particular case vertices correspond to the nodal points and edges to branches. The substations are at the root, and the customers are at the other end of the nodal points.
Furthermore, in a distribution network with more than one substation, it is assumed that one node cannot be connected to more than one substation at a time. Switching operations change the substation connected to specific nodes. Other assumptions made in this paper are:
1. The current configuration remains intact for sufficient time for load profiles at grid nodes to attain a steady distribution.
2. Nodal measurements are available but not edge measurements.
3. Resistance and reactance on all lines are known. 4. Finally, the substations are considered as slack buses. The proposed algorithm relies on linearized Power Flow (PF) models. The power flow linearized equations are shown below:
(
)
(
)
(
)
( )
(
)
(
)
(
)
( )
∈ ∈
− −
− =
− −
− =
T T
ab
b ab a b ab a b
a
ab
b ab a b ab a b
a
g q
p
ε ε
θ θ ε
ε β
ε ε β θ θ β
:
: (1)
where εT represents the operational branches within a
radial tree, εɑ is the voltage deviation at node ɑ and θɑ represents the voltage phase at the same bus.
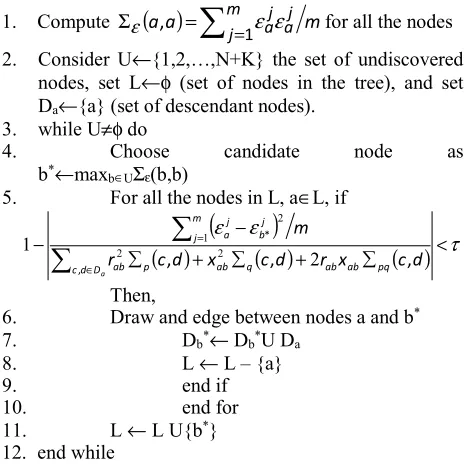
The steps of the proposed topology algorithm are given below. This algorithm considers the following inputs Σp, Σq
and Σpq, i.e. matrices of second order moments of the active,
reactive power; m observations of voltage deviation εj, 1≤j≤m;
resistances, r, and reactances, x, in all branches; and a set tolerance value τ.
Algorithm steps:
1. Compute
( )
=
=
Σε a,a mj 1εajεaj mfor all the nodes
2. Consider U←{1,2,…,N+K} the set of undiscovered nodes, set L←φ (set of nodes in the tree), and set Da←{a} (set of descendant nodes).
3. while U≠φ do
4. Choose candidate node as
b*←max
b∈UΣε(b,b)
5. For all the nodes in L, a∈L, if
(
)
( )
( )
( )
τε ε
<
+
+
− −
∈
=
a D d
c ab p ab q ab ab pq
m j
j b j a
d c x r d c x d c r
m
,
*
, ,
, 2
1 2 1 2
2
Then,
6. Draw and edge between nodes a and b*
7. Db*← Db*U Da
8. L ← L – {a}
9. end if
10. end for
11. L ← L U{b*}
12. end while
The algorithm works in the following way: Each substation plus connected nodes structure is reconstructed sequentially moving from the peripheral nodes to the root nodes. At each stage there is a set of undiscovered nodes that are not part of the current reconstructed structure. At each step the node with the largest second order moment of voltage
deviation is selected and an edge is added between this node and one of the nodes already in the structure. The edge is added by checking the condition given in step 5. The authors in [13] demonstrate that the denominator and numerator of the expression in 5 are equal when an infinite number of observations are gathered.
III. PNDC NETWORK CONFIGURATION AND INSTRUMENTATION
Among other assets, PNDC network has a motor generation (MG) set with 1MVA motor coupled with 5MVA synchronous generator. The MG set has been used to establish P-HiL capability (more detail is presented in Section IV). In addition, the PNDC network has nine substations with different volt ampere (VA) ratings as well as low voltage (LV) load banks equivalent to a total of 600 kVA.
[image:3.612.318.554.253.427.2][image:3.612.68.300.420.653.2]
Figure 2 PNDC Network Configuration and instrumentation
Figure 2 shows PNDC configuration used for the ENG63 project, as well as the location of the high accuracy sensors for voltage and current measurements installed during the project.
The proposed network configuration comprises of the motor generator (MG) set and two 11kV feeders. Each of the feeders is connected to a group of 11/0.4 kV step down transformers. Five load banks are connected at the secondary side of the step down transformer. These load banks are synchronized and the load follows a pre-programmed load profile run by a script from a remote computer.
The network instrumentation for the ENG63 project is limited to the 11kV side of the network. However, more measurements could be taken at low voltage (LV) side using the remote terminal unit (RTU) or portable power quality meters. The CTs and VTs are distributed to ensure that the measurements are carried out at nodes with different line impedances.
A. PNDC Sensors and measurment acquisations
Figure 3 shows the overhead line (OHL) voltage transformer, VOG-24 (ABB) with accuracy class of 0.2 [17] on the left, and Rogowski tube current sensor with accuracy class 0.5 on the right. The total number of sensors installed are eight sets: 3 sets of VTs (9 in total), and 5 sets of Rogowski CTs. Regarding the Rogowski CTs, 4 sets are tube coil type and 1 set is rigid coil, which offer higher accuracy, class (≈ 0.1), than the tube coil. The Rogowski current sensors are located in the ground mounted substations cable box around the 11kV cable. The reason for the selection of Rogowski coils for the project is the limited physical space inside the junction boxes that would not allow for the installation of conventional CTs.
Figure 3 Voltage and Current Sensors
Additionally, the PNDC has fast data acquisition computers (FastDAQ) from BECKHOFF automation. The FastDAQ system comprises of a powerful central processing units (CPU) with 2.1 GHz quad core processor [18]. The CPU is connected to a number of I/O modules, with a sampling frequency of 10 kHz, which are connected to the real current and voltage sensors by hardwire at one end, and communicate with the main CPU via EtherCAT communication protocol using EtherCAT coupler module.
[image:4.612.85.266.232.335.2]Fig. 4 shows the full current/voltage loops from end to end. The current measuring loops starts from the Rogowski coil sensor(s) located at the 11kV network, where the Rogowski coil small signal output feeds an integrator hardware. The signal integrator converts the input signal from the coil to the corresponding voltage to feed the 4-channels analog input terminal (EL3104) card from BECKHOFF [19]. The integrator output is sampled at 10 kHz and digitalized with 16 bits Analogue to Digital Converter (ADC). After that, the converted measurement is transmitted via Ethernet-based fieldbus system (EtherCAT) protocol to the EtherCAT coupler attached to the 4-channels analog input terminal (EL3104). The data that represent the measurement are transmitted eventually using EtherCAT protocol over single mode fiber to the remote basic central processing unit (CPU) module (CX2040) where the phasor measurement unit (PMU) algorithm is running to process the received data and determines the magnitudes and phases for voltage and current. Eventually, the data representing the measurements are monitored and logged for future retrieval using TwinCAT3 software
Figure 4 Current and Voltage Loop and Measurement Acquisition
Unlike the current measuring loop, the voltage measuring loop starts with the secondary voltage of the ABB VOG-24 OHL voltage transformer that feeds the power monitoring oversampling terminal (EL3773) as show in Figure 4 However, the rest of the loop is the same as the current measuring loop. The main reasons for using the BECKHOFF solution are the configuration (software, hardware) flexibility and the high accuracy measurements offered in addition to the possibility of continuous integration of the newly installed sensors. The BECKHOFF unit can be interfaced using different communication protocols such as distributed network protocol (DNP), MODBUS, and IEC 60870 for future integration with the supervisory control and data acquisition (SCADA) or historian server for longer data logging.
IV. POWER-HARDWARE-IN-THE-LOOP
To validate the proposed network characteristic estimation algorithms, ideally all sensors devices should be installed in real distribution networks with the collected data feeding to the proposed algorithms. However, this could be costly due to the potentially large number of sensors required and the associated installation cost. Furthermore, using a real network for test offers very limited flexibility as it is difficult to create the required test scenarios and to change the locations of the sensors could be time-consuming. Therefore, in this work, a P-HiL configuration [20], which is considered to offer a realistic, cost effective and flexible testing environment [21], has been used as the testbed for the validation of the proposed methodologies.
P-HiL is a method that has been widely used for testing prototype systems that require power exchange between a physical network and a simulated wider network. Figure 5
Figure 5 P-HiL configuration
As the validation of the developed algorithms require more sensors than the ones installed in the physical network to supply data, a number of virtual sensors are installed in the simulated grid. The advantages of such an approach are as follows: the physical sensors suppling real data from the physical network allow the validation of the data quality and the interface between the physical sensors and the device running the algorithms; the combination of using physical and virtual sensors ensures the algorithms have sufficient data to perform their function; the virtual sensors and the simulated grid can be more easily reconfigured, reducing the work required for testing under different network topology and sensor placement configurations, thus offering a more cost-effective and flexible testing solution.
As shown in Figure 5 , the P-HiL setup contains two main parts, i.e. the simulated IEEE 34-node network in RTDS and the physical network at the PNDC. The interaction between the simulated and the physical systems is achieved using the MG set, which is used as the power interface for exchanging power between the virtual and physical systems. A dedicated control algorithm has been developed for controlling the voltage of the MG set’s terminal (Node S) to be synchronous with the voltage at the virtual node (Node 810), i.e. the control algorithm ensures the frequency, phase, and magnitude of the voltages at these two nodes are matched. The output current of the MG set is measured and fed back to control a current source in the simulated system. This allows the loop to be closed, i.e. any changes in the power flow in the physical network can be reflected in the simulated system. In the feedback loop, a scaling factor can be applied so that the physical load can represent desired levels of demand in simulation. For example, if there is only a limited size of load bank available, by manipulating the scaling factor to an appropriate value larger than 1, the load can be fed back to represent the required size of demand, thus offering a higher level of flexibility.
V. EXPERIMENTAL RESULTS
This section presents some results of the application of the proposed network characterizing algorithms described in Section II.
A. Results of the of the sensor placement algorithm
Presently, a full set of measurement data for the grid is not available so random measurement data was generated in simulation on the model of the RTDS and PNDC combination and tests were carried out using these values as a reference. The placement algorithm was run with different numbers of sensors and compared to random placements.
[image:5.612.327.548.293.445.2]Fig. 6 shows the histogram for the root mean squared error when 61 placements are drawn uniformly at random from a choice of 164 possible measurement locations (these include active and reactive power in the branches and voltage magnitude at the buses, voltage angles are not included. Each measurement is considered separately, i.e. if active power is measured in a given branch, reactive power in that branch is not automatically chosen). We also show (red dot) the root mean squared error obtained using the new methodology with 61 measurements placed in the locations chosen by the algorithm. As these results show the method performs better than a random placement with high probability.
Figure 6 Histogram of mean squared errors from random placements
B. Results of the of the topology algorithm
For the application of this algorithm, the P-HiL configuration described in in Figure 5 is considered. Resistance and reactance in each branch are known. As can be observed, the network is fed by one substation. A total of 1200 measurements of voltage deviation, active and reactive power were taken from each node during 20 minutes. The load was changed in steps as it is shown in Figure 7.
Figure 7 Load profile during experiment
For the application of the algorithm to the measurements, just a single phase is considered. Branches where the impedance is zero are ignored. The nodes ignored for this application are: 808, 810, 814, 818, 820, 822, 826, 856, 852, 888, 864, 842, 838 and E.
At low tolerance values (see Section II.B) the topology algorithm struggles to reconstruct the network, being able to reconstruct connection between 3 nodes for a tolerance of 0.01. If a large tolerance value is used, close to 1, the network is reconstructed almost completely, only one is not correctly assigned to the correspondent branch, this is node 848 in Fig. 5, however this might lead to unconnected nodes appearing as being connected as mentioned in [15].
VI. CONCLUSIONS AND FUTURE WORK
In this paper, an optimal sensor placement algorithm and a network topology estimation algorithm have been presented. The configuration of a P-HiL setup at PNDC for testing these proposed network characterizing algorithms has been described, which offers a realistic test environment for the algorithm and the measurement devices with minimized number of sensors required. Preliminary results from the tests have been presented which shows that the sensor placement algorithm works well with the simulated data from the P-HiL setup, resulting in lower errors than the majority of randomly configured placements. Regarding the proposed topology algorithm it performs well at high tolerance values, although this is not ideal as it might lead to unconnected nodes appearing as connected. The future work will focus on continuing the tests under different network topologies and operating conditions and feeding back the test results for improving the proposed network characterizing algorithms.
VII. ACKNOLEDGEMENT
This work has been funded by joint European research project ENG63, which belongs to the European Metrology Research Programme (EMRP).
VIII. REFERENCES
[1] J. Liu, F. Ponci, A. Monti, C. Muscas, P. A. Pegoraro and S. Sulis, "Optimal meter placement for robust measurement
systems in active distribution grids," IEEE Transactions on
Instrumentation and Measurement, vol. 63, no. 2, pp. 1096-1105, 2014.
[2] C. D. Booth, F. Coffele and G. M. Burt, "The Power Networks Demonstration Centre: an environment for accelerated testing, demonstration and validation of existing and novel protection
and automation systems," in 12th IET International
Conference on Developments in Power System Protection, Copenhagen, 2014.
[3] S. Foucart and H. Rauhut. A mathematical introduction to
compressive sensing, vol. 1, New York: Springer, 2013.
[4] R. Ge, C. Jin, and Y. Zheng, "No Spurious Local Minima in
Nonconvex Low Rank Problems: A Unified Geometric
Analysis". arXiv preprint arXiv:1704.00708, 2017.
[5] E. Candes and J. Romberg, "Sparsity and incoherence in
compressive sampling".Inverse Prob., vol. 23, no. 3, pp.
969-985, 2007.
[6] J. A. Tropp, "Norms of random submatrices and sparse
approximation". Comptes Rendus Mathematique, vol. 346, no. 23, pp.1271-1274, 2008.
[7] S. Chrétien and S. Darses, "Invertibility of random submatrices
via tail-decoupling and a matrix Chernoff inequality". Statistics & Probability Letters, vol. 82, no. 7, pp.1479-148, 2012.
[8] S. Chretien and Z.W.O Ho. "Singular perturbation of
incoherent matrices" (in preparation).
[9] J. Black, S. Chretien, P. Clarkson and A. Forbes, "Optimal
design for quadratic observations. An approach based on Semi-Definite Relaxation, sensitivity analysis and compressed sensing with application to power grids," unpublished, presented at the Gridsens final workshop, 2017.
[10] D. Deka, S. Backhaus and M. Chertkov, "Estimating distribution grid topologies: A graphical learning based
approach," in Power Systems Computation Conference, Genoa,
2016.
[11] G. Cavraro, R. Arghandeh, K. Poolla and A. von Meier, "Data-driven approach for distribution network topology detection," in Power & Energy Society General Meetings, 2015 EEE, Denver, 2015.
[12] G. Cavraro, R. Arrghandeh, G. Barchi and A. von Meier, "Distribution network topology detection with time-series
measurements," in IEEE PES Innovative Smart Grid
Technologies, Uruguay, 2015.
[13] G. N. Korres and N. M. Manousakis, “A state estimation algorithm for monitoring topology changes in distribution
systems,” in Power and Energy Society General Meeting, 2012
IEEE. San Diego, California, 2012.
[14] Z. Tian, and W. Wu, B. Zhang "A mixed integer quadratic programming model for topology identification in distribution network”. IEEE Transactions on Power Systems, 2015.
[15] D. Deka, S. N. Backhaus and M. Chertkov, "Structure learning and estatistical estimation in distribution networks - Part I", Los Alamos National Laboratory, Los Alamos, 2015.
[16]R.J. Wilson. Introduction to graph theory, Edinburgh,
Longman, 1996.
[17]Outdoor voltage transformer type VOG-24 brouchure.
[18]CX2040 basic CPU module Beckhoff.
[19]EL3104 | 4-channel analog input terminal.
[20]Q. Hong, C. Abdulhadi, A. Roscoe, and C. Booth, "Application
of a MW-Scale Motor-Generator Set to Establish Power-Hardware-in-the-Loop Capability" (Accepted) ISGT Europe, Torino, Italy, 2017
[21]E. de Jong et al., European white book on real-time power
![Figure 1 Example of graph (source: [16])](https://thumb-us.123doks.com/thumbv2/123dok_us/1488761.101549/2.612.317.561.66.179/figure-example-graph-source.webp)