ScienceDirect
Available online at Available online at www.sciencedirect.comwww.sciencedirect.com
ScienceDirect
Energy Procedia 00 (2017) 000–000
www.elsevier.com/locate/procedia
1876-6102 © 2017 The Authors. Published by Elsevier Ltd.
Peer-review under responsibility of the Scientific Committee of The 15th International Symposium on District Heating and Cooling.
The 15th International Symposium on District Heating and Cooling
Assessing the feasibility of using the heat demand-outdoor
temperature function for a long-term district heat demand forecast
I. Andrić
a,b,c*, A. Pina
a, P. Ferrão
a, J. Fournier
b., B. Lacarrière
c, O. Le Corre
c aIN+ Center for Innovation, Technology and Policy Research - Instituto Superior Técnico, Av. Rovisco Pais 1, 1049-001 Lisbon, PortugalbVeolia Recherche & Innovation, 291 Avenue Dreyfous Daniel, 78520 Limay, France
cDépartement Systèmes Énergétiques et Environnement - IMT Atlantique, 4 rue Alfred Kastler, 44300 Nantes, France
Abstract
District heating networks are commonly addressed in the literature as one of the most effective solutions for decreasing the greenhouse gas emissions from the building sector. These systems require high investments which are returned through the heat sales. Due to the changed climate conditions and building renovation policies, heat demand in the future could decrease, prolonging the investment return period.
The main scope of this paper is to assess the feasibility of using the heat demand – outdoor temperature function for heat demand forecast. The district of Alvalade, located in Lisbon (Portugal), was used as a case study. The district is consisted of 665 buildings that vary in both construction period and typology. Three weather scenarios (low, medium, high) and three district renovation scenarios were developed (shallow, intermediate, deep). To estimate the error, obtained heat demand values were compared with results from a dynamic heat demand model, previously developed and validated by the authors.
The results showed that when only weather change is considered, the margin of error could be acceptable for some applications (the error in annual demand was lower than 20% for all weather scenarios considered). However, after introducing renovation scenarios, the error value increased up to 59.5% (depending on the weather and renovation scenarios combination considered). The value of slope coefficient increased on average within the range of 3.8% up to 8% per decade, that corresponds to the decrease in the number of heating hours of 22-139h during the heating season (depending on the combination of weather and renovation scenarios considered). On the other hand, function intercept increased for 7.8-12.7% per decade (depending on the coupled scenarios). The values suggested could be used to modify the function parameters for the scenarios considered, and improve the accuracy of heat demand estimations.
© 2017 The Authors. Published by Elsevier Ltd.
Peer-review under responsibility of the Scientific Committee of The 15th International Symposium on District Heating and Cooling.
Keywords:Heat demand; Forecast; Climate change
Energy Procedia 141 (2017) 460–464
1876-6102 © 2017 The Authors. Published by Elsevier Ltd.
Peer-review under responsibility of the scientific committee of the 4th International Conference on Power and Energy Systems Engineering.
10.1016/j.egypro.2017.11.059
10.1016/j.egypro.2017.11.059
© 2017 The Authors. Published by Elsevier Ltd.
Peer-review under responsibility of the scientific committee of the 4th International Conference on Power and Energy Systems Engineering.
1876-6102
Available online at www.sciencedirect.com
ScienceDirect
Energy Procedia 00 (2017) 000–000
www.elsevier.com/locate/procedia
1876-6102 © 2017 The Authors. Published by Elsevier Ltd.
Peer-review under responsibility of the organizing committee of CPESE 2017.
4th International Conference on Power and Energy Systems Engineering, CPESE 2017, 25-29
September 2017, Berlin, Germany
A Wide-Range Model for Surge Arresters: Verification Analysis
Sadra Mousavi*, Behnam Feizifar, Emel Onal
Department of Electrical Engineering, Istanbul Technical University, Istanbul, Turkey
Abstract
This paper verifies and analyzes the proposed wide range (WR) model for surge arresters. The verification analysis of various surge arrester models is performed; 1) on the model itself independent of power systems, and 2) by considering that surge arrester models are connected to a simple power transmission system. In order to accurately verify the performance of the WR model, some of the well-known surge arrester models are utilized. Simulation results reveal the advantages of the new model compared to traditional models already available in the literature.
© 2017 The Authors. Published by Elsevier Ltd.
Peer-review under responsibility of the organizing committee of CPESE 2017.
Keywords: EMTP-RV simulation; power transmission system; surge arrester; wide range model;
1.Introduction
Surge arrester is a protective equipment used for reducing over voltages caused by lightning and switching surges on equipment by diverting the content of surge current and restoring the equipment to its original condition. It is also able to repeat these tasks whenever required [1]. As is known, there are various types of surge arresters in the market based on various technologies and operating mechanisms. Among them, the metal-oxide surge arrester (MOSA) is so popular. It operates based on non-linear resistances built from metal oxide materials. Over the years, several models have been proposed to represent the electrical characteristics of surge arresters. These models generally include one or two non-linear resistors along with lumped elements such as resistances, inductances and capacitances. The oldest model which is based on two non-linear resistances has been proposed by the IEEE Working Group 3.4.11 [2].
* Corresponding author. Tel.: 90-5533247345 E-mail address: [email protected]
Sadra Mousavi et al. / Energy Procedia 00 (2017) 000–000
The IEEE surge arrester model is especially useful for surge currents with rising times between 0.5 µs and 45 µs. Another model has been proposed by Pinceti et al. which simplifies the parameters identification criteria of the IEEE recommended model [3]. A straightforward method has been proposed by Fernandez et al. in which the parameters of the IEEE model can be calculated from the manufacturer data related to surge arrester [4]. Recently, an electric model of MOSA has been proposed which covers a wide range of frequencies and amplitudes in various current regions. The simulation results have been validated through laboratory measurements [5]. A brief review of this wide range (WR) model along with its mathematical calculations will be presented in section 2. A comparison between various models will be presented and discussed in section 3. In section 4, the performance of each MOSA model will be analyzed within a test power transmission network in the electro-magnetic transient program-restructured version (EMTP-RV). Finally, the paper will be concluded in section 5.
2. Wide-range (WR) MOSA model
The WR model is newly proposed for a wide range of frequencies and amplitudes. In order to reach this goal, twelve ZnO varistors with different characteristics from five different manufacturers have been tested [5]. The topology of this model is shown in Fig. 1.
Fig. 1. Topology of the WR model.
In this model, calculations of the parameters are considerably easier than the other available models. The following equations are used to determine the values of these parameters,
h
L
n
(µH) (1)8 L L R t
(Ω) (2)
where, h is the overall height of MOSA in meters; n is the number of ZnO parallel columns; and Δt is the time step of simulation.
In the next step, according to tables which are demonstrated in [5], a proper value of the parameter C will be
chosen. Therefore, utilizing the below formula, the value of RC can be easily obtained.
0.15 2 C t R C
(Ω) (3)
3. Comparative analysis of different models
By applying different types of surges to the available surge arrester models and considering residual voltages which are given by the manufacturer, the accuracy of each model is evaluated and also the comparisons are provided. Table.1 represents residual voltages of the MEH443-390 arrester for a 420 kV transmission system which is manufactured by TE connectivity Ltd [6].
A1 L
RL RC
Sadra Mousavi et al. / Energy Procedia 141 (2017) 460–464 461
© 2017 The Authors. Published by Elsevier Ltd.
Peer-review under responsibility of the scientific committee of the 4th International Conference on Power and Energy Systems Engineering.
Sadra Mousavi et al. / Energy Procedia 00 (2017) 000–000
The IEEE surge arrester model is especially useful for surge currents with rising times between 0.5 µs and 45 µs. Another model has been proposed by Pinceti et al. which simplifies the parameters identification criteria of the IEEE recommended model [3]. A straightforward method has been proposed by Fernandez et al. in which the parameters of the IEEE model can be calculated from the manufacturer data related to surge arrester [4]. Recently, an electric model of MOSA has been proposed which covers a wide range of frequencies and amplitudes in various current regions. The simulation results have been validated through laboratory measurements [5]. A brief review of this wide range (WR) model along with its mathematical calculations will be presented in section 2. A comparison between various models will be presented and discussed in section 3. In section 4, the performance of each MOSA model will be analyzed within a test power transmission network in the electro-magnetic transient program-restructured version (EMTP-RV). Finally, the paper will be concluded in section 5.
2. Wide-range (WR) MOSA model
[image:2.544.202.349.269.357.2]The WR model is newly proposed for a wide range of frequencies and amplitudes. In order to reach this goal, twelve ZnO varistors with different characteristics from five different manufacturers have been tested [5]. The topology of this model is shown in Fig. 1.
Fig. 1. Topology of the WR model.
In this model, calculations of the parameters are considerably easier than the other available models. The following equations are used to determine the values of these parameters,
h
L
n
(µH) (1)8
L L
R t
(Ω) (2)
where, h is the overall height of MOSA in meters; n is the number of ZnO parallel columns; and Δt is the time step of simulation.
In the next step, according to tables which are demonstrated in [5], a proper value of the parameter C will be
chosen. Therefore, utilizing the below formula, the value of RC can be easily obtained.
0.15 2
C t
R
C
(Ω) (3)
3. Comparative analysis of different models
By applying different types of surges to the available surge arrester models and considering residual voltages which are given by the manufacturer, the accuracy of each model is evaluated and also the comparisons are provided. Table.1 represents residual voltages of the MEH443-390 arrester for a 420 kV transmission system which is manufactured by TE connectivity Ltd [6].
A1 L
RL RC
Table 1. Residual voltages corresponding to the MEH443-390 surge arrester.
Maximum system voltage Um
Rated voltage Ur
Max. Ures tested with current wave Steep lightning current impulse (1/20 µs) Switching current
impulse (30/60 µs)
Lightning current impulse (8/20 µs)
2000 A 10 kA 20 kA 10 kA
420 kV 390 kV 772 kV 858 kV 927 kV 892 kV
In the first and second case studies, two lightning strikes with the maximum values of 10 kA and 20 kA (8/20 µs) have been applied. Fig. 2 shows the voltage curves obtained from the simulation.
Fig. 2. Residual voltages of surge arrester models; for 10 kA - 8/20 µs lightning current (Left), for 20 kA - 8/20 µs lightning current (Right).
According to Table 1, the residual voltage of the MEH443-390 arrester for 10 kA lightning is equal to 858 kV. The performed simulation studies indicate that the residual voltages for the IEEE, Pinceti, Fernandez, and WR models are 857 kV, 880 kV, 874 kV, and 876 kV respectively. On the other hand, the residual voltage of the lightning surge with the peak value of 20 kA is equal to 927 kV. The simulation results have proved that the residual voltages for the IEEE, Pinceti, Fernandez, and WR models are 923 kV, 944 kV, 990 kV, and 959 kV respectively.
In the third and fourth case studies, a switching current impulse with 2000 A peak value (30/60 µs) and a steep lightning current impulse with 10 kA peak value (1/20 µs) have been injected. Fig. 3 illustrates the simulation results corresponding to these surges.
According to the datasheet, the residual voltage of the arrester for switching current impulse of 2000 A (30/60 µs) is equal to 772 kV. The simulation outcomes show that the relative residual voltages for the IEEE, Pinceti, Fernandez, and WR models are 779 kV, 786 kV, 733 kV, and 768 kV respectively. Furthermore, for the steep lightning current impulse of 10 kA peak value (1/20 µs), the amount of residual voltage is 892 kV. Based on the simulations results, the residual voltages for the IEEE, Pinceti, Fernandez, and WR models are equal to 899 kV, 880 kV, 874 kV, and 875 kV respectively.
Vo
ltag
e(kV)
Fig. 3. Residual voltages of surge arrester models; for 2000 A - 30/60 µs surge current (Left), for 10 kA- 1/20 µs lightning current (Right).
Vo
ltag
e(kV)
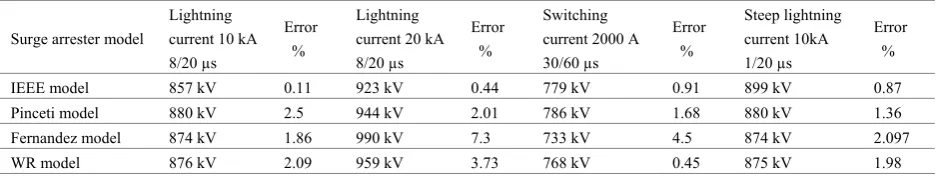
For these models, calculated values of residual voltages obtained from simulations and their errors are provided in Table 2. By considering certain types of surges, generally the IEEE model shows better performances. Meanwhile, the Pinceti and WR models are presenting nearly close trends in their residual voltage curves. However, the Fernandez model is not providing a good performance while applying various kinds of surges.
Table 2. Calculated residual voltages and errors for different models.
Surge arrester model
Lightning current 10 kA 8/20 µs
Error %
Lightning current 20 kA 8/20 µs
Error %
Switching current 2000 A 30/60 µs
Error %
Steep lightning current 10kA 1/20 µs
Error %
IEEE model 857 kV 0.11 923 kV 0.44 779 kV 0.91 899 kV 0.87
Pinceti model 880 kV 2.5 944 kV 2.01 786 kV 1.68 880 kV 1.36
Fernandez model 874 kV 1.86 990 kV 7.3 733 kV 4.5 874 kV 2.097
WR model 876 kV 2.09 959 kV 3.73 768 kV 0.45 875 kV 1.98
4.Performance of MOSA models within a test power transmission system
A 400 kV power transmission system with a lightning strike of 100 kA has been simulated as it is shown in Fig. 4.
Power Plant
Transmission Line
Surge Arrester Transformer
Substation
Surge Arrester
Fig. 4. Test power transmission system.
In this system, the transmission lines are represented using three-phase frequency dependent line models. The first set of surge arresters at the end of the lines and right before the substation protects the incoming feeders and the second group of surge arresters preserves the outgoing feeders as well as the power transformer. In high-frequency transient analysis, capacitive voltage transformers (CVTs) and power transformers are usually modeled as capacitors. Therefore, the CVT and power transformer are represented with the capacitances of 4 nF in this simulation [7].
The IEEE and WR models have been considered to model the surge arresters of the mentioned transmission system. Fig. 5 illustrates one phase of the surge arrester current utilizing both models. The waveforms of the other phases have the same shape with only 120 degrees difference in phase angle.
Fig. 5. Current waveforms of the surge arresters at the incoming side; considering the IEEE model (Left), considering the WR model (Right).
Cu
rre
nt
(A
)
Cu
rre
nt
(A
Sadra Mousavi et al. / Energy Procedia 141 (2017) 460–464 463 Sadra Mousavi et al. / Energy Procedia 00 (2017) 000–000
[image:4.544.33.504.144.233.2]For these models, calculated values of residual voltages obtained from simulations and their errors are provided in Table 2. By considering certain types of surges, generally the IEEE model shows better performances. Meanwhile, the Pinceti and WR models are presenting nearly close trends in their residual voltage curves. However, the Fernandez model is not providing a good performance while applying various kinds of surges.
Table 2. Calculated residual voltages and errors for different models.
Surge arrester model
Lightning current 10 kA 8/20 µs
Error %
Lightning current 20 kA 8/20 µs
Error %
Switching current 2000 A 30/60 µs
Error %
Steep lightning current 10kA 1/20 µs
Error %
IEEE model 857 kV 0.11 923 kV 0.44 779 kV 0.91 899 kV 0.87
Pinceti model 880 kV 2.5 944 kV 2.01 786 kV 1.68 880 kV 1.36
Fernandez model 874 kV 1.86 990 kV 7.3 733 kV 4.5 874 kV 2.097
WR model 876 kV 2.09 959 kV 3.73 768 kV 0.45 875 kV 1.98
4.Performance of MOSA models within a test power transmission system
A 400 kV power transmission system with a lightning strike of 100 kA has been simulated as it is shown in Fig. 4.
Power Plant
Transmission Line
Surge Arrester Transformer
Substation
[image:4.544.116.429.291.411.2]Surge Arrester
Fig. 4. Test power transmission system.
In this system, the transmission lines are represented using three-phase frequency dependent line models. The first set of surge arresters at the end of the lines and right before the substation protects the incoming feeders and the second group of surge arresters preserves the outgoing feeders as well as the power transformer. In high-frequency transient analysis, capacitive voltage transformers (CVTs) and power transformers are usually modeled as capacitors. Therefore, the CVT and power transformer are represented with the capacitances of 4 nF in this simulation [7].
[image:4.544.59.493.531.654.2]The IEEE and WR models have been considered to model the surge arresters of the mentioned transmission system. Fig. 5 illustrates one phase of the surge arrester current utilizing both models. The waveforms of the other phases have the same shape with only 120 degrees difference in phase angle.
Fig. 5. Current waveforms of the surge arresters at the incoming side; considering the IEEE model (Left), considering the WR model (Right).
Cu
rre
nt
(A
)
Cu
rre
nt
(A
The following waveforms are the simulation outputs of analysis in which the Pinceti and Fernandez models have been chosen for surge arrester modeling. Fig. 6 is displaying the obtained current signals of both arrester models at the incoming side of the substation.
Fig. 6. Current signals of the surge arresters at the incoming side; considering the Pinceti model (Left), considering the Fernandez model (Right).
The voltage waveforms related to four different models are the same in the simulation studies. However, the current signals are different based on the presented figures. But, as it is understandable from the curves, the current waveforms of the IEEE and WR models resemble each other much more than the other two models.
5.Conclusion
A verification analysis of different surge arrester models has been made. It is observed that the IEEE model is the most accurate representation for surge arresters because it provides lowest deviations compared to the values given in the manufacturer’s datasheet. The model proposed by Fernandez manifests different errors by applying certain kinds of surges with various frequencies and amplitudes. On the other hand, the Pinceti and WR models have nearly similar error variations in different scenarios. By considering various surge arrester models in a test transmission system, the simulation results show that the WR model behavior is very close to the IEEE model. As already mentioned, the IEEE model has the best performance, hence, the WR model can be a good alternative to model surge arresters compared to other representations. In addition, the WR model has a very simple topology and also calculation of its parameters is straightforward using manufacturer’s data.
References
[1] IEEE Standard for Metal-Oxide Surge Arresters for AC Power Circuits (>1 kV)," in IEEE Std 2012 (Revision of IEEE Std C62.11-2005), vol., no., pp.1-121, Dec. 2012.
[2] IEEE Working Group 3.4.11, "Modeling of metal oxide surge arresters," in IEEE Transactions on Power Delivery, vol. 7, no. 1, pp. 302-309, Jan. 1992.
[3] P. Pinceti and M. Giannettoni, "A simplified model for zinc oxide surge arresters," in IEEE Transactions on Power Delivery, vol. 14, no. 2, pp. 393-398, Apr. 1999.
[4] F. Fernadez, R. Diaz, “Metal oxide surge arrester model for fast transient simulations”, The International Conference on Power System Transients IPST’01, Rio De Janeiro, Brazil, , Paper 14, pp. 20-24, Jun. 2001.
[5] V. S. Brito; G. R. S. Lira; E. G. Costa; M. J. A. Maia, "A Wide-Range Model for Metal-Oxide Surge Arrester," in IEEE Transactions on Power Delivery , vol.PP, no.99, pp.1-1, May 2017.
[6] MEH Surge Arrester IEC, Available: http://www.te.com/content/dam/te-com/documents/energy/global/productdocuments/Substation/energy-substation-hvsa-meh-iec.pdf