Analyst
PAPER
Received 00th January 20xx, Accepted 00th January 20xx DOI: 10.1039/x0xx00000x www.rsc.org/
Silver Colloids as Plasmonic Substrates for Direct Label-free
Surface-enhanced Raman Scattering Analysis of DNA
A. Torres-Nuñez,a,b K. Faulds,c D. Graham,c R.A. Alvarez-Puebla* a,b,d and L. Guerrini.* a,c
Ultrasensitive direct SERS analysis offers a powerful analytical tool for the structural characterization and classification of nucleic acids. However, acquisition of reliable spectral fingerprints of such complex biomolecules poses important challenges. In recent years, many efforts have been devoted to overcome these limitations, mainly implementing silver colloids as plasmonic substrates. However, a reliable cross-comparison of results reported in the recent literature is extremely hard to achieve, mostly due to the broad set of different surface properties of the plasmonic nanoparticles. Herein, we perform a thorough investigation of the role played by the metal/liquid interface composition of silver colloids in the direct label-free SERS analysis of DNA. Target molecules of increasing complexity, from short homopolymeric strands to long genomic duplexes, were used as probes. We demonstrate how apparently subtle changes in the colloidal surface chemistry can dramatically modify the affinity and the final SERS spectral profile of DNA. This has significant implications for the future design of new analytical strategies for the detection of DNA using SERS without labels.
Introduction
Surface-enhanced Raman scattering (SERS) optical detection of nucleic acids has attracted a growing interest over the past few years thanks to the ultrasensitive analytical capability and molecular specificity of this technique.1-7 As for other large biomolecules, the vast majority of SERS applications to DNA detection relies on the indirect sensing approach in which a Raman label is used for the SERS readout and, normally, thiolated-oligonucleotides bound to the plasmonic surface provide the selective biorecognition element to the complementary target sequences.1-7 SERS detection of nucleic acids via indirect schemes has consistently proven high-throughput screening and multiplexing abilities, including for the rapid and reliable DNA detection in complex media.1-7 However, extrinsic strategies do not allow acquisition of the rich structural and chemical information contained in the specific SERS spectral fingerprint of the target analyte. Nowadays, direct
SERS detection of large and complex biomolecules such as DNA still poses significant difficulties and challenges, due to the several interdependent multiple factors that determine the degree of affinity of the molecule for the plasmonic substrate as well as the final property of the resulting surface complex. For this reason, direct acquisition of the SERS spectra of nucleic acids has historically suffered from limited reproducibility and/or sensitivity.
In recent years, many efforts have been devoted to overcome these limitations by simultaneously tackling different challenges, such as the development of novel SERS substrates with high and uniformly distributed enhancements, implementation of multivariate statistical approaches in the spectral analysis and the tuning of the DNA affinity towards Au and Ag surfaces.8-27 Among them, improvement of the spectral reproducibility can be efficiently achieved without impoverishing the overall sensitivity by properly modulating the metal/liquid interface properties. In fact, the metal surface chemistry largely defines the binding affinity of the target for the plasmonic substrate as well as the final structural features of the adsorbed molecule.28 In this regard, Bell and co-workers showed that both citrate- and hydroxylamine-reduced silver colloids (AgCit and AgHX, respectively) offer effective SERS platforms for the label-free detection of mono- and oligonucleotides when aggregated with magnesium sulfate (MgSO4).15-17 Notably, AgHX colloids have the important
advantage over AgCit to yield a background signal with only a strong feature at low wavenumbers, ascribed to the ν(Ag-Cl) vibration, whereas citrate molecules generate a set of intense bands that largely overlap the DNA spectra.15 Under a.Medcom Advance, Viladecans Business Park, Edificio Brasil, Bertran i Musitu
83-85, 08840 Viladecans, Barcelona, Spain.
b.Centro Tecnológico de la Química de Catalunya, Carrer de Marcel•lí Domingo s/n, 43007 Tarragona, Spain.
c.Department of Pure and Applied Chemistry, Technology and Innovation Centre, University of Strathclyde, 99 George Street, Glasgow G1 1RD, UK.
d.ICREA, Passeig Lluís Companys 23, 08010 Barcelona, Spain.
appropriate experimental conditions, SERS fingerprints of 23-mer single stranded sequences on AgHX nanoparticles were acquired with sufficient reproducibility to allow for single-base mismatch identification.17 The authors suggest that MgSO4 acts as a “passive” aggregating agent (i.e., MgSO4 simply induces
nanoparticle clustering by increasing the ionic concentration) while it is the DNA molecule that directly binds the silver surface, displacing the residual chloride ions.15 On the contrary, Xu et al.18 confer to Mg2+ an active role in promoting the
adsorption of DNA onto negatively-charged colloids, via its coordination with the phosphate backbone21 which mediates the electrostatic interaction with iodide anions bound to the metal surface. In their study, a post-modification of AgCit colloids with iodide ions (AgCit@I) was firstly carried out to displace residual citrate molecules and impurities from the metallic surface, prior to the sequential addition of DNA and MgSO4 solutions. Single-base sensitivity in SERS detection of
short single and double-stranded DNAs as well as relative nucleobase content quantification in adenine/cytosine bipolymers were reported.18
However, salt-induced aggregation still affords poor or null control over both the overall nanoparticle assembly and the final position of the DNA within the aggregate. Thus, signal reproducibility still remains a day-to-day challenge for the label-free study of unmodified oligonucleotides.15El-Sayed and co-workers19, 20 overcame the issues associated with the use of the aggregating agent by highly concentrating citrate-capped silver colloids in a small volume. In this way, biomolecules remain physical entrapped at the junctions of interacting nanoparticles, yielding highly reproducible SERS spectra of genomic DNA. However, such approach was shown to be effective only for relatively high DNA concentrations (1 mg/mL).
Alternatively, the need of an aggregating agent can be removed via chemical modifications of the metal-liquid interface with surface-bound positively-charged polymers, such as poly-L-Lysine and polyethyleneimine.29, 30 In this case, DNA molecules directly interact with the positively-charged nanoparticles via electrostatic interactions of the negatively-charged phosphate backbone, inducing rapid colloidal clustering without the need of an external aggregating agent. However, the relevant thickness of the polymeric layer significantly decrease the SERS sensitivity26 and high background signals compromise the distinction of the analyte spectroscopic features from the polymer ones. Recently, our group developed the synthesis of spermine-coated positively charged silver colloids (AgSp) and demonstrated their remarkable performances as plasmonic substrates in multiple applications of direct SERS analysis of nucleic acids.22-27 Spermine (Sp) is a quadruvalent cation that naturally interacts with DNA mainly via electrostatic binding with the negatively charged phosphate backbone.31, 32 For this reason, spermine tetrahydrochloride (SpCl4) was also efficiently employed as DNA
backbone neutralizer and aggregating agent for the indirect33 and direct34 SERS detection of DNA in combination with AgCit and AgHX colloids.
Despite the renewed interest that direct label-free SERS analysis of nucleic acids has enjoyed in very recent years,22-24, 27,
35 a reliable cross-comparison of results described in the
literature remains extremely difficult if not impossible. This can be ascribed to the specific experimental conditions in which the SERS analysis were performed, with particular reference to the broad set of different nanoparticle surface properties and aggregating agents. Herein, we aim to systematically investigate the role played by the metal/liquid interface composition of several widely used silver colloids in their application as plasmonic substrates for the direct label-free SERS analysis of DNA. Spermine-coated silver nanoparticles (AgSp) were chosen as model for positively-charged colloids.23, 24, 26, 27 For negatively-charged colloids, we selected citrate- and hydroxylamine reduced silver colloids (AgCit and AgHX, respectively).15, 17, 35 Additionally, AgCit nanoparticles were subsequently modified with halide anions (Cl-, Br- and I-),
accordingly to what described in the literature,18 to yield the corresponding AgCit@Cl, AgCit@Br and AgCit@I colloids. Halide modification of the AgCit nanoparticle surfaces has proven to play a major role in determining the affinity and the final spectral contour of SERS spectra of proteins.36 Similarly, we sought to explore such effect on the SERS analysis of DNA.
The results of our investigation illustrate how apparently minor experimental changes can dramatically modify the affinity and the final SERS spectral profile of single- and double-stranded DNAs on silver nanoparticles.
Experimental
Materials
All materials were of highest purity available and obtained from Sigma Aldrich. DNA sequences were purchased from Eurofins Genomics (Germany).
Synthesis of Silver Colloids
Synthesis of citrate-reduced silver colloids (AgCit) and halide modification. Solutions of ascorbic acid (250 µL, 0.1 M) and
sodium citrate (3409 µL, 0.1 M) were added to 250 mL of boiling MilliQ water under stirring. One minute later, a mixture of AgNO3 and MgSO4 prepared by mixing 744 µL of a AgNO3 0.1 M
solution and 559 µL of a MgSO4 0.1 M solution was added. The
final mixture was boiled for a further 60 minutes under stirring and then allowed to cool to room temperature. To remove the excess of citrate molecules, AgCit colloids were submitted to one centrifugation (4800 rpm for 10 min). The supernatant was eliminated and the nanoparticles were resuspended with MilliQ water to the original volume. Halide-modification of AgCit colloids was performed as follows: 190 µL of AgCit were incubated overnight with 10 µL of KCl, KBr or KI solutions (12 mM).
Synthesis of hydroxylamine-reduced silver colloids (AgHX). 250
µL of a NaCl 1.0 M solution were added to 13.43 mL of a hydroxylamine hydrochloride 3.35 mM solution. The mixture was stirred for few minutes then 1.49 mL of a AgNO3 10.13 mM
solution were added to the mixture under vigorous stirring.
Synthesis of spermine-coated silver colloids (AgSp). 20 μL of a
AgNO3 0.5 M solution were added to 10 mL of Milli-Q water,
0.1 M solution. After 20 min of stirring, 250 μL of NaBH4 (0.01
M) were quickly added to the mixture. To prevent the adhesion of AgSp nanoparticles to glass surfaces, vials used for particle preparation and storage were coated with polyethyleneimine (PEI) as described elsewhere.26
Sample preparation
Samples for SERS measurements were prepared as follows. 200 μL of colloids were mixed with (a) 10 µL of 20 μM homopolymer solutions in MilliQ; (b) 10 µL of a 20 μM ssDNA solution in PBS (0.3% v/v); (c) 10 µL of a 20 μM dsDNA solution in PBS (0.3% v/v), (d) 12.8 µL of a 117.2 µg/mL ctDNA solution in PBS (0.3% v/v). In the case of negatively-charged colloids, aggregation of the colloidal/DNA mixture was achieved by addition of 20 µL of either MgSO4 or SpCl4 0.1 M solutions.
Instrumentation
SERS experiments were conducted using a Renishaw InVia Reflex confocal microscope. A 532 nm laser was focused on the colloidal suspension by using a long-working distance objective (0.17 NA, working distance 30 mm). All spectra were collected with 10 s exposure time, 20 accumulations and 50% laser power (ca. 34.5 mW at the sample) except for the SERS analysis of DNAs on AgSp which was performed at 10% laser power (ca. 6.9 mW at the sample). All SERS spectra were obtained by averaging 3 different replications per each sample.
UV-vis spectra were recorded using a Thermo Scientific Evolution 201 UV-visible spectrophotometer. TEM was performed with a JEOL JEM-1011 trans- mission electron microscope. The ζ (Zeta) potential measurements were carried out using a Malvern Nano Zetasizer.
Results and discussion
The syntheses of silver colloids AgSp,23 AgCit,18 and AgHX17 were performed as described in the literature (see the Experimental section for details and Fig. S1 for nanoparticles characterization). AgSp colloids (ζ-potential +43 ± 1.1 mV, pH 6.1) are characterized by a low background signal (Fig. S2A), due to the aliphatic nature of the spermine molecules (i.e.; low Raman cross-section) with the exception of the intense band centered at ca. 243 cm-1, ascribed to the ν(Ag-Cl) mode (Fig. 1A).
As for AgSp, the SERS background of AgHX nanoparticles (ζ-potential -38.5 ± 0.9mV, pH 7.3) is dominated by the ν(Ag-Cl) band with minor interference from byproducts of the reaction.37, 38 The chloride anions adsorbed onto AgSp and AgHX derive from the spermine tetrahydrochloride (SpCl4) ligand and
hydroxylamine hydrochloride (NH2OH·HCl) reducing agent,
respectively, employed in the syntheses. Differently, AgCit colloids display the characteristic intense features associated with residual citrate anions (Fig. S2A).39 Such bands disappear when the colloids are incubated with potassium halide (KCl, KBr and KI) solutions18 to yield the corresponding AgCit@Cl, AgCit@Br and AgCit@I colloids. SERS spectra of these colloids display the characteristic ν(metal-halide) bands at low wavenumbers, respectively centered at ca. 243, 162 and 118 cm-1 (Fig. 1A).40, 41 The ζ-potential of the AgCit colloids (-40.7 ± 1.1 mV; pH 6.5) shows a progressive decrease upon incubation
with halide ions of increasing size (-41.1 ± 1.4 mV for AgCit@Cl, -44.6 ± 1.8 mV for AgCit@Br; and -47.0 ± 4.0 mV for AgCit@I). It is worth noticing that halide surface modification does not produce any appreciable nanoparticle aggregation (Fig. S3). Moreover, it is known that the binding affinity for metal surfaces increases in the order Cl- <Br- < I-.41, 42 In fact, when MgSO4 is replaced as the aggregating agent with SpCl4 (Fig. S2B),
the SERS background spectra reveal that chloride anions do not displace bromide and iodide anions from the metal surface while, on the contrary, residual citrate molecules were fully removed (Fig. S2B).
Positively-charged nanoparticles rapidly aggregate upon addition of DNA, as clearly revealed by the colloidal extinction profile shown in Fig. 1B. On the contrary, the colloidal stability of negatively-charged nanoparticles is not perturbed by the addition of nucleic acids and, thus, an aggregating agent is required to promote the necessary hot spots formation (Fig. 1C) to yield detectable SERS signal from the target DNA.
The Effect of Nucleobase Composition
It has been reported that DNA strands preferably adsorb on negatively-charged gold and silver nanoparticles by direct interaction of purine (adenine, A; and guanine, G) and pyrimidine (cytosine, C; and thymine, T) bases with the metal surface, mainly via their exocyclic amine moiety or deprotonated heterocyclic nitrogen.43 This explains why SERS spectra are usually dominated by those vibrational modes associated with the aromatic base unities, which also possess much higher polarizability than the sugar and phosphate residues. Furthermore, adenosine has been consistently reported as the nucleoside with the highest affinity for binding silver and gold, mainly via the N7 nitrogen atom.43, 44 Also, adenine-related bands are usually the most intense ones, since the Raman cross section decreases in the following order: A»G>C~T.9
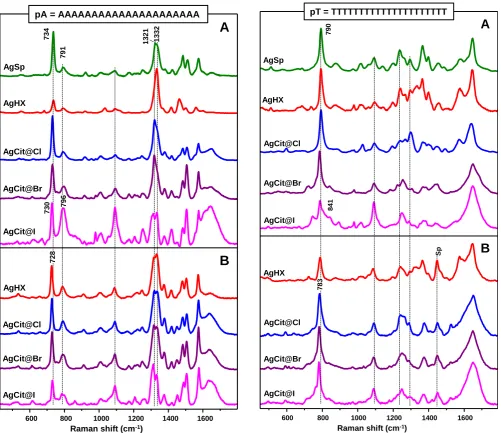
21-mer homopolymeric sequences of the four bases (pA, pC, pT and pG) were selected as molecular probes to initially screen the nucleobase-dependent adsorption of oligonucleotides onto silver colloids with different surface chemistry. It is worth noticing that guanine-rich oligomers form multiple-stranded secondary structures driven by four Hoogsteen-paired coplanar guanine bases.45 These secondary structures can adopt a multitude of different interconverting conformations introducing a high degree of complexity in their Raman characterization.46, 47 Additionally, the assembly of single-stranded pG into multiple-single-stranded helices largely hinders the direct adsorption of the guanine bases onto the silver surface, thus resulting in weak SERS signals.17 For this reasons, pG was submitted to a moderate thermal treatment prior to the SERS analysis,23 in order to break the secondary structures into extended single strands and, therefore, favoring the interaction with the metal surface. Figure 2A, 3A, 4A and 5A illustrate the SERS spectra of pA, pT, pC and pG, respectively, on AgSp and on negatively-charged colloids aggregated with MgSO4 after DNA
AgSp nanoparticles allows us to obtain intense SERS spectra with well-defined features for all homopolymers.22, 23 Simulations of the interaction between short DNAs and the spermine-coated silver surface performed by molecular dynamics (MD) methods24 show that DNAs rapidly interacts via its phosphate groups with the spermine molecules on AgSp nanoparticles, adopting an extended conformation over the metal surface independently of their nucleobase composition. On the other hand, AgHX nanoparticles give rise to intense SERS spectra of pA and pC, while pT generates a markedly weaker signal that required longer accumulations to yield well-defined spectral features. Similarly, SERS spectra of pG on AgHX show weak intensities and, additionally, poorly-defined broad features.
In the case of halide-modified AgCit colloids, we managed to acquire intense spectra only for pA and pT, while pC and pG yielded weak or null spectral signals. For unmodified AgCit colloids, the SERS spectra of the homopolymers were largely dominated by residual citrate features (data are not shown). Thus, we focused our attention to halide-modified AgCit colloids.
Consistently with the literature, analysis of pG sequences on negatively-charged colloids barely yielded detectable signals whereas the intense and characteristic SERS profile of pA was observed for all investigated substrates. The SERS spectra of pA are all dominated by the ν(C-N) mode of the imidazole ring at ca. 1332 cm-1 and the ca. 734 cm-1 feature assigned to the ring
breathing coupled to a NH2 deformation,43 but significant
changes in relative intensities can be easily spotted in Figure 2A for different colloids. For halide-modified AgCit colloids, we also want to remark the relative intensity decrease of the A bands with respect to the symmetric stretching vibration of the PO2
-moiety at ca. 1089 cm-1 and the skeleton stretching vibration of
the sugar-phosphate backbone at ca. 792 cm-1,48 in the following order of surface modification: Cl- < Br- << I-.
Simultaneously, the A ring breathing mode shifts from 731 to 728 cm-1. Similar conclusions can be drawn for pT (Fig. 3A). In
this case, the T ring breathing mode occurs at ca. 787 cm-1 and
largely overlaps with the skeleton stretching vibration of the sugar-phosphate moieties. Nonetheless, the relative intensity increase of the backbone features, which also includes here the emerging of the moderate intensity band near 841 cm-1,48 still appears evident, especially for AgCit@I nanoparticles. Finally, the characteristic cytosine features at ca. 792 cm-1, ascribed to
the ring breathing motion, and at ca. 1245 cm-1, due to the ring
stretching vibration, can be observed in the SERS spectra of pC on AgSp, AgHX and AgCit@Cl with null or minor differences in spectral profile.17, 23
It is interesting to note that AgHX and AgCit@Cl, which should in principle share the same surface chemistry (i.e.; chloride-coated silver nanoparticles), present often different SERS responses when exposed to homopolymers, both in terms of spectral profiles and relative affinities. For instance, the SERS spectral profile of pA (Fig. 2A) on these two colloids shows drastic changes, especially in relative intensities. In the literature it is reported that adenosine binds the metal surface mainly via the N7 nitrogen atom, but contributions from N1 and
the external amino group are also possible.43, 44 This
multidentate interaction is highly sensitive to the surface properties of the metal substrate as well as the nucleoside surface coverage (i.e.; the lateral packing affects the final adenosine orientation onto the surface).44, 49 Interestingly, when the SERS spectrum of pA is acquired on AgHX aggregated with MgSO4 at acidic pH (3.5), the spectral profile matches those
observed for the other colloids (Fig. S5).
The Effect of the Aggregating Agent
In the previous section, we observed that both absolute SERS intensity and the final spectral shape of the homopolymers on MgSO4-aggregated colloids are highly dependent on the
colloidal surface chemistry as well as the individual nucleobase composition. However, when MgSO4 is replaced with SpCl4 as
the aggregating agent, we obtain a completely different outcome (Fig. 2B, 3B, 4B and 5B).
First of all, SpCl4 acts as a “normalizer” of the binding affinity
levels. In fact, we observe a drastic improvement of the adhesion of pC on halide-modified AgCit colloids and, to a lesser extent, of pT on AgHX (Fig. 4B and 3B, respectively). In this regard, to gain a better understanding of the halide effect on the binding affinity of each homopolymer, the absolute SERS intensities of the ring breathing modes at ca. 732 cm-1 (A), 793
cm-1 (C), 785 cm-1 (T), and 652 cm-1 (G) are plotted in Figure 6
for halide-modified AgCit colloids aggregated with MgSO4 or
SpCl4. In the first case, the results show a linear decreasing in
SERS intensities of the nucleotide bands, in the following order of surface modification: Cl- > Br- > I- (Fig. 6A). Interestingly, such
intensity decrease is accompanied by a relative increase of sugar-phosphate backbone bands, as shown in Figure 6C, where the ratios between the intensities of the nucleobase ring breathing modes and the phosphate stretching at ca. 1089 cm-1
(Iring/IPO) are plotted for each homopolymer. On the contrary,
SpCl4 addition leads to a general normalization of the absolute
intensities with minor changes in the Iring/IPO ratios, as shown in
Figure 6B and 6D (even though iodide-coated nanoparticles still
retain the lower SERS efficiency). It is worth reminding that the inherent inhomogeneity of ensembles of randomly aggregated nanoparticles in suspension may result in large fluctuations of absolute SERS intensities. However, this variability can be minimized by acquiring averaged SERS measurements with fully aggregated colloids,50, 51 as performed in this study.
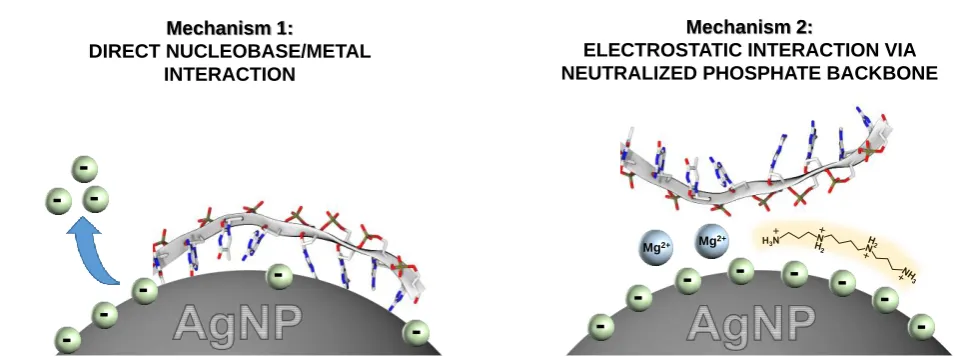
Overall, these results can be explained by approximating the homopolymer adsorption on silver nanoparticles as the combination of two main mechanisms, as depicted in Figure 7. In the first one, DNA directly interacts with the metal surface competing for surface sites with the presorbed anions (i.e.; nucleobase specific interaction, mechanism 1 in Fig. 7). In contrast, the second mechanism relies on the electrostatic interaction between the negatively-charged phosphate groups and metal surfaces mediated by positively-charged ions, such as Mg2+, or molecules as spermine (i.e.; nucleobase non-specific
direct coordination of the DNA phosphate backbone of onto positively-charged nanoparticles (such as for AgSp). These different interactions result in different surface complexes which both contribute to the final SERS spectra. The relative extent of each contribution depends on several factors such as the relative binding affinities of nucleobase and presorbed anions for the silver surface, and the ability of the positively-charged additives at neutralizing DNA charges. In this regard, spermine is much more efficient than a divalent ion such as Mg2+ at condensing at the DNA surface and neutralizing the
phosphate backbone charges.52 Thus, when SpCl4 is used as the aggregating agent, the mechanism 2 becomes the prevalent one, yielding SERS spectra that are largely independent of the residual halides anions at the metal surface both in terms of overall binding affinity (i.e.; absolute SERS intensity) and electronic perturbations of adsorbed homopolymers (i.e.; identical spectral profiles). On the other hand, for MgSO4
-mediated aggregation the direct nucleobase/metal interaction is preferred over the electrostatic one to an extent that is inversely proportional to the strength of the halide/metal binding. As the halide/metal bond becomes stronger (Cl- < Br- <
I-), the effective displacement from the silver surface by the
nucleobases is reduced, as revealed by the drop of the absolute SERS intensity of nucleobase ring breathing modes (Fig. 6A). Furthermore, a DNA adsorption based on the direct contact between the nucleobase and silver would locate the sugar-phosphate backbone further form the metal surface (i.e.; nucleobase groups experience much larger electromagnetic enhancements), oppositely to what it could expect from the
mechanism 2. This would accounts for the rapid decreasing of
the Iring/IPO ratios when AgCit nanoparticles are functionalized
with halide anions with progressively larger binding affinity (Cl
-< Br- < I-).
If the analysis of the absolute SERS intensities provides a qualitative idea of the different binding affinities for each colloids, the spectral profile informs about the electronic structure of the adsorbed DNA. As just discussed, the spectral fingerprints of each homopolymer is very similar or identical for every negatively-charged colloids upon aggregation with SpCl4
(i.e.; normalization of the SERS spectral profiles). This evidence further supports a DNA adsorption via a mechanism 2 type of process. However, it is also interesting to investigate how the replacement of MgSO4 with SpCl4 changed the SERS of a specific
homopolymer on a given colloids. For instance, pC SERS spectra (Fig. 4) show a marked shift of the ring breathing motion from 793 to 784 cm-1, while the broad carbonyl stretching
contributions centered at 1630 cm-1 upshifts of ca. 25 cm-1 in
the presence of SpCl4. A dramatic reshaping is also observed in
the 1200-1300 cm-1 spectral region. All these changes are
consistent with the protonation of the cytosine at N3 position (Fig. S4).53 Since the pKa of cytosine is 4.454, 55 and the addition
of SpCl4 does not produce detectable change in the colloidal pH
(which remains neutral), we ascribed such spectral changes to the complexation of spermine molecules to the homopolymer. In the case of pG, we observe the remarkable change in relative intensity that guanine ring breathing modes coupled to the deoxyribose at ca. 621, 660 and 682 cm-1 (Fig. 5). The first two
features are informative of a Z conformation while the latter one is a spectral marker for DNA B-form.56 Additionally, the evident reshaping of both the broad multiplet at ca. 1335-1350 cm-1 attributed to ν(C-N) vibrations43 and the carbonyl contributions at higher wavenumber, with the disappearance of the in-plane stretching of the CCO fragment at ca. 1690 cm-1,57 are detected in the spectra. Similar observations can be also drowned by the SERS of pA and pT (Fig. 2 and Fig. 3, respectively). Although to a lesser extent than pC and pG, the SERS spectra of these strands suffer distinct changes in relative intensities (see highly pH sensitive ring modes44 in the ca. 1250-1350 cm-1 region) and peak position (see the 6-7 cm-1 blue-shifts
of the ring breathing modes). These results are consistent with the formation of homopolymer/spermine complexes which strongly perturbs the electronic structure of the nucleosides as well as the tertiary structure of the strands adsorbed onto the metallic surface. Such interaction involves, in addition to the electrostatic coordination with the phosphate backbone, the direct binding with the nucleobases.31, 58, 59 It is also worth mentioning that the new doublet at 1450/1472 cm-1 which is
easily recognizable in the SERS spectra of pT, pC and pG for SpCl4
aggregated systems is ascribed to the CH2 scissoring vibrations
of spermine.32
Finally, it is worth stressing the striking difference between the SERS spectral profiles of the homopolymers obtained on negatively-charged colloids upon aggregation with SpCl4 and
those acquired on AgSp. The latter mainly resembles those observed for AgHX and AgCit@Cl colloids with MgSO4 as
aggregating agent. Thus, the structural properties of the complexes formed by DNA with either spermine molecules restrained at the metal surface or free spermine molecules in the bulk solution, are rather different. Based on the acquired spectra, we may suggest that the constraining imposed on the spermine molecules by the binding to the silver nanoparticles largely limit their interaction with homopolymers to the electrostatic coordination with the phosphate backbone. Regardless of the reason, it is of great importance that spermine ligands bound at AgSp surfaces minimally perturb the nucleobase structures. In fact, the interaction of the polyamines with the nucleobases is concentration-, base composition- and sequence-dependent,60, 61 and can result in important conformational changes in the DNA.34, 59, 62 Such potential alteration of the original DNA structure can obviously represent a major issue in the reliable label-free SERS investigations of DNA.
Single stranded and double stranded DNAs
Once completed the extensive SERS characterization of the four homopolymers, we finally moved to the analysis of complex DNAs, consisting of short single- and double-stranded structures (ssDNA and dsDNA, respectively) as well as a long genomic DNA, such as the double-stranded DNA isolated from the thymus of calves (ctDNA). Figure 8 details the SERS spectra of ssDNA and dsDNA on each investigated colloids in the most informative spectral regions (450-920 cm-1 and 1210-1750 cm -1), obtained by aggregating the negatively-charged colloids with
comparison, the spectra were all normalized to the intensity of the PO2- stretching at ca. 1089 cm-1 (Fig. S6).
The first observation is the bold resemblance of the ssDNA and dsDNA SERS spectra on each negatively charged colloids. In contrast, the spectral profile of the duplex on AgSp does show prominent differences from the ssDNA, which are consistent with the hybridization of the single stranded units into the double helix, as previously reported.23 Among others, we emphasize the prominent peak-shifting of the ring breathing modes, informative of the base stacking, and the v(C=O) band at ca. 1650 cm-1, indicative of the Watson–Crick hydrogen
bonding formation.63 It also remarkable the spectral reshaping in the 1200-1600 cm-1 spectral region, where are localized
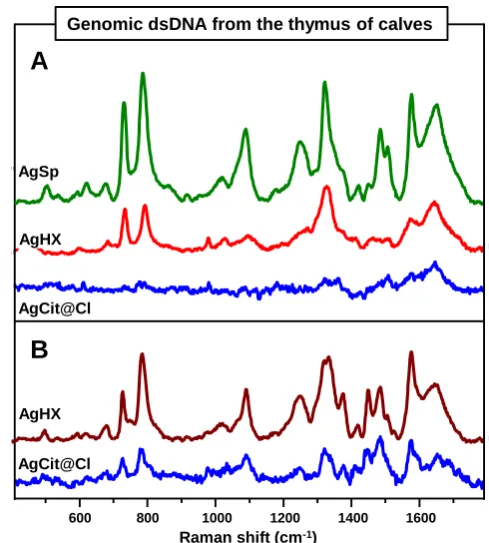
several overlapping features mainly ascribed to in-plane vibrations of nucleobases.48 AgSp colloids are also very efficient plasmonic substrates for acquiring the SERS fingerprint of genomic double-stranded ctDNA (Fig. 9A). Once more, negatively-charged colloids aggregated with MgSO4 only display
very weak signals with the characteristic spectral profile of single-stranded DNAs (Fig. 9A). As for the homopolymers, we then replaced MgSO4 with SpCl4 as the aggregating agent and
SERS spectra of DNA were obtained (Fig. 9B; AgCit@Br and AgCit@I did not yield detectable signals and the corresponding spectra are not shown). Once more, these results can be interpreted according to the mechanisms depicted in Figure 7. However, in the case of the duplexes we have to consider that when two complementary strands self-assemble into the double-helix, the accessibility of the silver surface to the individual nucleobase to form the direct nucleobase/metal interaction is significantly hampered. Thus, duplex adsorption will always prefer to take place via the electrostatic binding of the phosphate backbone in the presence of an efficient charge neutralizer, such as spermine (either previously bound to the metal surface as for AgSp, or post-added in the bulk solution).
As previously illustrated for the homopolymeric strands, also the SERS spectral profile of ssDNA is highly affected by different halide modifications of AgCit nanoparticles. In fact, the direct comparison of the ssDNA SERS spectra across different colloids (Fig. 8) shows minor changes for AgSp, AgHX and AgCit@Cl whereas, as for homopolymers, the ssDNA spectral profile undergoes prominent alterations when chloride anions are substituted with bromide and, much more, with iodide on AgCit. In the 600-900 cm-1 region, large blue-shifts of both
adenine and cytosine (thymine) ring breathing modes at ca. 734 and 792 cm-1 take place, while the guanine ring breathing mode
coupled to the deoxyribose at ca. 683 cm-1 (spectral marker for
DNA B-form) progressively decreases in intensity in favor of the new guanine feature at ca. 660 cm-1 (spectral marker for DNA
Z-form). Consistently to what revealed by the SERS analysis of the homopolymers, we also observe here the relative intensity increase of several bands associated to the deoxyribose-linked phosphodiester network the detriment of bands due to the ring vibrations of the nucleobases. Once more, this is particularly evident in the case of AgCit@I, where symmetrical stretching vibrations of the phosphodiester moiety at 747, 808 and 841 cm-148, 64 clearly emerge in the SERS spectra while, for instance, the adenine ring breathing mode at ca. 730 cm-1 becomes very
weak. The 747, 808 and 841 cm-1 features are spectral markers
of the sugar-phosphate backbone48, 64 and their occurrence
indicate the structural complexity of ssDNA on AgCit@I, with the coexistence of very different forms (mainly A- and Z-form).56 In contrast, ssDNA on AgSp, AgHX and AgCit@Cl appears to largely adopt a B-type conformation.23, 48, 64 The spectral region at higher wavenumbers also reveals important changes, in particular those associated with the broad and poorly defined band approximately centered at 1321 cm-1 that appears in the
SERS spectra of ssDNA on AgSp. This band is the result of multiple contributions, mainly from in-plane ring stretching modes of the base residues approximately centered at 1246 cm -1 (C), 1264 cm-1 (mainly G), 1321 cm-1 (A+G, mainly A), 1360 cm
-1 (G) and 1376 cm-1 (A+T).47, 55, 65 As for the ring breathing
modes, these nucleobase ring vibrations undergo a drop in relative intensity as compared to phosphodiester bands, together with a remarkable spectral reshaping, which is again qualitatively consistent to what previously observed for homopolymeric sequences (Fig. 2A and 3A).
Conclusions
In this study, we have selected three different silver colloids that have been widely reported in the literature as efficient plasmonic substrates for direct label-free SERS analysis of nucleic acids: positively-charged spermine coated nanoparticles (AgSp) and negatively-charged hydroxylamine-reduced and citrate-reduced silver colloids (AgHX and AgCit, respectively). AgCit nanoparticles were also post-modified with halide anions (Cl-, Br-, I-). DNA probes of increasing complexity, from
homopolymeric strands to genomic DNA duplexes, were used as molecular probes to investigate the effect of the different colloidal surface chemistries on the final SERS spectra of nucleic acids. Additionally, for negatively-charged colloids, we have also examined the role played by the aggregating agent. In this regard, based on what reported in the literature, we employed magnesium sulfate (MgSO4) or spermine tetrahydrochloride
(SpCl4). Our investigation shows how apparently minor changes
in the sensing design can drastically modify both the affinity and the final SERS spectral profile of single- and double-stranded DNAs on silver nanoparticles. Specifically:
(i) SERS of homopolymers and ssDNA on negatively-charged colloids aggregated with MgSO4 are highly dependent on
nucleobase composition and nanoparticle surface chemistry. (ii) When MgSO4 is replaced by SpCl4, such dependencies are
almost cancelled. However, the final SERS spectra reveal the formation of DNA strand/spermine complexes that significantly perturb the structural features of nucleoside residues and the strand conformation.
(iii) Single-stranded DNAs and duplexes cannot be differentiated by SERS when using negatively-charged colloids aggregated with MgSO4.
removal of the external aggregating agent from the system highly simplifies the sensing scheme, reducing drastically the number of variables required to be carefully controlled.
Based on these observations, we proposed two mechanisms of DNA adsorption onto the silver surfaces: the first one is based on the direct nucleobase/metal interaction which requires the displacement of residual ions or molecules from the nanoparticle surface, while the second one relies on the non-specific electrostatic interaction between the phosphate backbone and the metal, mediated by positively-charged additives. The two mechanisms can simultaneously coexist and their relative contribution to the final SERS spectra are strongly dependent on several factors, such as the properties of the metal/liquid interface, the nucleobase composition, the type of aggregating agent (Mg2+ vs. spermine), the DNA secondary
structure (single stranded vs. duplex), the length of the DNA etc.
Acknowledgements
The work was funded by European Research Council (PrioSERS FP7/2014 623527), Ministerio de Economia y Competitividad (CTQ2014-59808R), Generalitat de Catalunya (2014-SGR-480), and Medcom Advance SA.
Notes and references
1. H. I. Peng and B. L. Miller, Analyst, 2011, 136, 436-447. 2. J. A. Dougan and K. Faulds, Analyst, 2012, 137, 545-554. 3. K. C. Bantz, A. F. Meyer, N. J. Wittenberg, H. Im, O. Kurtulus, S.
H. Lee, N. C. Lindquist, S. H. Oh and C. L. Haynes, Phys. Chem.
Chem. Phys., 2011, 13, 11551-11567.
4. H. T. Ngo, H. N. Wang, A. M. Fales and T. Vo-Dinh, Anal. Bioanal.
Chem., 2016, 408, 1773-1781.
5. S. Schlücker, Angew. Chem.-Int. Edit., 2014, 53, 4756-4795. 6. K. Faulds, W. E. Smith and D. Graham, Analyst, 2005, 130,
1125-1131.
7. S. Abalde-Cela, P. Aldeanueva-Potel, C. Mateo-Mateo, L. Rodriguez-Lorenzo, R. A. Alvarez-Puebla and L. M. Liz-Marzan, J.
R. Soc. Interface, 2010, 7, S435-S450.
8. A. Barhoumi and N. J. Halas, J. Am. Chem. Soc., 2010, 132, 12792-12793.
9. A. Barhoumi, D. Zhang, F. Tam and N. J. Halas, J. Am. Chem. Soc., 2008, 130, 5523-5529.
10. J. L. Abell, J. M. Garren, J. D. Driskell, R. A. Tripp and Y. P. Zhao,
J. Am. Chem. Soc., 2012, 134, 12889-12892.
11. A. Barhoumi, D. M. Zhang and N. J. Halas, J. Am. Chem. Soc., 2008, 130, 14040-14041.
12. E. Prado, N. Daugey, S. Plumet, L. Servant and S. Lecomte, Chem.
Comm., 2011, 47, 7425-7427.
13. J. D. Driskell, A. G. Seto, L. P. Jones, S. Jokela, R. A. Dluhy, Y. P. Zhao and R. A. Tripp, Biosens. Bioelectron., 2008, 24, 917-922. 14. M. Green, F. M. Liu, L. Cohen, P. Kollensperger and T. Cass,
Farad. Discuss., 2006, 132, 269-280.
15. E. Papadopoulou and S. E. J. Bell, Chem.-Eur. J., 2012, 18, 5394-5400.
16. E. Papadopoulou and S. E. J. Bell, Chem. Comm., 2011, 47, 10966-10968.
17. E. Papadopoulou and S. E. J. Bell, Angew. Chem.-Int. Edit., 2011,
50, 9058-9061.
18. L.-J. Xu, Z.-C. Lei, J. Li, C. Zong, C. J. Yang and B. Ren, J. Am. Chem.
Soc., 2015, 137, 5149-5154.
19. S. R. Panikkanvalappil, M. A. Mackey and M. A. El-Sayed, J. Am.
Chem. Soc., 2013, 135, 4815-4821.
20. S. R. Panikkanvalappil, M. A. Mahmoud, M. A. Mackey and M. A. El-Sayed, ACS Nano, 2013, 7, 7524-7533.
21. N. V. Hud and M. Polak, Curr. Opin. Struct. Biol., 2001, 11, 293-301.
22. J. Morla-Folch, H.-n. Xie, R. A. Alvarez-Puebla and L. Guerrini,
ACS Nano, 2016, 10, 2834-2842.
23. L. Guerrini, Ž. Krpetić, D. van Lierop, R. A. Alvarez-Puebla and D. Graham, Angew. Chem.-Int. Edit., 2015, 54, 1144-1148. 24. M. Masetti, H.-n. Xie, Ž. Krpetić, M. Recanatini, R. A.
Alvarez-Puebla and L. Guerrini, J. Am. Chem. Soc., 2015, 137, 469-476. 25. L. Guerrini, R. Arenal, B. Mannini, F. Chiti, R. Pini, P. Matteini and
R. A. Alvarez-Puebla, ACS Appl. Mater. Interfaces, 2015, 7, 9420-9428.
26. D. van Lierop, Z. Krpetic, L. Guerrini, I. A. Larmour, J. A. Dougan, K. Faulds and D. Graham, Chem. Comm., 2012, 48, 8192-8194. 27. J. Morla-Folch, H.-n. Xie, P. Gisbert-Quilis, S. Gómez-de Pedro,
N. Pazos-Perez, R. A. Alvarez-Puebla and L. Guerrini, Angew.
Chem.-Int. Edit., 2015, 54, 13650-13654.
28. L. Guerrini, Z. Jurasekova, C. Domingo, M. Perez-Mendez, P. Leyton, M. Campos-Vallette, J. V. Garcia-Ramos and S. Sanchez-Cortes, Plasmonics, 2007, 2, 147-156.
29. M. Thomas and A. M. Klibanov, Proc. Natl. Acad. Sci., 2003, 100, 9138-9143.
30. Y. Ma, Y. Guo, J. Li, J. Guan, L. Xu and W. Yang, Chem.–Eur. J., 2009, 15, 13135-13140.
31. A. Kabir and G. Suresh Kumar, PLoS ONE, 2013, 8, e70510. 32. H. Deng, V. A. Bloomfield, J. M. Benevides and G. J. Thomas,
Nucleic Acids Res., 2000, 28, 3379-3385.
33. D. Graham and K. Faulds, Chem. Soc. Rev., 2008, 37, 1042-1051. 34. C. Y. Wu, W. Y. Lo, C. R. Chiu and T. S. Yang, J. Raman Spectrosc.,
2006, 37, 799-807.
35. G. Rusciano, A. C. De Luca, G. Pesce, A. Sasso, G. Oliviero, J. Amato, N. Borbone, S. D’Errico, V. Piccialli, G. Piccialli and L. Mayol, Anal. Chem., 2011, 83, 6849-6855.
36. L.-J. Xu, C. Zong, X.-S. Zheng, P. Hu, J.-M. Feng and B. Ren, Anal.
Chem., 2014, 86, 2238-2245.
37. T. H. James, J. Am. Chem. Soc., 1939, 61, 2379-2383.
38. N. Leopold and B. Lendl, J. Phys. Chem. B, 2003, 107, 5723-5727. 39. S. Sanchez-Cortes and J. V. Garcia-Ramos, J. Raman Spectrosc.,
1998, 29, 365-371.
40. D. Roy and T. E. Furtak, J. Electroanal. Chem., 1987, 228, 229-250.
41. H. Wetzel, H. Gerischer and B. Pettinger, Chem. Phys. Lett., 1981,
78, 392-397.
42. G. Chumanov, M. S. Sibbald and T. M. Cotton, J. Phys. Chem. B, 1998, 102, 10836-10841.
43. N. H. Jang, Bull. Korean Chem. Soc., 2002, 23, 1790-1800. 44. J. Kundu, O. Neumann, B. G. Janesko, D. Zhang, S. Lal, A.
Barhoumi, G. E. Scuseria and N. J. Halas, J. Phys. Chem. C, 2009,
113, 14390-14397.
45. J. L. Mergny, A. De Cian, A. Ghelab, B. Sacca and L. Lacroix,
Nucleic Acids Res., 2005, 33, 81-94.
46. V. Andrushchenko, D. Tsankov, M. Krasteva, H. Wieser and P. Bouř, J. Am. Chem. Soc., 2011, 133, 15055-15064.
47. C. Simard and R. Savoie, Biopolymers, 1994, 34, 91-100. 48. H. Deng, V. A. Bloomfield, J. M. Benevides and G. J. Thomas,
49. E. Papadopoulou and S. E. J. Bell, J. Phys. Chem. C, 2011, 115, 14228-14235.
50. S. E. J. Bell and M. R. McCourt, Phys. Chem. Chem. Phys., 2009,
11, 7455-7462.
51. L. Guerrini, F. McKenzie, A. W. Wark, K. Faulds and D. Graham,
Chem. Sci., 2012, 3, 2262-2269.
52. A. Estevez-Torres and D. Baigl, Soft Matter, 2011, 7, 6746-6756. 53. J. Florian, V. Baumruk and J. Leszczynski, J. Phys. Chem., 1996,
100, 5578-5589.
54. D. Shugar and J. J. Fox, Biochim. Biophys. Acta, 1952, 9, 199-218. 55. R. M. C. Dawson, D. C. Elliott, W. H. Elliott and K. M. Jones, Data
for Biochemical Research, 3rd edn., Oxford, 1986.
56. A. Toyama, H. Takeuchi and I. Harada, J. Mol. Struct., 1991, 242, 87-98.
57. B. Giese and D. McNaughton, Phys. Chem. Chem. Phys., 2002, 4, 5171-5182.
58. M. A. Xaplanteri, A. D. Petropoulos, G. P. Dinos and D. L. Kalpaxis, Nucleic Acids Res., 2005, 33, 2792-2805.
59. C. W. Tabor and H. Tabor, Annu. Rev. Biochem., 1984, 53, 749-790.
60. R. Marquet and C. Houssier, J. Biomol. Struct. Dyn., 1988, 6, 235-246.
61. J. Ruiz-Chica, M. A. Medina, F. Sanchez-Jimenez and F. J. Ramirez, Biophys. J., 2001, 80, 443-454.
62. C. N. N'Soukpoe-Kossi, A. A. Ouameur, T. Thomas, A. Shirahata, T. J. Thomas and H. A. Tajmir-Riahi, Biomacromolecules, 2008, 9, 2712-2718.
63. J. G. Duguid, V. A. Bloomfield, J. M. Benevides and G. J. Thomas,
Biophys. J., 1996, 71, 3350-3360.
64. J. M. Benevides, S. A. Overman and G. J. Thomas, J. Raman
Spectrosc., 2005, 36, 279-299.
65. J. M. Benevides, M. Tsuboi, J. K. H. Bamford and G. J. Thomas,
Biophys. J., 1997, 72, 2748-2762.
Figure 1. Schematic outline of both positively-charged and
negatively-charged Ag nanoparticle surface chemistry. (A) Detail of the 115-400 cm-1 spectral region of SERS spectra
obtained by aggregating each colloids with addition of MgSO4
solution (0.1 M). The intense ν(metal-halide) bands at low wavenumbers are centred at ca. 118, 162 and 243 cm-1 (Ag-I,
Ag-Br and Ag-Cl, respectively).(B-C) Extinction spectra of (B) AgSp and (C) AgCit@Cl colloids before and after the addition of ssDNA (final concentration 1 μM). In the case of positively-charged colloids, addition of DNA causes fast nanoparticle aggregation whereas for negatively charged-colloids no significant perturbation of the colloidal stability is observed unless an aggregating agent (i.e.; MgSO4) is further added to
the mixture.
O O
O O
O O OH
-
-O O
O O
O O OH
-
-O O
O O
O O OH
-
-O O
O O
O O OH
-
-Halides (Cl-, Br-, I-)
Citrate
Cl
-Cl
-Cl
-Cl
-Cl
-Cl
-Cl
-Cl
-Positively-charged surface
Negatively-charged surface
150 200 250 300 350
Raman shift (cm-1)
1
18 162 243
AgSp
AgHX
AgCit
AgCit@Cl
AgCit@Br
AgCit@I
A
300 400 500 600 700 800
AgCit@Cl + ssDNA
+ ssDNA +MgSO4
Wavelength (nm) Wavelength (nm)
AgSp + ssDNA
300 400 500 600 700 800
B
[image:8.595.313.549.89.436.2]Figure 3. SERS spectra of pT on different colloids: (A) AgSp,
AgHX, AgCit@Cl, AgCit@Br and AgCit@I. For negatively-charged colloids, aggregation was induced by addition of MgSO4 solution (0.1 M); (B) AgCit@Cl, AgCit@Br and AgCit@I.
In this case, the nanoparticle aggregation was provoked by addition of SpCl4 solution (0.1 M). Final pT concentration in
the samples 1 μM. AgSp
AgCit@Cl
AgCit@Br
AgCit@I
AgCit@Cl
AgCit@Br
AgCit@I
B
A
Raman shift (cm-1)
600 800 1000 1200 1400 1600
AgHX
AgHX
783
790
841
pT = TTTTTTTTTTTTTTTTTTTTT
Sp
Figure 2. SERS spectra of pA on different colloids: (A) AgSp,
AgHX, AgCit@Cl, AgCit@Br and AgCit@I. For negatively-charged colloids, aggregation was induced by addition of MgSO4 solution (0.1 M); (B) AgHX, AgCit@Cl, AgCit@Br and
AgCit@I. In this case, the nanoparticle aggregation was provoked by addition of a SpCl4 solution (0.1 M). Final pA
concentration in the samples 1 μM.
600 800 1000 1200 1400 1600
AgSp
AgHX
AgCit@Cl
AgCit@Br
AgCit@I
AgCit@Cl
AgCit@Br
AgCit@I
B
A
Raman shift (cm-1)
pA = AAAAAAAAAAAAAAAAAAAAA
734
730
1332
1321
791
796
AgHX
[image:9.595.52.554.87.520.2]Figure 4. SERS spectra of pC on different colloids: (A) AgSp,
AgHX and AgCit@Cl. For negatively-charged colloids, aggregation was induced by addition of MgSO4 solution (0.1
M); (B) AgHX, AgCit@Cl, AgCit@Br and AgCit@I. In this case, the nanoparticle aggregation was produced by addition of a SpCl4 solution (0.1 M). Final pC concentration in the samples
1 μM. SERS backgrounds of colloids (Fig. S2) were digitally removed from the corresponding DNA spectra.
AgSp
AgCit@Cl
AgCit@Cl
AgCit@Br
AgCit@I
B
A
Raman shift (cm-1)
600 800 1000 1200 1400 1600
AgHX
AgHX
793
784 1239
1301 1630
1655
1031
pC = CCCCCCCCCCCCCCCCCCCCC
[image:10.595.305.550.68.320.2]Sp
Figure 5. SERS spectra of pG on different colloids: (A) AgSp,
AgHX and AgCit@Cl colloids. For negatively-charged colloids, aggregation was induced by addition of MgSO4 solution (0.1
M). (B) AgHX and AgCit@Cl colloids aggregated by addition of 0.1 M SpCl4 solution. Final pG concentration in the samples 1
μM.
AgSp
AgCit@Cl AgHX
Raman shift (cm-1)
pG = GGGGGGGGGGGGGGGGGGGGG
AgCit@Cl AgHX
658
682
600 800 1000 1200 1400 1600
B
A
1322
1347
1690
1640
620
Sp
Figure 6. (A, B) Absolute SERS intensities of the A, C, T and G
ring breathing modes observed in the SERS spectra (Fig. 2-5) of the corresponding homopolymers pA, pC, pT and pG on AgCit@Cl, AgCit@Br and AgCit@I colloids aggregated with (A) MgSO4 or (B) SpCl4 solutions (0.1 M). (C, D) Ratios between
the intensities of the nucleobase ring breathing mode and the corresponding v(PO2-) band for each homopolymers pA, pC,
pT and pG on AgCit@Cl, AgCit@Br and AgCit@I colloids aggregated with (C) MgSO4 or (D) SpCl4 solutions (0.1 M).
Error bars equal to one standard deviation (N = 3).
SERS int.
ring
br
.
bands
20k 40k 60k 80k 100k
AgCit@Cl AgCit@Br AgCit@I 0
A
pA pC pT pG
AgCit@Cl AgCit@Br AgCit@I 0 40k 80k 120k 160k 200k 240k
B
AgCit@Cl AgCit@Br AgCit@I
D
1 2 3 4 5 6 7 8
Intens
ity
ra
tio
ring
br
./
v
(PO
2
-)
AgCit@Cl AgCit@Br AgCit@I
C
[image:10.595.56.298.71.398.2] [image:10.595.312.552.394.637.2]Figure 7. Schematic outline of the mechanisms of adsorption of single-stranded DNAs on silver colloids: (A) direct
nucleobase/metal interaction and (B) electrostatic interaction with the phosphate backbone and negatively-charged residual anions onto the surface mediated by backbone neutralizers (such as spermine or Mg2+). This last mechanism can take place (i)
via previous complexation of DNA with backbone neutralizers followed by adsorption of the so-formed complex on the negatively-charged surfaces or (ii) by direct coordination of the DNA phosphate backbone of onto spermine-coated nanoparticles (AgSp).
Mg2+ Mg2+ Mechanism 1:
DIRECT NUCLEOBASE/METAL INTERACTION
Mechanism 2:
ELECTROSTATIC INTERACTION VIA NEUTRALIZED PHOSPHATE BACKBONE
-
--
--
-
-
[image:11.595.56.534.75.255.2]
-Figure 8. SERS spectra of single and double-stranded DNAs on
silver colloids in the 480-920 cm-1 and 1250-1730 cm-1
spectral ranges. For negatively-charged colloids, aggregation was induced by addition of MgSO4 solution (0.1 M). For the
sake of comparison, the spectra were normalized to the PO2
-stretching at ca. 1089 cm-1. The final ssDNA and dsDNA
concentrations were kept constant to 1 μM and 0.5 μM, respectively. 1254 1312 1363 * * * 1649 1575 1485 1247 792 751 734 683 622 599 510 1028 1089 1421 1453 1506 1321 1317 AgCit@Br AgCit@I AgSp AgCit@Cl AgHX 808 600 800
500 700 900
Raman shift (cm-1)
733 792 784 785 730 729 747 808 841 683 660 1244 1267 1451 1400 1600
1300 1500 1700
ssDNA CATCGCAGGTACCTGTAAGAG dsDNA CATCGCAGGTACCTGTAAGAGGTAGCGTCCATGGACATTC TC
1254 1312 1363 * * * 1649 1575 1485 1247 792 751 734 683 622 599 510 1028 1089 1421 1453 1506 1321 1317 AgCit@Br AgCit@I AgSp AgCit@Cl AgHX 808 600 800
500 700 900
Raman shift (cm-1)
733 792 784 785 730 729 747 808 841 683 660 1244 1267 1451 1400 1600
1300 1500 1700
ssDNA CATCGCAGGTACCTGTAAGAG dsDNA CATCGCAGGTACCTGTAAGAGGTAGCGTCCATGGACATTC TC
1254 1312 1363 * * * 1649 1575 1485 1247 792 751 734 683 622 599 510 1028 1089 1421 1453 1506 1321 1317 AgCit@Br AgCit@I AgSp AgCit@Cl AgHX 808 600 800 500 700 900
Raman shift (cm-1)
733 792 784 785 730 729 747 808 841 683 660 1244 1267 1451 1400 1600 1300 1500 1700
ssDNA CATCGCAGGTACCTGTAAGAG
[image:12.595.315.560.96.368.2]dsDNA CATCGCAGGTACCTGTAAGAGGTAGCGTCCATGGACATTC TC
Figure 9. SERS spectra of high-quality double-stranded DNA
isolated from the thymus of calves (ctDNA) on: (A) AgSp colloids and AgHX and AgCit@Cl colloids aggregated with MgSO4 solution; (B) AgHX and AgCit@Cl colloids aggregated
with SpCl4 solution. Final DNA concentration in the sample 10
μg/mL.
Raman shift (cm-1)
600 800 1000 1200 1400 1600
Genomic dsDNA from the thymus of calves
[image:12.595.51.291.98.482.2]Table of Content
Unraveling the role played by the surface chemistry of silver colloids in the direct SERS analysis of DNA.
Raman shift (cm-1)
600 800 1000 1200 1400 1600
O
O O O
O O OH
-
-O
O O O
O O OH
-
-O
O O O
O O OH
-
-O
O O O
O O OH
-
-Halides (Cl-, Br-, I-)
Citrate Cl
-Cl
-Cl
-Cl
-Cl
-Cl -Cl