Structural proteins of equine infectious anemia virus.
Full text
Figure

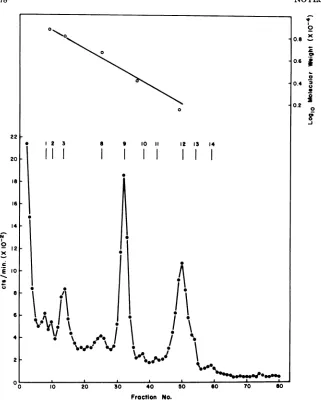
![FIG. 3.gradients,,uCi/ml;the Polyacrylamide gel electrophoresis ofEIAVglycopeptides. EIA Vproduced during a 24-h period in presence of f3H]glucosamine (20 ,iCi/ml; specific activity, 6.3 Ci/mmol) or L-'4C-amino acid mixture (2 specific activity, 54 mCi/mAt](https://thumb-us.123doks.com/thumbv2/123dok_us/1522752.104856/4.505.59.449.59.376/gradients-polyacrylamide-electrophoresis-ofeiavglycopeptides-vproduced-glucosamine-specific-activity.webp)
Related documents
N-18 cells were infected at an MOI of 10 and incubated at 39°C for 24 h after infection, at which time a number ofpolykaryocytes were forming (x800). (14, 25), we have
To demonstrate that the differences in the nuclear k B DNA-binding complexes observed in v-Rel- and c-Rel-transformed cells were not due the long time required to establish
Cells infected with vaccinia virus vTF7-3 and transfected with plasmid pPVM-1 (vTF7-3-infected/pPVM-1-transfected cells) produce the same protein profile as that observed for
Human immunodeficiency virus type 1 (HIV-1) infection is initiated by binding of the viral envelope glycoprotein to CD4 molecules on the surface of the target cell followed by
As expected, when pBLVsSVnlsLacZ was trans- fected into different cell lines, LacZ expression was detected independently of Tax expression (including the ovine RFM2, bovine PV,
NIH 3T3 cells trans- fected with the plasmids containing the HPV-6 E5a ORF exhibited a transformed phenotype when compared with cells transfected with the vector (Table 2). The
Thus, at least nine acidic and five basic cellular proteins, ranging in Mr from 120 to 30 kilodaltons, are clearly degraded during poliovirus infection of HeLa cells.. The
Figure 2 shows the dimensionless temperature distribution along the r -axis, obtained from the kinetic (S-model and DSMC) approaches and the continuum (numerical and analytical)
