City, University of London Institutional Repository
Citation: Royse, C. F., Newman, S. P., Williams, Z. and Wilkinson, D. J. (2013). A human
volunteer study to identify variability in performance in the cognitive domain of thepostoperative quality of recovery scale. Anesthesiology, 119(3), pp. 576-581. doi: 10.1097/ALN.0b013e318299f72b
This is the accepted version of the paper.
This version of the publication may differ from the final published
version.
Permanent repository link: http://openaccess.city.ac.uk/3785/
Link to published version: http://dx.doi.org/10.1097/ALN.0b013e318299f72b
Copyright and reuse: City Research Online aims to make research
outputs of City, University of London available to a wider audience.
Copyright and Moral Rights remain with the author(s) and/or copyright
holders. URLs from City Research Online may be freely distributed and
linked to.
City Research Online: http://openaccess.city.ac.uk/ [email protected]
ABSTRACT
Background: The Postoperative Quality of Recovery Scale found lower than anticipated recovery in the cognitive domain. The definition of cognitive recovery did not allow for performance variability, and may have been too sensitive. This study aimed to examine variability in cognitive perfor-mance in volunteers.
Methods: One hundred forty-three volunteers completed the cognitive domain questions at baseline, after 15 min and 40 min, and on days 1 and 3. Delivery via face-to-face interview was conducted for the first three measurements, and then randomized for day 1 and 3 measurements (face-to-face only, telephone only, telephone then face-(face-to-face, face-to-face then telephone).
Results: All volunteers answered orientation correctly. Mean change scores for other tests were positive, indicating a modest learning effect. There were no significant differ-ences between methods of delivery (all P > 0.05). Due to variability in volunteers’ performances, the authors propose a new scoring system to introduce a tolerance factor in scor-ing cognitive recovery. The proposed revised change from baseline scores are: orientation 0 or higher, digits forward −2 or higher, digits back −1 or higher, word recall −3 or higher, and word generation −3 or higher. This resulted in approximately 95% volunteers classed as “recovered” for each test item, and recovery for the domains ranged from 82.6 to 89.1%. The initial feasibility study was reanalyzed and cognitive recovery increased at all assessment times. At 3 days, cognitive recovery was found to increase from 33.5 to 86.4%.
Conclusion: The authors recommend adoption of the new method for scoring cognitive recovery in the Postoperative Quality of Recovery Scale. Telephone or face-to-face delivery was equivalent and either method can be reliably applied.
What We Already Know about This Topic
• The Postoperative Quality of Recovery Scale, published in AneSTheSiology in 2010, found lower than anticipated recov
-ery in the cognitive domain.
• one hundred forty-three volunteers completed the Postopera
-tive Quality of Recovery Scale cogni-tive domain questions at baseline, 15 min, 40 min, and 1 and 3 days. Delivery was face-to-face for the first three measurements, and then randomized for day 1 and 3 measurements to combinations of face-to-face and telephone interviews.
What This Article Tells Us That Is New
• The investigators propose a new scoring system that includes performance tolerance such that more than 80% of subjects are considered recovered in the cognitive domain at 3 days. • There were no important differences between methods of
delivery; telephone administration of Postoperative Quality of Recovery Scale is, thus, valid.
Copyright © 2013, the American Society of Anesthesiologists, Inc. Lippincott Williams & Wilkins. Anesthesiology 2013; XX:00-00
* Professor, Anaesthesia and Pain Management Unit, Depart-ment of Surgery, The University of Melbourne, Melbourne, Vic-toria, Australia; and Consultant Anaesthesiologist, Department of Anaesthesia and Pain Management, The Royal Melbourne Hos-pital, Melbourne, Victoria, Australia. † Professor of Health Psy-chology and Dean, Faculty of Health Sciences, City University London, London, United Kingdom; and Honorary Consultant, University College London Hospitals, London, United Kingdom. ‡ Research Nurse Manager, Department of Surgery, The University of Melbourne. § Emeritus Consultant Anaesthetist, Boyle Depart-ment of Anaesthesia, St. Bartholomew’s Hospital, London, United Kingdom.
Received from the PQRS Advisory Board. Submitted for publi-cation September 19, 2012. Accepted for publipubli-cation April 3, 2013. This project was funded by a research grant provided by Baxter Healthcare Corporation (Deerfield, Illinois). Drs. Royse, Newman, and Wilkinson have all received honoraria, and travel support from Baxter Healthcare (Deerfield, Illinois), and Drs. Royse and New-man have received research support from Baxter Healthcare (which makes anesthesia drugs).
Address correspondence to Dr. Royse: Department of Surgery, The University of Melbourne, 245 Cardigan Street, Carlton, Victoria 3053, Australia. [email protected]. Information on pur-chasing reprints may be found at www.anesthesiology.org or on the masthead page at the beginning of this issue. ANESTHESIoLogy’s
articles are made freely accessible to all readers, for personal use only, 6 months from the cover date of the issue.
A Human Volunteer Study to Identify Variability
in Performance in the Cognitive Domain of the
Postoperative Quality of Recovery Scale
Anesthesiology 2013; XX:00-00 2 Royse et al.
T
HE Postoperative Quality of Recovery Scale (PQRS) is a tool to measure quality of recovery after surgery and anesthesia.1 Recovery is measured in five domains(physi-ological, nociceptive—pain and nausea, emotive—anxiety and depression, activities of daily living, and cognition). Recovery is defined as a return to baseline scores (presurgery) or better. For most of the domains, the answer choices are either a 3- or 5-point Likert scale. However, for the cognitive domain, there is a wider range of possible performance for some of the tests. To assess cognition, five questions are used (orientation to name, place, and date of birth, digits for-ward, digits back, word generation, and word recall), which are derived from formal neurocognitive tests used to assess cognitive performance.2 Parallel forms, containing different
number and word choices for the questions, are frequently used to minimize the learning effect, which is prevalent in neurocognitive testing, but do not always remove these completely.2
In the PQRS publication,1 we reported data from 701
patients undergoing our feasibility study. The proportion of cognitive recovery, defined as return to baseline, was low, with only 33.5% recovery by day 3. As part of the ongoing validation of the PQRS, we conducted a volunteer study to identify the performance variability of the cognitive tests. Normal volunteers were not expected to demonstrate neu-rocognitive decline during a 3-day period, if anything, they would be expected to show some level of improved perfor-mance through learning. However, they may also have dete-rioration in performance due to extraneous factors, such as fatigue. It was considered possible that the absolute defini-tion of recovery used in the PQRS, may be overly sensitive for measurement of cognition, as it did not allow for any performance variability.
The aim of the study was to measure performance vari-ability and test relivari-ability over 3 days, using the PQRS in the cognitive domain as well as to assess the method of delivery on cognitive performance in healthy volunteers.
Materials and Methods
The study was performed in two centers, at the University of Melbourne and University College, London. Human research ethics committee approval was obtained from the Human Research Ethics Committees of The University of Melbourne (Melbourne, Australia), and The University College (London, United Kingdom). After informed written consent, 143 unteers without cognitive disability were recruited. The vol-unteers were asked whether they had any previous medical or learning disorder that would indicate cognitive disability.
PQRS cognition testing was conducted on five occasions. After recruitment, baseline testing was performed, followed by a repeat at 15 and 40 min. These three measurement points were conducted via face-to-face interview. Testing was repeated on days 1 and 3. Volunteers were randomized into four groups, using a computer generated random sequence, according to telephone or face-to-face interview for days 1
and 3 time periods. This protocol attempted to replicate the timings used in the PQRS feasibility study.1 The sequence of
testing for the four groups on days 1 and 3 were: telephone then telephone, telephone then face-to-face, face-to-face then face-to-face, and face-to-face then telephone.
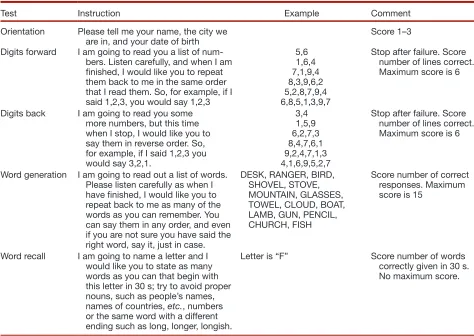
The five cognitive tests used in the PQRS are described in table 1. The same parallel forms and time points, which were used in the PQRS feasibility study, are used in this study. The score for each question at each measurement time period were subtracted from the baseline scores to produce a change score.
In the PQRS feasibility study,1 a convenience sample of
patients (n = 701) were recruited into the study if they were 6 yr or older, undergoing elective surgery under general anes-thesia, and able to complete the testing. Exclusion criteria were: (1) current psychiatric disturbance, or (2) undergoing neurosurgery, which could impair the patients’ ability to participate in the assessment. A wide range of surgical cases were included and selection was by convenience sampling. A reanalysis of the cognitive domain recovery was performed, using the results of the human volunteer study, which specif-ically involved adjustment by the use of a tolerance factor to each cognitive area. Cognitive domain recovery still required recovery in all five areas.
Statistical Methods
Cognitive score values are expressed as mean ± SD. Com-parison between delivery methods was performed using repeated measures ANOVA for between-group (group × time) interactions (SPSS V19; IBM, Chicago, IL). P value less than 0.05 was considered significant. Reliability was assessed using Cronbach α, comparing the change score for each cognitive test over four recovery time periods.
The proportion of volunteers recovered for each test was calculated for change scores of 0 or higher, −1 or higher, −2 or higher, and −3 or higher, with the intention of achieving approximately 2 SDs of the population of volunteers to be classed as “recovered” for each test. The sample size was based on a repeated measured ANOVA design for four groups, to account for different delivery methods of face-to-face and telephone delivery. With an estimated SD of 1.0 between measures, α = 0.05, power of 80%, and a moderate effect size of 0.5, the minimal sample size was 32 per group. Due to the difference in score values between the five tests, a more conservative estimate was used and a target of 45 volunteers per group was planned.
Results
One hundred forty-three volunteers participated in the study. Due to logistical difficulties in recruitment at one site, only 143 of the projected 180 volunteers were recruited. The group consisted of telephone-telephone (36), face-to-face then face-to-face (40), telephone then face-to-face (30), and face-to-face then telephone (37). The age was 37 ± 17 (range
17–92 yr) and years of education was 16.4 ± 3.2 yr (range 5–30). Of the volunteers 61 were men, and 82 were women.
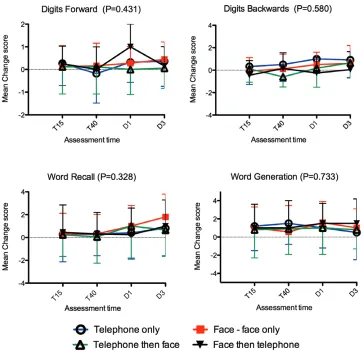
Baseline values and changes scores are shown in table 2. All volunteers scored 3 on the orientation subtest (maximum score), but performance was variable for the other tests. The change scores for each cognitive test and for each delivery method are shown in figure 1. There were no significant differences between groups defined by delivery for any cognitive tests. The mean change scores showed a small positive value, indicating a learning effect evident at the first repeated assessment, but this did not continue to increase with subsequent testing. The groups were combined for subsequent analysis.
The incidence of recovery in normal volunteers for tests other than orientation ranged from 67.1 to 86.1% and is
shown in table 3. To achieve approximately 2 SDs of the cohort classed as “recovered” for each of the tests, the change scores to define recovery were altered to: orientation 0 or higher (unchanged), digits forwards −2 or higher, digits back −1 or higher, word recall −3 or higher, and word generation −3 or higher. The original and new recovery proportions for each test and time period are shown in table 3.
[image:4.585.52.526.88.424.2]With the introduction of the tolerance factor, patients with baseline scores that are equal to or below the tolerance factor would automatically score as “recovered.” The propor-tion of volunteers with baseline scores of 3 or lesser for digits back was 1.4%, 2 or lesser for digits back was 2.8%, 4 or lesser for word recall was 2.1%, and 4 or lesser for word gen-eration was 0%. As digits back is a more difficult test, the
Table 1. Description of the Five Cognitive Tests Used in the Postoperative Quality of Recovery Scale
Test Instruction Example Comment
Orientation Please tell me your name, the city we
are in, and your date of birth Score 1–3
Digits forward I am going to read you a list of num-bers. Listen carefully, and when I am finished, I would like you to repeat them back to me in the same order that I read them. So, for example, if I said 1,2,3, you would say 1,2,3
5,6 1,6,4 7,1,9,4 8,3,9,6,2 5,2,8,7,9,4 6,8,5,1,3,9,7
Stop after failure. Score number of lines correct. Maximum score is 6
Digits back I am going to read you some more numbers, but this time when I stop, I would like you to say them in reverse order. So, for example, if I said 1,2,3 you would say 3,2,1.
3,4 1,5,9 6,2,7,3 8,4,7,6,1 9,2,4,7,1,3 4,1,6,9,5,2,7
Stop after failure. Score number of lines correct. Maximum score is 6
Word generation I am going to read out a list of words. Please listen carefully as when I have finished, I would like you to repeat back to me as many of the words as you can remember. You can say them in any order, and even if you are not sure you have said the right word, say it, just in case.
DESK, RANGER, BIRD, SHOVEL, STOVE, MOUNTAIN, GLASSES, TOWEL, CLOUD, BOAT, LAMB, GUN, PENCIL, CHURCH, FISH
Score number of correct responses. Maximum score is 15
Word recall I am going to name a letter and I would like you to state as many words as you can that begin with this letter in 30 s; try to avoid proper nouns, such as people’s names, names of countries, etc., numbers or the same word with a different ending such as long, longer, longish.
Letter is “F” Score number of words
correctly given in 30 s. No maximum score.
Table 2. Baseline Scores and Change Scores
Test Baseline T15 change T40 change D1 change D3 change
Orientation 3 ± 0 0 0 0 0
Digits forward 5.1 ± 0.9 0.1 ± 1.0 0.9 ± 1.1 0.3 ± 1.0 0.4 ± 1.0
Digits back 3.4 ± 1.2 0.2 ± 1.3 0.3 ± 1.3 0.6 ± 1.4 0.6 ± 1.4
Word recall 7.3 ± 1.9 0.5 ± 2.0 0.3 ± 1.9 0.9 ± 2.2 0.9 ± 2.2
Word generation 10.3 ± 2.7 1.3 ± 2.5 1.5 ± 2.8 1.5 ± 2.5 1.2 ± 2.7
[image:4.585.52.532.633.717.2]Anesthesiology 2013; XX:00-00 4 Royse et al.
proportion of volunteers with baseline scores of 3 or lesser was 32%, and the decision was made to reduce the tolerance factor to baseline −1 for the digits back test as a compro-mise between accuracy and feasibility (to allow most of the patients to complete the test). The recovery rates using the original definition of “return to baseline values or better” and
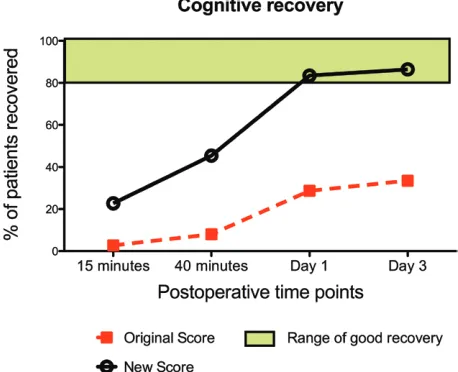
the revised scoring for the whole cognitive domain is shown in figure 2.
[image:5.585.111.474.73.424.2]A subanalysis of baseline scores and change scores was conducted for patients less than 50 yr versus patients 50 yr or more. The only difference in baseline scores between groups was for the word recall where older patients scored lower
Fig. 1. The mean change scores are shown for each group of volunteers over four time periods, for digits forward, digits back, word recall, and word generation. Error bars indicate 1 SD. P is the repeated measured ANOVA for group × time comparisons. T15 is conducted 15 min, T40 is conducted 40 min, D1 and D3 are conducted on days 1 and 3 after baseline.
Table 3. Proportion of Volunteers (%) Scored as Recovered Using the Original and New Scoring Methods
Cognitive Test T15 T40 D1 D3 Average
Original digits forward 82.3 75.0 82.4 86.1 81.5
New digits forward 99.3 99.3 100 100 99.6
Original digits back 75.2 77.1 80.1 79.6 78.0
New digits back 89.9 90.6 95.7 95.0 92.1
Original word recall 77.0 67.1 77.0 77.0 74.5
New word recall 97.1 97.1 96.3 96.3 96.7
Original word generation 72.3 77.1 77.2 71.5 74.5
New word generation 97.1 95.7 98.6 96.4 97.0
Numbers are expressed as percentage recovered using the original and new scoring methods. The original score was return to baseline values or better for each test, whereas, the new score included an adjustment for variability of performance: baseline values −2 for digits forward, baseline values −1 for digits back, and baseline values −3 for word recall and word generation. T15 is conducted 15 min, T40 is conducted 40 min, D1 and D3 are conducted 1 and 3 days after baseline.
[image:5.585.53.534.581.699.2]than younger patients (mean [SD], 5.9 [1.8] vs. 7.8 [1.8];
P < 0.001). Repeated measures analysis of change scores between older and younger groups was not different for any of the cognitive tests (all P > 0.05).
The reliability of individual cognitive tests was acceptable with Cronbach α values of 0.837 for digits forward, 0.801 for digits back, 0.841 for word recall, and 0.815 for word generation.
The cognitive recovery from the 701 patient feasibility study1 was reanalyzed using the new scoring system, and
shown in figure 3. Patients with low baseline scores (digits forward <3, digits back <2, word recall <4, and word genera-tion <4) were excluded from analysis, leaving 533 patients for analysis. Overall cognitive recovery rates in patients attempt-ing the PQRS increased from 2.7, 8, 28.7, and 33.5% at
15 min, 40 min, day 1 and day 3 after surgery, to 22.7, 45.4, 83.5, and 86.4%, respectively.
Discussion
This study showed that there is variability in performance in all the cognitive tests except for orientation (which has a ceiling effect) in normal volunteers not undergoing surgery. Apart from orientation, the other cognitive tests showed sufficient variability that the strict definition of recovery “return to baseline values or better” for these cognitive ques-tions resulted in failure of recovery in approximately 25% of volunteers for individual cognitive tests, and more than 50% failed to recover in the cognitive domain. Our premise is that volunteers should not have substantially lower cogni-tive performance over the 3 days of testing. By introducing a tolerance value into the scoring system, the average recovery rates approached 2 SDs of the population for each test, and recovery exceeded 80% for the cognitive domain. It is our recommendation that this new scoring system be adopted to define recovery for the cognitive domain of the PQRS.
The method of delivery of the PQRS, whether by telephone or face-to-face did not significantly affect cognitive performance. Use of telephone interview after discharge improves the feasibility of conducting follow-up PQRS measurements, as patients do not need to return to the hospital for face-to-face interviews.
Other domains of the PQRS use a 3- or 5-point Likert scale to rate items, such as pain, nausea, anxiety, depression, or activities of daily living. Although subject to some variability, these subjective reports by patients are likely to accurately rate improvement or worsening of pain or nausea, for example, from the previous exposure. Cognitive testing, however, can have variability of performance within normal volunteers, as was shown in this study, leading to potential inaccuracy of the test. Although older volunteers had lower baseline scores for the word generation test, there was no significant difference in change scores over time between younger and older patients. Factors such as the time of day, fatigue levels, situational exposure, and other distractions could affect cognitive performance.2 If the
strict definition of return to baseline values or better is applied to the cognitive domain, then the tool may be considered as too sensitive and will yield many false-positives, with the result that many patients who may have recovered would be classed as not recovered. Thus, the low incidence of cognitive recovery in the PQRS feasibility study1 may have been exaggerated due to the
strict definition applied. The introduction of a tolerance factor, as described in this article, enables the tool to account for natural variability of performance and is likely to reflect more accurately the true incidence of recovery from surgery and anesthesia.
[image:6.585.54.281.74.254.2]Recovery for the whole domain will be lower than recov-ery for individual tests, as failure in any one of the five tests results in failure of recovery for the domain. Even though individual test recovery rates exceed 90%, and mostly exceeded 95%, the recovery for the whole domain ranged
Fig. 2. The proportion of volunteers who were scored as
recovered in the cognitive domain is shown for the original and new scoring methods. The green shaded box indicates a range where recovery should be considered as very good.
[image:6.585.53.282.506.692.2]Anesthesiology 2013; XX:00-00 6 Royse et al.
between 82.6 and 89.1%. Therefore, a recovery rate exceed-ing 80% is considered more realistic of good recovery than a recovery rate of 95–100%. In figures 2 and 3, we have added a colored box from 80 to 100% in order to illustrate that recovery in this range should be considered good recovery.
The size of the tolerance factor is a balance between accu-racy and feasibility. If it is too small, then the tool could have an excessive false-positive (failure to recover) rate. However, if too high, then it will lose discrimination ability and poten-tially have an excessive false-negative rate. The accuracy as determined by the Cronbach α was acceptable for each test. Another factor in determining the size of the tolerance fac-tor is that the baseline scores have to exceed the tolerance factor, otherwise patients would automatically be scored as recovered. These patients would need to be excluded from recovery analysis in the cognitive domain. We believe that it was acceptable for less than 5% of volunteers to be excluded for each cognitive test because of low baseline scores. In the case of digits back, the proportion of volunteers excluded rose from 2.8% for a tolerance factor of baseline −1, to 32% for a tolerance of baseline −2. The larger tolerance factor would render the test unfeasible due to exclusion of so many patients, and the decision was made to use the lower toler-ance factor. We recommend excluding patients whose base-line values are less than the tolerance factor.
The tolerance factors are similar to the SD of baseline values. This is a similar concept to that used in assessing postoperative cognitive dysfunction, where significant change in a cognitive test is typically more than 1 SD from baseline values.3–5 When
utilizing these new measures, the incidence of cognitive recovery was recalculated in the original PQRS feasibility study increased proportionally over time with 86.4% recovery at 3 days after surgery, and is more consistent with clinical expectation. This places recovery from day 1 in the “range of good recovery.”
Variability of performance in cognitive testing is not an inherent quality of the PQRS, but rather an inherent qual-ity of all neurocognitive testing. The PQRS tests are based on conventional neurocognitive tests, all of which are subject to variability. In addition to the variability of patient perfor-mance, there is the added variability that patients can recover and then lapse into a worse state. Furthermore, the questions test different aspects of cognition yet these are collapsed to produce a dichotomized outcome of recovery or postoperative cognitive dysfunction. The very nature of cognition testing is, therefore, subject to inaccuracy. There are many strategies used to minimize inaccuracy, as we have described for the PQRS, or the use of mathematical correction factors to adjust for baseline variability. However, they are all techniques to reduce inaccuracy and cannot eliminate the inherent inaccu-racies and variability associated with neurocognitive testing.
So, how should the reader interpret cognitive recovery using the PQRS? First, we recommend the concept of “a range of good recovery,” which is a group recovery above 80%. We also advise the reader to be cautious in interpreting data where small differ-ences are observed. A small difference (e.g., 72 vs. 77%) could
be “statistically significant” but potentially fall into the overlap of inaccuracies for each group. This is the same principle that the reader would apply to measurements that have variability of performance or subjective assessment (such as pain, delirium, or satisfaction scales). We also recommend that a single time point of recovery is less informative than the profile of recov-ery over multiple time periods. Although single time points are often used to determine sample size, it is easier to discriminate differences when measured over multiple time points, as well as detecting the time period when recovery plateaus or becomes equivalent between groups. Good trial design will improve the ability to discriminate between groups, such as adequate sample size, randomization, and the minimization of confounders. Dis-criminant validation studies are in progress with the PQRS and will add to the confidence in use of the scale.
Our study has several limitations. Our recruitment was less than intended due to logistical difficulties, although in all but one group, the group size exceeded our minimal sample size esti-mate. It is possible that a small difference could exist between the groups that was not detected, resulting in a small risk of type II error, especially as the study was powered to detect a moderate difference between groups. As our aim was to assess variability in normal volunteers, it is possible that the degree of accuracy may be different in patients with cognitive disability, or in the post-operative setting. Similarly, it is possible that the use of telephone
versus face-to-face survey methods could vary in specific patient populations or at different times in the postoperative period.
Conclusion
We recommend adoption of the new scoring system for the cognitive domain of the PQRS, exclusion of patients with base-line cognitive scores below the tolerance factor, and recognition of recovery for the cognitive domain exceeding 80% as good recovery. Telephone or face-to-face delivery was equivalent.
The authors thank the many volunteers who participated in the study. We thank Jan Stygall, MSc, Senior Research Fellow (now re-tired), Unit of Behavioural Medicine, University College London, London, United Kingdom, for contribution to patient recruitment and data collation.
References
1. Royse CF, Newman S, Chung F, Stygall J, McKay RE, Boldt J, Servin FS, Hurtado I, Hannallah R, Yu B, Wilkinson DJ: Development and feasibility of a scale to assess postop
-erative recovery: The post-op-erative quality recovery scale.
ANESTHESIoLogY 2010; 113:892–05
2. Lezak M, Loring D, Hannay H, Joscher J: Neuropsychological Assessment, 4th edition. New York, oxford University Press,
2004
3. Murkin JM, Newman SP, Stump DA, Blumenthal JA: Statement of consensus on assessment of neurobehavioral outcomes after cardiac surgery. Ann Thorac Surg 1995; 59:1289–95 4. Funder KS, Steinmetz J, Rasmussen LS: Methodological
issues of postoperative cognitive dysfunction research. Semin Cardiothorac Vasc Anesth 2010; 14:119–22
5. Rudolph JL, Schreiber KA, Culley DJ, Mcglinchey RE, Crosby g, Levitsky S, Marcantonio ER: Measurement of post-opera
-tive cogni-tive dysfunction after cardiac surgery: A systematic review. Acta Anaesthesiol Scand 2010; 54:663–77