Carchen, Alessandro and Shi, Weichao and Sasaki, Noriyuki and Atlar,
Mehmet (2016) A prediction program of manoeuvrability for a ship with a
gate rudder system. In: 2nd International Meeting - Recent Advances in
Prediction Techniques for Safe Manoeuvring of Ships and Submarines.
Istanbul Technical University, Istanbul. ,
This version is available at https://strathprints.strath.ac.uk/64287/
Strathprints is designed to allow users to access the research output of the University of Strathclyde. Unless otherwise explicitly stated on the manuscript, Copyright © and Moral Rights for the papers on this site are retained by the individual authors and/or other copyright owners. Please check the manuscript for details of any other licences that may have been applied. You may not engage in further distribution of the material for any profitmaking activities or any commercial gain. You may freely distribute both the url (https://strathprints.strath.ac.uk/) and the content of this paper for research or private study, educational, or not-for-profit purposes without prior permission or charge.
Any correspondence concerning this service should be sent to the Strathprints administrator: [email protected]
The Strathprints institutional repository (https://strathprints.strath.ac.uk) is a digital archive of University of Strathclyde research outputs. It has been developed to disseminate open access research outputs, expose data about those outputs, and enable the
A. Yücel Odabaşı Colloquium Series - 2nd International Meeting on
Recent Advances in Prediction Techniques for Safe Manoeuvring of Ships and Submarines
17 – 18 November 2016, Istanbul, Turkey
A prediction program of manoeuvrability for a ship with a Gate Rudder
system
Alessandro Carchen
1, Weichao Shi
1, Noriyuki Sasaki
1, Mehmet Atlar
21School of Marine Science and Technology, Newcastle University, Newcastle Upon Tyne, UK 2Department of Naval Architecture, Ocean & Marine Engineering, Strathclyde University, UK
Abstract:The Gate Rudder is a special twin rudder system with two rudder blades placed aside of a propeller. Main
advantage of this system is the energy saving originated from the rudder thrust which is induced by the two cambered rudder blades comparably efficient to ducted propellers. However, as any rudder’s prime task, the performance of ma-noeuvrability is critical to the Gate Rudder too. With the currently available Manoeuvring Modelling Group (MMG) simulation programs, the simulation is only applicable to the traditional single rudder located behind the propeller. There-fore, how to predict the manoeuvring performance for the gate rudder is the focus of this paper.
On the other hand, a recent study of the Gate Rudder reveals that this innovative system has remarkable flap effect which is well known as a manoeuvring interaction between rudder blades and ship stern. This phenomenon has been observed in the case of conventional rudder and introduced into an MMG-based theoretical model as interaction factor aH. How-ever, the average values of aH for conventional rudder is between 0.1-0.2 in general whilst the aH value for the Gate Rudder is more than twice as much, showing a superior course keeping ability of the Gate Rudder.
The paper presents the manoeuvrability simulation method of a ship with this Gate Rudder system and introduces some examples of comparisons between the model tests and free running tests which was conducted with 2.5 m ship model in the manoeuvring tank at Kyushu University, Japan.
Keywords: Gate Rudder, course keeping ability, flap effect, MMG model, CFD simulation
1 INTRODUCTION
1.1 Gate Rudder concept application
[image:2.595.302.540.580.744.2]The demand for improvements in ship energy efficiency is still a paramount in mitigating CO2 emissions from ship-ping in spite of low fuel oil price. Consequently, substantial amount of Energy Saving Devices (ESDs) have been pro-posed, but so far only cost-effective proposals could sur-vive. In this paper a new ESD, known as “Gate Rudder”, will be introduced as applied on a 499 tonnes domestic cargo ship.
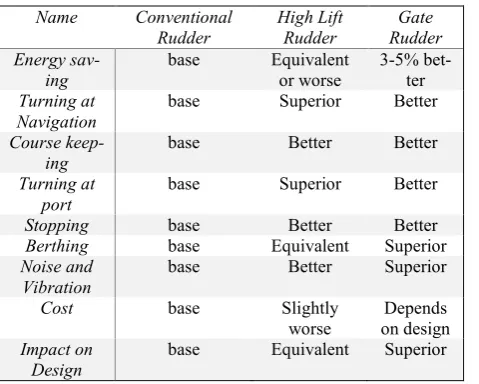
Table 1. Pros and Cons of Gate Rudder
The Gate Rudder concept originated from twin rudder sys-tems located aside a propeller. By replacing the conven-tional rudder by this novel system, many advantages can be gained as shown in Table 1.
Whereas the studies on the propulsive performance of Gate Rudder have been already presented, e.g. Sasaki et al (2015), Turkmen et al (2015), the manoeuvring perfor-mance of the gate rudder including a theoretical analysis has not been deeply investigated.
Table 2. Steering Modes of Gate Rudder
Name Conventional
Rudder High Lift Rudder Rudder Gate Energy
sav-ing base Equivalent or worse 3-5% bet-ter
Turning at
Navigation base Superior Better
Course
keep-ing base Better Better Turning at
port base Superior Better
Stopping base Better Better
Berthing base Equivalent Superior
Noise and
Vibration base Better Superior
Cost base Slightly
worse on design Depends
Impact on
Design base Equivalent Superior
Name Functions Rudder angle
Economy mode The most efficient operation at calm
sea condition
+ 3 ~ + 5 deg.
Rough sea mode The propeller speed can be increased by accelerated flow
+ 0 ~ + 2 deg.
Steering mode Normal steering
(change the course) -10 & +10dg. Example
Circle mode Emergency steering
(circle motion) -30 & +35 deg.
Crash Stop mode Emergency steering
(crash stop) -30 & -30 deg.
Crabbing mode Berthing &
[image:2.595.58.298.582.774.2]This paper therefore focuses on the manoeuvrability pre-diction method for the Gate Rudders. The program was es-tablished by modifying the hydrodynamic forces of propel-ler and rudder, considering the interaction as explained in the following sections.
The unique manoeuvring modes of the Gate Rudder de-scribed in The Gate Rudder concept originated from twin rudder systems located aside a propeller. By replacing the conventional rudder by this novel system, many ad-vantages can be gained as shown in Table 1.
Whereas the studies on the propulsive performance of Gate Rudder have been already presented, e.g. Sasaki et al (2015), Turkmen et al (2015), the manoeuvring perfor-mance of the gate rudder including a theoretical analysis has not been deeply investigated.
[image:3.595.335.487.371.516.2]Table 2 show superior manoeuvrability with various modes to operate the vessel. Each of the twin rudder blades can be helmed from forward to afterward. The most efficient rud-der mode will be crabbing mode which can be seen in Fig-ure 1 (bottom right). This mode promises strong side forces aiding the ship berthing. Table 3 shows an overview of the research programs related to the manoeuvrability investi-gation of the Gate Rudder.
[image:3.595.58.290.381.503.2]Figure 1. Steering Modes of Gate Rudder
Table 3. Research on manoeuvrability of Gate Rudder
Name Contents Facility etc.
Tank Tests Rudder Force Measurements with 6m Large Ship Model
(without yaw angle) Hull Force Measurements
with 2 m Ship Model Captive Tests and Free
Run-ning Tests with 2.5m Ship Model
NMRI FEL Kyushu Uni.
Simulation Development of Simulation Program based on MMG
model Rudder Control System
Newcastle Uni. & Ka-mome Pro-peller Tokyo Keiki
Full Scale
Tests Maneuvering Tests at Sea Trial Monitoring at After Delivery
Yamanaka Ship Yards Newcastle
Uni.
1.2 The MMG standard prediction method
The MMG standard prediction method is a nonlinear ship manoeuvring mathematical model based on the concept de-veloped by the Japanese Manoeuvring Modelling Group (Ogawa et al., 1977) and later unified by the Japan Society of Naval Architects and Marine Engineers (Report of Research committee on standardization of mathematical model for ship maneuvering predictions, 2013). The stand-ard is composed by four parts, namely:
Mathematical manoeuvrability model
Procedure to conduct the required captive model tests
Procedure to analyse the model tests
Full-scale manoeuvrability prediction method Whilst details of the latter three parts can be found in Ogawa et al. (1977) and in the Report of Research committee on standardization of mathematical model for ship maneuvering predictions (2013), recalling the funda-mentals of the first fits within the scope of this work. The reference coordinate system adopted by the MMG is introduced as reported in (Yasukawa and Yoshimura, 2015):
Figure 2. Reference coordinate system (Yasukawa and Yoshimura, 2015)
Where and lay on the still water surface, coincides with the midship point, and are the components of the ship velocity along the ship axis, is the yaw rate and , , the drift, rudder and heading angles respec-tively. According to the model, the acting forces are subdi-vided by reason of their source:
= + +
= + = +
where subscript H, P and R refer to Hull, Propeller and Rudder, respectively.
Hull forces are addressed as functions of the velocity of the vessel, its drift angle and yaw rate with uncoupled and coupled terms up to the third order:
[image:3.595.60.290.562.751.2]The relationships with these variables depend on the geom-etry of the vessel and it’s therefore recommended to carry out captive model tests to obtain the manoeuvrability de-rivatives. Where this is not possible, statistical regressions may be used for common hull forms such as in (Yamaguchi et al., 2009).
Propeller forces are considered in the longitudinal direction only. The usual representation for the propeller character-istics is used to calculate the propeller thrust keeping into account the change in wake fraction and thrust due to the manoeuvring motion. The function = ( ) is represented by a second order polynomial.
The hydrodynamic rudder forces are presented as sum of two fundamental components, namely the lift force acting on the rudder itself and the lift force induced on the hull caused by the so-called flap effect, i.e. the interaction be-tween rudder and hull.
= −(1 − ) sin = −(1 − ) cos
= −( + ) cos
where represents the rudder normal force, the change in drag due to rudder-propeller interaction, the magnitude of the flap effect, and respectively the rudder and flap force centroid from mid-ship. The rudder normal is also defined as:
= 0.5 sin
[image:4.595.114.240.454.521.2]With being the rudder projected area, the rudder lift coefficient, = + and respectively the in-flow velocity and angle at the rudder, as it can be seen in Figure 3.
Figure 3. Rudder and ship velocities and angles (Yasukawa and Yoshimura, 2015)
It is worth recalling that in the MMG model the definition of the inflow characteristics comes with consideration of the complex flow straightening phenomena related to the hull/propeller slipstream during any manoeuvre.
Owing to the characteristics described above and the lim-ited number of variables, the MMG standard prediction method thus lends itself to be implemented in a manoeu-vrability simulation program.
1.3 Problem definition
Nevertheless, the particular geometry and location of the Gate Rudder, demands additional considerations. A first effect of its uncommon features can be seen in the water flow on the Gate Rudder, due to the closer proximity to the hull and the propeller disc. This also affects the interaction
with the hull during turning manoeuvres, as it will be seen in the following sections. Finally, because of its unique mechanism many steering modes can be explored and the relative helm control thus has to be defined.
2 CFD SIMULATIONS
Commonly, it is acknowledged that the marine rudders are generally positioned behind the propellers at the after end of the marine vessel, whilst the Gate Rudders are set aside the propeller. The Gate Rudder’s conceptual design intends to take advantage of the duct effect to produce additional thrust forces. As mentioned earlier, this greatly compli-cates the flow conditions of the Gate Rudders.
As it has been reviewed in the standard MMG method (Yasukawa and Yoshimura, 2015), the flow velocity for a traditional rudder is basically determined by the effective wake with propeller operating under various heading con-ditions. However, rare experimental or numerical studies have been conducted to investigate the effective wake aside of the propeller, let alone under various heading conditions. Therefore, the first task within this study is to understand and predict the flow velocity distribution for the Gate Rud-ders. In order to perform this task, a simplified full-scale computational fluid dynamics (CFD) model has been es-tablished in this chapter.
2.1 Numerical modelling methodology
The numerical model in this paper is built in the commer-cial CFD software Star-CCM+ to solve the incompressible Reynolds Averaged Navier–Stokes (RANS) equations with Shear Stress Transport (SST) turbulence models. The simulation has been conducted for the target vessel with a full-scale 68m long numerical model. Due to the limita-tions of computational power and for the purpose to achieve a quick prediction of the velocity distribution aside the propeller, the simulations have been conducted without the free surface to neglect its limited impact on the effec-tive wake.
Table 4. CFD simulation conditions
Ship length 68m
Ship speed 12.81 knots Propeller diameter 2.5m
Propeller thrust 96.985 kN Propeller RPS (Constant thrust) 3.5 to 3.8 RPS
Drift angles 0° to 16° (2° intervals) 25° and 35°
condition in order to maintain the required thrust to over-come the vessel’s resistance. The conditions of the CFD simulation are specified in Table 4 and represent an actual operational profile. The layout of the Gate Rudders ar-rangement is presented in Figure 4.
2.2 Mesh generation and boundary condition definition
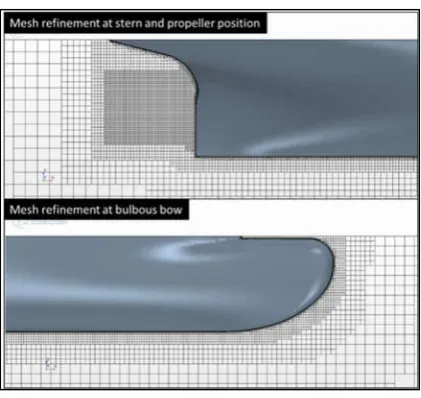
Trimmer mesh generator in Star-CCM+ has been used with prismatic boundary layer mesh control and volumetric mesh control. Mesh overview has been presented in Figure 5. Local mesh refinement has been specified especially in the propeller position and near the bulbous bow as it can be seen Figure 6. In total, 2 million cells have been used in the computational domain.
[image:5.595.317.528.53.252.2]During the simulation, k- Shear Stress Transport (SST) turbulence model has been preferred. Velocity inlet with oblique flow angle and pressure outlet have been applied for the inlet and outlet boundary conditions, while a free-slip wall condition is applied to the bottom boundary.
Figure 4. Positions of virtual disc and Gate Rudders
Figure 5. Mesh overview
Figure 6. Mesh refinement at stern and bow
2.3 Simulation results and analysis
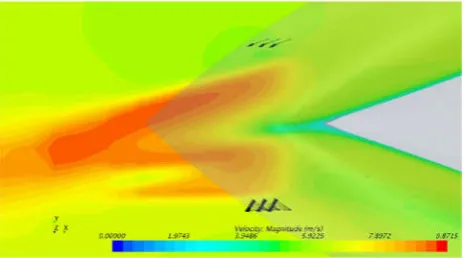
[image:5.595.57.286.314.475.2]Based on the above setup, the flow velocity distribution in the Gate Rudder position can be achieved. As shown in Figure 7, the velocity distribution of the section at the pro-peller position and together with the vector at the Gate Rudder position have been displayed when the oblique (drift) angle is 0o. As it can be seen, the flow is nearly
sym-metric to the mid-ship but not exactly, due to the rotational effect of this right-handed propeller model. It can also be seen in Figure 8 from the top view of the shaft line section. Another example of result has been presented is the case of 16o of drift. The same post analysis has been conducted,
which has been presented in Figure 9 and Figure 10. Be-cause of the oblique flow angle, the velocity distribution is strongly biased, especially for the starboard side.
[image:5.595.58.291.501.661.2]Based on the above results, it was possible to parametrise the flow velocity components in the and directions for each of the two blades and every rudder angle. Using a powerful statistical software, the velocities were expressed as polynomial functions of the drift and rudder angle in or-der to be easily calculated inside the simulation program.
[image:5.595.305.541.551.721.2]Figure 8. Velocity and vector distribution at 0 degree oblique angle (top view)
[image:6.595.59.293.55.188.2]Figure 9. Velocity and vector distribution at 16 degree oblique angle (aft view)
Figure 10. Velocity and vector distribution at 16 degree oblique angle (top view)
3 MANOEUVRABILITY PREDICTION PROGRAM
The manoeuvrability program has been built in Excel en-vironment using VBA to code the MMG prediction model and it aims to simulate the standard ITTC Z-Tests and Cir-cle Test for both conventional and Gate Rudders.
[image:6.595.57.292.223.395.2]The program comprises an Excel user interface for data in-put and outin-put analysis and an integrated VBA code han-dling the iterative solution of the fundamental equations. The first core part of the code is concerned with the deter-mination of the hydrodynamic forces acting on Hull, Pro-peller and Rudder. The second handles the initialization, a Runge-Kutta discretization method and the controls of sim-ulation and virtual ship.
Figure 11. Inflow parameters for the Gate Rudder
3.1 Determination of the hydrodynamic forces
The different hydrodynamic conditions at which the Gate Rudder is subjected had to be initially addressed. Firstly, new parameters were defined to address the inflow compo-nents and the peculiar rudder angles assumed by the Gate Rudder as in Figure 11. For convention, rudder angles closer to the hull (in) are negative, those farther from the hull (out) are positive. In second place, the inflow velocity components need to be determined in order to calculate the inflow angle and, in turn, the rudder force. Whereas for a conventional rudder the velocity components are deter-mined using standard approximation formulas, in this study they could be expressed according to the CFD results as:
= + + + + ⋯ +
= + + + + ⋯ +
Where identifies either the Port ( ) or the Starboard side ( ) blade and is the local drift angle at the rudder de-fined as the algebraic sum of the ship drift angle and that locally induced by the ship’s yaw motion:
= − ℓ ′
With ℓ obtained from the captive model tests and be-ing the ship’s yaw rate (Yasukawa and Yoshimura, 2015). From the above, it is possible to calculate the inflow angle on each blade as:
, = − tan
Therefore, the normal force on each blade can be found:
, = 0.5 ( + ) sin ,
Owing to the wide variation of relative position between rudder blades and hull and the significant consequence on the flap effect, it was seen as necessary to specify different flap effect coefficients depending on whether the blades are closer or farther from the hull. Therefore, ( ) and
( ) were defined, with each blade assuming at every
calculation step the relative value in accordance with its position. The total rudder forces and moments are thus cal-culated as:
= +
= +
[image:6.595.58.291.419.548.2]where:
= −(1 − ) sin = −(1 − ) sin = −(1 − ) cos = −(1 − ) cos
= −( + ) cos
= −( + ) cos
3.2 Manoeuvre and simulation controls
The input data are initialised from the user interface de-pending on whether the rudder mode is set to simulate a conventional or Gate Rudder. As mentioned earlier, the program is built so as to simulate generally 4 zig-zag tests and 2 circle tests; however, in the case of conventional rud-der these are set to the standard ITTC cases, i.e. ±10°, ±20° and ±35°. The required inputs thus pertain:
Hull dimensions and geometric coefficients Hull derivatives and added masses
Propeller dimensions and performance coeffi-cients
Rudder dimensions and coefficients
Gate Rudder initial helm controls for each test and each blade
Ship speed and propeller rate of revolutions Time discretization settings
The hydrodynamic equations are calculated inside a Runge-Kutta loop controlled by the simulation length, time step size and output time set by the user. An integrated au-topilot function controls the ship manoeuvre during the zig-zag tests in accordance with the IMO requirements. Three additional add-ins allow the execution of simple an-imations, the automatic calculations of propeller speed and to obtain the hull derivatives using Kijima’s regression for-mulas (Yamaguchi et al., 2009).
3.3 Simulation settings
The data used in the simulation of the Gate Rudder ma-noeuvrability performance are here reported. The principal ship characteristics are listed in Table 5. In addition:
The Hull derivatives were derived from captive model tests results.
From the same test ℓ = −1, ( )= 0.4,
( )= 0 and = −0.45.
The Gate Rudder lift coefficient was derived from tests in the Emerson Cavitation Tunnel of New-castle University, UK as being = 1.4 . The model speed was set = 0.48 / . Simulation was run with a time step of 0.05 and
an output time of 0.5 for 200 .
The propeller Open Water characteristics were also evaluated in the Emerson Cavitation tunnel and the quadratic equations are:
= −0.25 − 0.4 + 0.343
10 = −0.25 − 0.65 + 0.518 To match the experimental validation settings, the Gate Rudder helm angles listed in Table 6 were used.
4 MANOEUVRING TEST VALIDATION
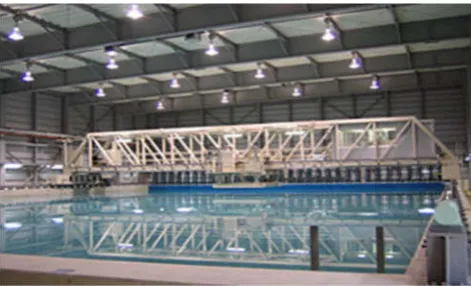
[image:7.595.305.538.258.441.2]To verify the simulation program, captive tests and free running tests were conducted at the manoeuvring and sea-keeping tank of Kyushu University. Pictures of the tank and of the 2.5m wooden model are shown in Figure 12 and Figure 13, respectively. Table 6 shows the test matrix of the manoeuvring tests conducted with the model. Two kind of test were conducted; captive tests and free running tests with the Gate Rudder.
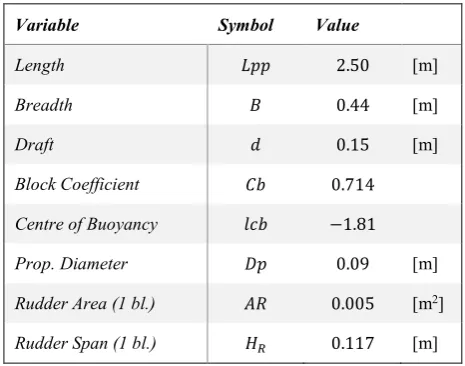
Table 5. Main particulars of the case study ship
Variable Symbol Value
Length 2.50 [m]
Breadth 0.44 [m]
Draft 0.15 [m]
Block Coefficient 0.714
Centre of Buoyancy −1.81
Prop. Diameter 0.09 [m]
Rudder Area (1 bl.) 0.005 [m2]
[image:7.595.307.539.474.615.2]Rudder Span (1 bl.) 0.117 [m]
Table 6. Simulation test matrix
Test Port blade Starboard blade
+10 zig-zag 0 −10
-10 zig-zag 0 10
+20 zig-zag 0 −20
-20 zig-zag 0 20
+35 circle 35 −30
-35 circle −30 35
During the captive tests, the rudder forces of the starboard side rudder were measured simultaneously with the 3 com-ponents of the hull forces. During the free running tests, the ship motion was captured by optical means without touch-ing the ship to allow the purest free motion from the car-riage.
There were two restrictions for free running tests given by the tank length and the measurement instruments. Due to the length of the tank it was not possible to cover the 2nd
steering instruments. As the space was not enough to install two sets of this instrument at the stern (shown in Figure 14), only one side of the Gate Rudder could be controlled. Therefore, some results are predicted by the simulation by superposing the rudder forces which was measured inde-pendently.
Figure 12. Model basin of Kyushu University
Figure 13. 2.5m wooden model
Figure 14. Setup of the manoeuvring test
4.1 Test results and comparison with simulations
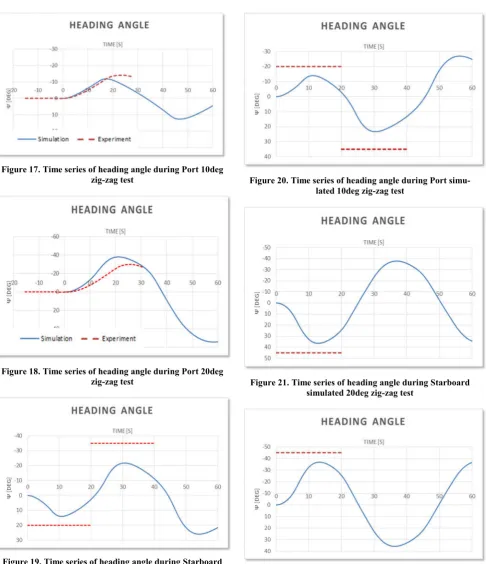
The results from the simulation and the free-running test were compared and they are presented in Figure 15 through Figure 18. The blue line represents the simulated results,
the red dashed line the experimental measurements. Due to the facilities limitations, the Portside rudder blade was fixed on 35deg (Starboard turn) and 30deg (Port turn) whilst the only Starboard blade was remotely controlled. The computation closely agrees with the experimental measurements and captures the trajectory of the vessel dur-ing the manoeuvre, the differences stemmdur-ing mainly from particular experimental limitations that could not be reproduced in the simulation.
[image:8.595.56.298.287.671.2]Figure 15. Starboard 35deg circle test: ship track (a), rudder
angle (b) and ship speed (c) time series Figure 16. Port 35deg circle test ship track (a), rudder angle (b) and ship speed (c) time series Figure 17 and Figure 18 plot the time series of the heading angle during two representative zig-zag manoeuvres, -10 and -20. In this case, the Port rudder blade was locked on 0 deg angle with the only Starboard rudder blade changing position. Considering such limitation in the experimental facility, the simulations and experimental measurments agree within reason, despite the evident of slower response of the vessel to the change in helm angle during the model testing.
[image:9.595.58.545.51.543.2]Figure 17. Time series of heading angle during Port 10deg zig-zag test
[image:10.595.61.548.45.610.2]Figure 18. Time series of heading angle during Port 20deg zig-zag test
Figure 19. Time series of heading angle during Starboard simulated 10deg zig-zag test
Figure 20. Time series of heading angle during Port simu-lated 10deg zig-zag test
Figure 21. Time series of heading angle during Starboard simulated 20deg zig-zag test
Figure 22. Time series of heading angle during Port simu-lated 20deg zig-zag test
5 CONCLUSIONS
Gate Rudders. Based on this analysis, the MMG standard method was tailored in the environment of a simulation program to predict the manoeuvring performance of the Gate Rudder as per the standard ITTC recommended pro-cedures. Finally, Free-running manoeuvring tests were conducted in Kyushu University to validate the program prediction with encouraging results. The project confirmed that the simulation program can simulate fairly well the motions of a vessel equipped with a Gate Rudder and that it can be useful for preliminary manoeuvring performance predictions.
ACKNOWLEDGEMENTS
The Authors would like to thank Kamome Propellers for the support given to the advancement of the Gate Rudder project. They also thank the members of Kyushu Univer-sity for conducting the manoeuvrability tests composing an essential part of this work.
REFERENCES
Sasaki, N. Atlar, M. and Kuribayashi, S. (2015), ‘Ad-vantages of twin rudder system with asymmetric wing section aside propeller’, Journal of Marine Science and Technology, DOI 10.1007/s00773-015-0352-z Turkmen, S., Carchen, A., Sasaki, N. and Atlar, M. (2015),
‘A new energy saving twin rudder system – Gate rud-der’, SCC 2015, Intl Conference on Shipping in Chang-ing Climate, Glasgow, 24-26 November
Ogawa, A., T., K. and Kijima, K. (1977) MMG report-I, on the mathematical model of Ship manoeuvring.
Report of Research committee on standardization of mathematical model for ship maneuvering predictions (2013) (P-29). Japan Society of Naval Architects and Ocean Engineers.
Yamaguchi, Y., Furukawa, Y., Mutuo, H. and Kijima, K. (2009) 'Study on prediction method of hydrodynamic derivatives for full ships'.