City, University of London Institutional Repository
Citation
:
Messer, D. J., Henry, L. & Nash, G. (2016). The relation between executivefunctioning, reaction time, naming speed and single word reading in children with typical development and language impairments. British Journal of Educational Psychology, 86(3), pp. 412-428. doi: 10.1111/bjep.12115
This is the accepted version of the paper.
This version of the publication may differ from the final published
version.
Permanent repository link:
http://openaccess.city.ac.uk/14271/Link to published version
:
http://dx.doi.org/10.1111/bjep.12115Copyright and reuse:
City Research Online aims to make research
outputs of City, University of London available to a wider audience.
Copyright and Moral Rights remain with the author(s) and/or copyright
holders. URLs from City Research Online may be freely distributed and
linked to.
City Research Online: http://openaccess.city.ac.uk/ [email protected]
British Journal of Educational Psychology
The relation between executive functioning, reaction time, naming speed
and single word reading in children with typical development and language
impairments
David J. Messer, Lucy A. Henry and Gilly Nash
Abstract
Background. Few investigations have examined the relationship between a comprehensive
range of executive functioning (EF) abilities and reading.
Aims. Our investigation identified components of EF that independently predicted single
word reading, and determined whether their predictive role remained when additional variables were included in the regression analyses. This provided information about the EF processes that are related to reading, and the unity and diversity of EF.
Sample. This consisted of 160 children: 88 were typically developing with no language
difficulties; 72 had language impairments.
Method. The assessments involved decoding, ten measures of EF, reaction time, naming
speed, non-verbal and verbal age-equivalent scores.
Results and conclusions. In the first regression analysis, which only concerned the EF
variables, the following verbal forms of EF had significant relationships with decoding: working memory; fluency; planning; and inhibition. Further regression analyses included additional predictor variables: reaction time; naming speed, and age-equivalent scores. These analyses indicated that most of the EF variables continued to predict decoding even when entered with competitor variables. Furthermore, after the entry of executive functioning variables there were no group differences in decoding (typical versus language difficulties). We discuss the contribution of EF and other variables to reading abilities.
Introduction
These subcomponents include planning/problem-solving, mental flexibility, inhibition, executive-loaded working memory (ELWM), contextual memory and fluency (e.g. Pennington & Ozonoff, 1996; Van der Ven, Kroesbergen, Boom, & Leseman, 2012). Many of these abilities might be involved in decoding (see Christopher et al., 2012), with the possibility of being non-phonological predictors of reading. Identifying predictors of decoding helps in understanding the component abilities that contribute to reading, potentially informing future interventions.
Previous research has indicated significantly lower EF abilities in children with literacy impairments compared to typically developing children, suggesting that EF and reading abilities are associated. For example, Booth, Boyle, and Kelly (2010) in a meta-analysis, noted that areas of EF, including working memory, were impaired. Statistical associations of various sizes have been identified between literacy and updating/working memory in typical children and those with dyslexia (e.g. Arrington, Kulesz, Francis, Fletcher, & Barnes, 2014; Berninger et al., 2010; Booth, Boyle, & Kelly, 2014; Bull, Espy, & Wiebe, 2008; Jerman & Swanson, 2005; van der Sluis, de Jong, & van der Leij, 2007); although, Savage, Lavers, and Pillay (2007) have raised questions about whether working memory makes a unique contribution to literacy (see also Christopher et al., 2012). In addition, although some investigators report relationships between inhibition and reading (Altemeier, Abbott, & Berninger, 2008; Blair & Razza, 2007; Bull et al., 2008), others have failed to identify significant relationships (van der Sluis et al., 2007; Christopher et al., 2012).
variables are related to one another, but not so closely as to represent the same construct. Consequently, the first research question concerned identifying the EF abilities that were significant independent predictors of decoding. The EF abilities that were assessed corresponded closely to those identified by Pennington and Ozonoff (1996): executive-loaded working memory (ELWM); fluency; planning/problem-solving; inhibition; and switching. The EF assessments involved both verbal and non-verbal versions, following Booth et al.’s (2010) recommendation for the inclusion of non-verbal tasks to assess EF when, as in our sample, language difficulties are present. Multiple regression analyses examined the independent contribution of each EF variable to decoding.
A second research question concerned whether EF variables still predicted decoding when other relevant variables were entered into the regression. It is rare for such
‘covariates’ to be included in studies of reading, and this provides important information about the shared variance between EF and other abilities that are related to decoding. If an EF variable does not ‘survive’ the competition and becomes non-significant, this suggests the EF variable shares variance with the competitor. The competitor variables were simple reaction time, naming speed, non-verbal and verbal age-equivalent scores.
A more complex speed of processing ability is naming speed. Since the development of the Rapid Automatized Naming (RAN) task by Denckla and Rudel (1974), a
significant body of research has been concerned with describing the strength of its relationship with literacy and trying to understand the reasons for these relationships (Kirby, Gergiou, Martinussen, & Parrila, 2010; Norton & Wolf, 2012). Naming speed reflects the time taken to name 30-50 items presented on a single page (e.g. digits, letters, object, colours). Many investigations have reported that naming speed predicts literacy abilities (Kirby et al., 2010; but see Christopher et al., 2012), and it appears that the pauses between naming items are the critical predictive aspects of the task (Georgiou, Parrila, & Kirby, 2006; Lervåg & Hulme, 2009). Letter and number RAN tasks usually have the strongest correlations with literacy (Kirby et al., 2010; Messer & Dockrell, 2011), possibly because these tasks involve reading-related stimuli. To minimise potential confounds, our naming speed task involved pictures and colours.
Naming speed involves complex information processing which may have similarities to some EF processes. For example, it has been suggested that naming speed involves working memory processes and this accounts for its relationship with reading (Arnell, Joanisse, Klein, Busseri, & Tannock, 2009). Furthermore, naming speed tasks involve inhibition of the target names as these become pre-potent stimuli. As a result, it was expected that including naming speed in the regressions would result in reduced associations between at least some EF variables and decoding.
Given that the EF assessments involved non-verbal and verbal tasks, non-verbal age-equivalent scores (NVAE) and verbal age-age-equivalent scores (VAE) were included in the regressions to control for general age-related abilities that might underlie EF
children with language impairments. Because decoding involves language related abilities, it was expected that NVAE would have only a small effect on the relation between EF and decoding. In contrast, it was thought that there could be a greater effect of VAE as this might be involved in both EF and decoding abilities.
Our analyses were based in a sample which included both typically developing children and children with language impairments, many of whom are likely to have reading impairments (McArthur et al., 2000; Catts, Fey, Tomblin, & Zhang, 2002; but see Catts, Aldorf, Hogan, & Ellis-Weismer, 2005). The inclusion of the latter group
increases the variance in the data and assists the detection of associations (see
Christopher et al., 2012; Moll, Loff, & Snowling, 2013). Although the sample was not a representative one, the children corresponded to the ability range seem in most UK classrooms. The typical group consisted of children with comparable chronological ages
to the language impaired sample, and those with similar language ages. Thus, a strategy of including virtually all of the children who were assessed was adopted to obtain a sample with increased variance and a large number of participants.
There were two sets of multiple regression analyses. The first addressed the question of which EF variables were significant predictors of decoding. The significant predictors were then included in the second regression analysis, which addressed the question of whether EF variables remained significant predictors of decoding when additional competitor variables were included (RT, naming speed, NVAE and VAE).
Method
Participants
contact with parents/guardians. Every child who completed all relevant assessments was included, except one with intellectual disabilities (BAS-II T-score of 20).
The typical group (n = 88; 28 females; mean age 117 months , S.D. 28) had scaled scores of 8 or higher on four subscales from the CELF-4-UK (Clinical Evaluation of Language Fundamentals-4-UK, Semel, Wiig, & Secord, 2006; mean = 10 and SD = 3): Recalling Sentences; Formulated Sentences; Word Receptive; and Word Classes-Expressive) and all had non-verbal abilities in the average range (T-scores of 40 or greater on BAS-II). There also were 72 children with language impairments. Thirty-one of these children had less severe language impairments (7 females; mean age 126 months,
S.D. = 27) with scores of 7 or below on 1 or 2 subscales of the CELF-4-UK. Twenty-two of these 31 children had T-scores in the typical range on the non-verbal subscale of the British Abilities Scales-II (BAS-II; >39; Elliott, Smith & McCullough, 1996; mean = 50 and SD = 10). There were 41 children with more severe language impairments and who met the criteria for specific language impairment (13 females; mean age 138 months, S.D.
= 16) who had scores below 8 on at least three of four subscales of the CELF-4-UK and had non-verbal abilities in the average range (T-scores of 40 or greater on BAS-II).
The mean standardised score for decoding based on the Test of Word Reading
This project had ethical approval from the relevant University Ethics Committee. Written informed consent was obtained from parents/guardians (telephone permission occasionally), and from children. Testing involved 3-8 sessions, taking about 3½ hours in total, usually conducted at school, but occasionally at the participant’s home. The tests were presented in the same order for all children, except when the assessor thought a different order would help the motivation and engagement of a child.
Tools and Materials
Assessment of Language, Verbal and Non-Verbal Age Equivalence and
Decoding. The standardised assessments consisted of four subtests from the CELF-4-UK
(see above). Also administered were four subtests from the British Ability Scales (BAS-II, Elliott, Smith, & McCullough, 1996), namely Word Definitions, Verbal Similarities, Matrices and Quantitative Reasoning; verbal age-equivalent scores of scaled abilities in months (VAE) were based on the first two assessments and non-verbal age-equivalent scores of scaled abilities in months (NVAE) were based on the second two assessments. Decoding was assessed by the ‘A’ version of the TOWRE containing both real word decoding (sight word efficiency) and non-word decoding (phonemic word efficiency).
Reaction Time. The Cambridge Neuropsychological Test Automated Battery Motor
Screening Test (CANTAB; Cambridge Cognition, 2006; see Gau & Shang, 2010) was used to obtain simple reaction time. The children were told that a series of crosses would appear in different locations on the computer and their task was to touch them as soon as possible. There were three practice trials and ten test trials. The mean latency of
responses were automatically recorded.
Naming Speed. This was a subtest from the CELF-4-UK. Item 1 comprised of
as quickly as possible. Item 2 comprised of thirty-six shapes (triangles, squares, stars and circles) with no colours and the task was to name these as quickly as possible. No
repetitions of test items were allowed and there was no discontinue rule. The time taken and errors were recorded. The variable used in analyses was the average time taken to name the two sets of stimuli.
EF Assessments. Where possible, pairs of simple standardised tasks that assessed
the verbal and non-verbal executive skills in each domain were selected, a new tasks were developed for inhibition.
Executive-loaded working memory (ELWM). The verbal task was Listening Recall (Working Memory Test Battery for Children, WMTB-C, Pickering & Gathercole, 2001). The Experimenter read out a series of short sentences and the child judged whether each was true or not. Then the child was asked to remember the final word from each sentence in correct serial order. Trials commenced with list lengths of one item, and proceeded to longer lists, with six trials per list length, until 4/6 trials were incorrect. Scores were based on total trials correct, as recommended by Ferguson, Bowey, and Tilley (2002). Test-retest reliabilities are .38-.83 for the relevant ages (Pickering & Gathercole, 2001).
The non-verbal ELWM task was the odd-one-out test (Henry, 2001). The
Experimenter displayed three cards depicting simple nonsense diagrams (horizontally orientated on 20 x 4cm cards). The child pointed to the ‘odd-one-out’. The spatial location of each odd-one-out card was then recalled via a set of response sheets
Fluency.The Verbal Fluency scale of the Delis-Kaplan Executive Functioning System (D-KEFS, Delis, Kaplan, & Kramer, 2001) involves generating as many words as possible in one minute. The ‘category fluency’ task required the participant to generate items in two semantic categories, ‘animals’ and ‘boy’s names’. The ‘letter fluency’ component of this task was omitted from the analyses as performance on this task contains elements of decoding (de Jong, 2011).
Non-verbal fluency (Design Fluency, D-KEFS) involved a response booklet containing patterns of dots in boxes. The participant had one minute to draw as many different designs as possible, each in a different box. The participant was asked to
connect the dots using four straight lines (no lines could be drawn in isolation). Condition 1 contained only filled dots; Condition 2 contained filled and empty dots and the child connected only empty dots. Design fluency was the average raw score from these two conditions. Test-retest reliabilities: letter (.67); category (.70); filled dots (.66); empty dots (.43) (Delis et al., 2001).
Planning.The Sorting Test (D-KEFS) was used to assess planning. Participants sorted sets of 6 cards into two groups of three, in as many ways as they could. For the verbal task, there were three correct sorts (e.g. transport/animals; things that fly/things that move along the ground; etc.); for the ‘perceptual’ task there were five correct sorts (e.g. small/large; straight/curved edges; etc.). The total numbers of correct
verbal/perceptual sorts were used as the measures of verbal/non-verbal planning (test-retest reliability .49, Delis et al., 2001).
Inhibition.A new test was developed, “Verbal Inhibition, Motor Inhibition” (VIMI).
‘doll’ or ‘car’ and the participant was asked to repeat the same word. Next, in block 2, the child was asked to say the opposite word: ‘if I say doll, you say car’. This was followed by a second ‘copy’ block and a second ‘inhibit’ block. Each of the four blocks consisted of 20 trials. This entire sequence of copy/inhibit blocks was repeated in Part B, with new stimuli (‘bus’ and ‘drum’).
The non-verbal motor task followed the same format, but words were replaced with hand actions. For Part A, the stimuli were a pointed finger versus a fist; for Part B the stimuli were a flat horizontal hand versus a flat vertical hand. The combined number of errors made across Parts A and B on each task was used as the measure of inhibition. Cronbach’s alpha, based on total error scores from Parts A and B was .72 for the verbal task and .92 for the non-verbal task.
The non-verbal switching test, Intra/Extra Dimensional Shift, was from a
computer presented battery (CANTAB). This involved rule acquisition and reversal. Two simple coloured stimuli were presented on a computer screen, and by touching one, children learnt from feedback which was ‘correct’. The children followed this rule in a number of trials. Later, the second dimension, an irrelevant white line was introduced adjacent to the coloured shape, but subsequently overlaying it. At this stage, children had to maintain the same response to solve the problem. In later trials, the complex stimuli changed and the children had to switch attention to the previously irrelevant dimension, to give the ‘correct’ response. Total error scores were used as the dependent measure (test-retest reliability .40, Cambridge Cognition, 2006).
Data Screening
Table 1 gives details of the children’s performance and further details can be found in Authors name withheld (2012). Previous analyses on this sample have shown that after controlling for age and non-verbal IQ there were significant differences between the group with more severe language impairment and the typical group in verbal and non-verbal ELWM, non-verbal and non-non-verbal fluency, non-non-verbal inhibition, and non-non-verbal planning. Furthermore, the children in the two language-impaired subgroups showed a similar pattern of EF performance.
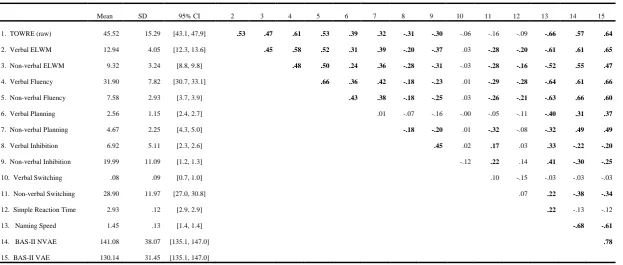
Bivariate correlations were calculated between all the variables used in the analyses (see Table 1). The inter-correlations between the EF measures were mostly moderate and significant, the lowest correlations were between verbal switching and the other EF variables. This suggested that collinearity was unlikely to be a problem with these data.
For all variables, checks were made on skewness and kurtosis. In several instances, transformations provided more suitable distributions: log transformations to simple reaction time, RAN and non-verbal inhibition; and square root transformations to design fluency and verbal inhibition. Some outliers were identified, therefore, further statistical checks were carried out in relation to the regression analyses (Durbin-Watson,
tolerance/VIF statistics, Cook’s/Mahalanobis distances, and standardised DFbetas). These checks identified one potentially influential case according to Mahalanobis
distance for the first regression analysis, this participant was removed to give a sample of 159 children (Field, 2009).
Results
The Prediction of Decoding from Executive Functioning
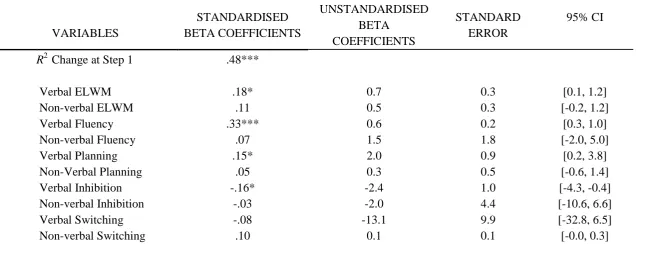
The 10 EF variables were simultaneously entered into a hierarchical multiple regression analysis with the raw TOWRE score as the dependent variable. There was a significant change in the R2 value (.51; p < .001) reflecting the entry of the EF variables. Four verbal forms of EF (ELWM, fluency, planning and inhibition) were significant independent predictors of decoding (see Table 2).
Table 2 about here
The Prediction of Decoding from EF, Processing Speed, and Age Equivalence
these EF variables accounted for most of the shared variance between EF and decoding (see Table 3).
Table 3 about here
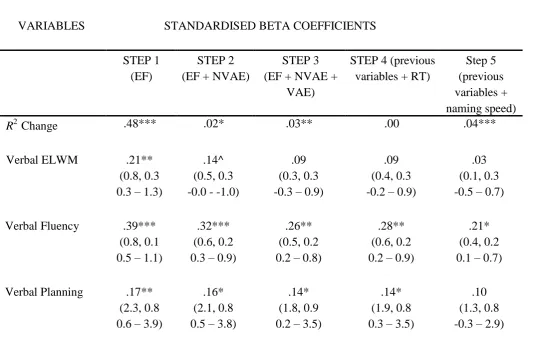
NVAE and VAE were entered next (i.e. at Steps 2 and 3: see Table 3). This provided information about the way age equivalence affected the standardised beta coefficients of the EF variables. At Step 2, NVAE was a significant predictor of
decoding, but it only had an appreciable effect on the beta coefficient for ELWM, which was reduced to a marginally significant predictor. At Step 3, VAE was a significant predictor, and its entry made ELWM and NVAE non-significant predictors. Thus, verbal fluency, verbal planning and verbal inhibition all survived competition from age
equivalence variables, and the analysis indicated that VAE shared variance with ELWM and NVAE. The entry of RT at Step 4 did not result in a significant R2 change. In contrast, naming speed when entered at step 5 was a significant and important predictor, and the beta coefficients of some other variables were reduced, most notably the EF variables.
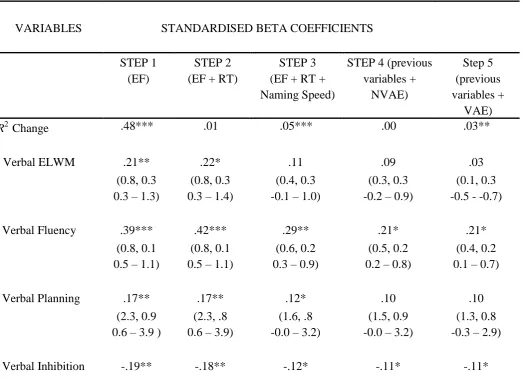
the beta coefficients of the EF variables: verbal fluency and verbal inhibition remained as significant predictors, with verbal planning becoming a non-significant predictor. The entry of VAE also resulted in NVAE becoming a non-significant predictor of decoding. A further regression analysis was conducted to check whether, in the absence of the verbal EF variables, the five non-verbal EF variables predicted decoding, none of the variables were significant predictors.
Table 4 about here
In both competitor analyses, ELWM was not a significant predictor in the presence of naming speed and VAE. ELWM is highly related to IQ and general ability (Friedman, Miyake, Corley, Young & DeFries, 2006; Gathercole & Pickering, 2000). Further
analysis indicated that there was a significant correlation between verbal ELWM and NVAE and also with VAE (r(159) = .61, p < .001; r(159) = .65, p < .001). There also was a significant correlation between verbal ELWM and naming speed (r(159) = -.61, p < .001). This suggests that ELWM became a non-significant predictor because of shared variance with variables assessing general ability and naming speed.
responsible for the significant difference at Step 1 (standardised beta coefficient = .05; standard error = 1.9; 95% CI [-2.3, 5.2]).
To check whether there might be group differences in the prediction of decoding, separate bivariate correlations were conducted between the verbal EF variables and decoding. There was only one instance when the difference between the correlations (r) of the three groups was > .3, and this involved verbal fluency, the specific language impairment group had a lower non-significant correlation (r = .27) with decoding than the other two groups.
Discussion
The purpose of this study was to investigate the role of different forms of EF ability in predicting decoding. Relationships between EF and decoding were first examined alone, and then in the presence of relevant ‘competitor’ variables. In the first regression analysis that did not include competitor variables, four verbal EF tasks (ELWM, fluency, planning and inhibition) were significant predictors of decoding. In the regression analysis that included competitor variables (VAE, NVAE, RT, naming speed), two of the EF variables, namely verbal fluency and verbal inhibition, remained significant predictors of decoding, with VAE and naming speed also making significant contributions to the regression model. The only EF domain that was not a significant predictor of decoding was switching: this variable has failed to be a significant predictor of important cognitive processes in other investigations (e.g. Henry et al., 2012).
impairment) in the analyses, it only was significantly related to decoding when it was entered at Step 1. Group was no longer a significant predictor of decoding when entered after the four EF variables, indicating that removing the variance associated with EF variables resulted in there no longer being a significant different between the groups in decoding. This suggests that EF abilities could be responsible for the differences in decoding found at step 1.
Our findings concerning EF variables and decoding are relevant to current discussions of ‘unity and diversity’ in relation to the structure of EF (Miyake &
Friedman, 2012). In our analyses, the bivariate correlations showed that most of the EF variables were significantly correlated with one another, indicating unity. Nevertheless, the regression analyses showed that EF variables had significant, independent relations with another variable (decoding), indicating diversity, and providing additional support for the unity and diversity model.
Of the EF variables, verbal fluency was the best predictor of decoding (taking into consideration beta values and the second regression analysis with competitor variables). This may be because both verbal fluency and decoding involve lexical search and retrieval of representations in long-term memory (Lervåg & Hulme, 2009; Seidenberg, 2007). Support for this suggestion was provided by the large decrement in the beta-coefficient for verbal fluency when naming speed (i.e. lexical retrieval) was entered into the regression, suggesting shared variance between verbal fluency and naming speed. However, despite this decrement, verbal fluency remained a significant independent predictor of decoding. This could be because an important component of fluency was the organisation of lexical searches, whereas the naming task involved only the retrieval of identified items. Hence, the ‘EF’ aspects of verbal fluency, which are relevant to
Our analyses also indicated that verbal inhibition was a key predictor of decoding; furthermore, it shared relatively little variance with the other competitor variables. Inhibition processes, especially response inhibition, may contribute to decoding abilities because they ensure a written word is fully processed rather than guessed ‘too early’ on the basis of either incomplete information and/or a tendency to produce a pre-potent response (Arrington et al., 2014; Booth et al., 2014; Diamond, 2013). In contrast to our findings, Christopher et al. (2012) failed to detect significant relations between inhibition and decoding. This discrepancy may be due to methodological differences. Christopher et al. used several tasks involving ‘the ability to remove outdated information and ignore irrelevant extraneous information to help maintain current goals’ (i.e. attentional
inhibition); whereas, our EF measures assessed the inhibition of pre-potent responses. Thus, the current findings suggest that the inhibition of pre-potent responses may be a better predictor of decoding than attentional inhibition, and this conclusion is consistent with several studies (Arrington et al., 2014; Bull et al., 2008; van der Sluis et al., 2007).
The findings in relation to verbal ELWM were more complex than for the other EF variables. The first regression analysis indicated that verbal ELWM was a significant predictor of decoding, This is consistent with previous findings (Booth et al., 2010; 2014; Christopher et al., 2012; Arrington et al., 2014), and could be because of the need to temporarily store information, while simultaneously processing other information when reading. However, ELWM did not remain a significant predictor after the entry of VAE or naming speed (Tables 3 and 4). One explanation for this is that ELWM and IQ are closely related (Coloma et al., 2004), although these abilities may involve independent predictive components (Alloway & Alloway, 2010). This explanation is consistent with the high correlations between verbal ELWM and both age equivalence variables. Furthermore, Arnell et al. (2009) have argued that ELWM processes may be partly responsible for significant relationships between RAN and reading, and our findings are consistent with this claim. Shared variance between ELWM, naming speed and age-equivalent scores provides an explanation of some of the discrepancies in previous investigations. For example, although ELWM is often poor in children with dyslexia and SLI (Booth et al., 2010), and significant relationships have been reported between
ELWM and reading (see above), questions have been raised about the relations between ELWM and reading (Savage, Cornish, Manly, & Hollis, 2006). Our findings indicate that the identification of such relations are likely to be affected by the control variables that are included in the analyses, given the shared variance between verbal ELWM, naming speed and VMA.
from VAE (and NVAE). Furthermore, verbal planning was a significant predictor of decoding after inclusion of VAE and NVAE (but was not in the presence of naming speed). These findings indicate that after taking account of verbal ability, three verbal EF tasks continued significantly to predict decoding. We suggest that this is because these tasks assess higher-level abilities involved in the processing of complex verbal material, and that as a result, they continue to predict decoding because these higher-level abilities were statistically independent of children’s verbal ability (largely based on vocabulary and grammar).
Another feature of the findings concerned the prediction of decoding from
information processing variables. Contrary to some predictions (e.g. Kail et al., 1999) our simple RT variable was not a significant predictor of decoding, nor did it share variance with EF variables or even with naming speed. In contrast, naming speed was an important predictor of decoding. Wolf and Bowers (1999), and more recently Norton and Wolf (2013), have argued that naming speed tasks contain many of the specific cognitive operations involved in reading, with serial processing of visual items and the retrieval of phonological information from long-term memory likely to be particularly salient (Kirby et al., 2010; but see Christopher et al., 2012). Our findings support the argument of Wolf and her colleagues, and, as already discussed, it is possible to see naming speed as a type of complex EF task.
Lastly, a potential limitation of the study is that the dependent variable (TOWRE) required decoding to take place in a fixed time-period, possibly favouring the detection of relations between speed of information processing and decoding. However, it also is the case that the TOWRE has high and significant associations with other non-timed
variables in the competitor analyses controlled for such effects. A better understanding of the relationships between variables could be obtained from structural equation
modelling, however, the sample size and number of variables meant this analysis was not feasible. There also needs to be caution about interpretation of group characteristics as the selection criteria for children in the language impaired group relied on school reports of co-morbid disabilities, and it is possible that some children had other disabilities that were not identified.
To summarise, regression analyses identified several verbal forms of EF (ELWM, fluency, inhibition, planning) that were significant independent predictors of decoding. Further analyses, which included competitor variables, indicated that some verbal EF variables continued to be significant predictors of decoding (fluency, inhibition). Thus, EF abilities appear to share cognitive abilities with decoding and/or contribute to the development of decoding abilities. These findings provide a new understanding of the role of non-phonological cognitive processes in decoding. They also contribute
References
Alloway, T. P., & Alloway, R. G. (2010). Investigating the predictive roles of working memory and IQ in academic attainment. Journal of Experimental Child Psychology, 106, 20-29.
Altemeier, L., Abbott, R., & Berninger, V. (2008). Executive functions for reading and writing in typical literacy development and dyslexia.Journal of Clinical and Experimental Neuropsychology, 30, 588-606.
Arnell, K. M., Joanisse, M. F., Klein, R. M, Busseri, M. A., & Tannock, R. (2009). Decomposing the relation between Rapid Automatized Naming (RAN) and reading ability. Can J Exp Psychol.63 (3), 173–84.
Arrington, C. N., Kulesz, P. A., Francis, D. J., Fletcher, J. M., & Barnes, M.A. (2014) The contribution of attentional control and working memory to reading comprehension and decoding. Scientific Studies of Reading, 18, 325-346.
Baddeley, A.D. (2007). Working memory, thought and action. Oxford, England: Oxford University Press.
Berninger, V., Abbott, R., Swanson, H. L., Lovitt, D., Trivedi, P., Lin, S., Gould, L., Youngstrom, M., Shimada, S., & Amtmann, D. (2010). Relationship of word- and sentence-level working memory to reading and writing in second, fourth, and sixth grade. Language, Speech, and Hearing Services in Schools, 41, 179–193.
Blair, C., & Razza, R.P. (2007). Relating Effortful Control, Executive Function, and False Belief Understanding to Emerging Math and Literacy Ability in Kindergarten. Child Development, 78(2), 647– 663.
function: Findings from a meta-analysis. British Journal of Developmental Psychology, 28, 133-176.
Booth, J. N., Boyle, J. M. E., & Kelly, S.W. (2014). The relationship between inhibition and working memory in predicting children’s reading difficulties. Journal of Research in
Reading, 37, 84-101.
Bull, R., Espy, K.A., & Wiebe, S. (2008). Short-Term Memory, Working Memory, and Executive Functioning in Preschoolers: Longitudinal Predictors of Mathematical Achievement at Age 7 Years. Developmental Neuropsychology, 33(3), 205-228.
Cambridge Cognition. (2006). The Cambridge Neuropsychological Test Automated Battery (CANTAB®): Test-Retest Reliability Characteristics. Cambridge, UK: Cambridge Cognition Ltd. doi/10.1111/j.1469-7610.2011.02430.x/full
Catts, H.W., Adlof, S.M., Hogan, T.P., & Ellis-Weismer, S. (2005). SLI and dyslexia: Same or different developmental disorders? Journal of Speech, Language, and Hearing Research, 48, 1378-1396.
Catts, H.W., Fey, M.E., Tomblin, J.B., & Zhang, Z. (2002). A longitudinal investigation of reading outcomes in children with language impairments. Journal of Speech, Language, and Hearing Research, 45, 1142-1157.
Christopher, M. E., Miyake, A., Keenan, J. M., Pennington, B., DeFries, J. C., Wadsworth, S. J., Olson, R. K. (2012). Predicting word reading and comprehension with executive function and speed measures across development: A latent variable analysis. Journal of Experimental Psychology: General. 141(3):470-88.
Coloma, R., Rebolloa, I., Palaciosa, A., Juan-Espinosaa, M., & Kyllonen, P.C. (2004). Working memory is (almost) perfectly predicted by g. Intelligence,32, 277–296.
Delis, D.C., Kaplan, E., & Kramer, J.H. (2001). Delis–Kaplan Executive Function System (D-KEFS). London, UK: The Psychological Corporation Ltd.
doi/10.1111/j.1469-7610.2011.02430.x/full
Denckla, M.B., & Rudel, R. (1974). Rapid “Automatized” Naming of Pictured Objects, Colors, Letters and Numbers by Normal Children. Cortex, 10(2), 186-202.
Diamond, A. (2013). Executive Functions. Annual Review of Psychology, 64, 135–68. doi: 10.1146/annurev-psych-113011-143750
Duncan, J., Eme, H., Williams, P., Johnson R. and Freer, C. (1996). Intelligence and the frontal lobes: The organisation of goal directed behaviour. Cognitive Psychology, 30, 257-303 Elliot, C.D., Smith, P., & McCullough, K. (1996). British Ability Scales (Second Edition). Texas: The Psychological Corporation.
Farrington-Flint, L., Canobi, K.H., Wood, C., & Faulkner, D. (2010). Children's patterns of reasoning about reading and addition concepts. British Journal of Developmental Psychology, 28(2), 427-448
Ferguson, A.N., Bowey, J.A., & Tilley, A. (2002). The association between auditory memory span and speech rate in children from kindergarten to sixth grade. Journal of Experimental Child Psychology, 81, 141-156.
Field, A. P. (2009) Discovering statistics using SPSS, 3rd ed. London, UK: Sage. Friedman, N.P., Miyake, A., Corley, R.P., Young, S.E., & DeFries, J.C. (2006) Not All Executive Functions Are Related to Intelligence. Psychological Science, 17 (2), 172-179 Gau, S-F.,& Shang, C-Y. (2010). Improvement of executive functions in boys with attention deficit hyperactivity disorder: an open-label follow-up study with once-daily atomoxetine.
The International Journal of Neuropsychopharmacology, 13, 243-256.
achievements in the national curriculum at 7 years of age British Journal of Educational Psychology, 70, 177-194
Georgiou, G.K., Parrila, R., & Kirby, J. (2006). Rapid Naming Speed Components and Early Reading Acquisition. Scientific Studies of Reading, 10(2), 199-220.
Henry, L. A. (2001). How does the severity of a learning disability affect working memory performance? Memory, 9, 233-247.
Henry, L.A., Messer, D., & Nash, G. (2012). Executive functioning in children with specific language impairment. Journal of Child Psychology and Psychiatry, 53(1), 37–45.
Jerman, O.H., & Swanson, L. (2005), Working Memory and Reading Disabilities: A Selective Meta-Analysis of the Literature, in Thomas E. Scruggs, Margo A. Mastropieri (eds.).
Cognition and Learning in Diverse Settings (Advances in Learning and Behavioral
Disabilities), 18, 1-31.
Kail, R., Hall, L. K., & Caskey, B. J. (1999). Processing speed, exposure to print, and naming speed. Applied Psycholinguistics, 20, 303–314.
Kirby, J. R., Georgiou, G. K., Martinussen, R., & Parrila, R. (2010). Naming Speed and Reading: From Prediction to Instruction. Reading Research Quarterly, 45(3), 341–362. Lervåg, A., Bråten, I., & Hulme, C. (2009). The cognitive and linguistic foundations of early reading development: A Norwegian latent variable longitudinal study. Developmental Psychology, 45(3), 764-781.
Lervåg, A., & Hulme, C. (2009). Rapid automatized naming (RAN) taps a mechamism that places constraints on the development of early reading fluency. Psychological Science, 20, 1040-1048.
Miller, C.A., Kail, R., Leonard, L.B., and Tomblin, J. B. (2001). Speed of processing in children with specific language impairment. Journal of Speech, Language, and Hearing Research, 44(2), 416-443.
Miyake, A., & Friedman, N.P. (2012). The nature and organization of individual differences in executive functions: Four general conclusions. Current Directions in Psychological Science, 21, 8–14.
McArthur, G. M., Hogben, J. H., Edwards, V. T., Heath, S. M., & Mengler, E. D. (2000). On the 'specifics' of Specific Reading Disability and Specific Language Impairment. Journal of Child Psychology and Psychiatry, 14, 869-874.
Moll, K., Loff, A., Snowling, M.J. (2013). Cognitive endophenotypes of dyslexia. Scientific Studies of Reading, 17, 385-397. Doi: 10.1080/10888438.2012.736439
Norton, E.S., & Wolf, M. (2012). Rapid Automatized Naming (RAN) and Reading Fluency: Implications for Understanding and Treatment of Reading Disabilities. Annual Review of Psychology, 63, 427-452.
Pennington, B. F., & Ozonoff, S. (1996). Executive Functions and Developmental Psychopathology. Journal of Child Psychology & Psychiatry, 37(1), 51-87.
Pickering, S., & Gathercole, S.E. (2001). Working Memory Test Battery for Children (WMTB-C). London, UK: The Psychological Corporation Ltd.
Pimperton, H., & Nation, K. (2014). Poor comprehenders in the classroom: Teacher ratings of behaviour in children with poor reading comprehension and its relationship with individual differences in working memory. Journal of Learning Disabilities, 47, 199-207.
Savage, R., Cornish, K., Manly, T., and Hollis C. (2006). Cognitive processes in children's reading and attention: The role of working memory, divided attention, and response inhibition. British Journal of Psychology, 97(3), 365–385.
Savage, R., Lavers, N., & Pillay, V. (2007). Working Memory and Reading Difficulties: What We Know and What We Don't Know About the Relationship. Educational Psychology
Review, 19(2), 185-221.
Seidenberg, M.S. (2007). Connectionist models of reading. In G. Gaskell (Ed.). Oxford Handbook of Psycholinguistics. Oxford: Oxford University Press.
Semel, E., Wiig, E.H., & Secord, W.A. (2006). Clinical Evaluation of Language
Fundamentals CELF-4 UK (4th Ed.). London, UK: The Psychological Corporation Ltd. Torgesen, J.K., Wagner, R.K., & Rashotte, C.A. (1999). Test of Word Reading Efficiency. Austin, USA: PRO-ED Publishing, Inc.
van der Sluis, S., de Jong, P.F., & van der Leij, A. (2007). Executive functioning in children and its relation with reasoning, reading, and arithmetic. Intelligence, 35, 427–449.
van der Ven, S. H. G., Kroesbergen, E. H., Boom, J., & Leseman, P. P.M. (2012). The development of executive functions and early mathematics: A dynamic relationship.
British Journal of Educational Psychology. 82, 100-119.
Table 1. Means, standard deviations and confidence intervals of the variables used in analyses and their inter-correlations*.
Mean SD 95% CI 2 3 4 5 6 7 8 9 10 11 12 13 14 15 1. TOWRE (raw) 45.52 15.29 [43.1, 47,9] .53 .47 .61 .53 .39 .32 -.31 -.30 -.06 -.16 -.09 -.66 .57 .64
2. Verbal ELWM 12.94 4.05 [12.3, 13.6] .45 .58 .52 .31 .39 -.20 -.37 .03 -.28 -.20 -.61 .61 .65
3. Non-verbal ELWM 9.32 3.24 [8.8, 9.8] .48 .50 .24 .36 -.28 -.31 -.03 -.28 -.16 -.52 .55 .47
4. Verbal Fluency 31.90 7.82 [30.7, 33.1] .66 .36 .42 -.18 -.23 .01 -.29 -.28 -.64 .61 .66
5. Non-verbal Fluency 7.58 2.93 [3.7, 3.9] .43 .38 -.18 -.25 .03 -.26 -.21 -.63 .66 .60
6. Verbal Planning 2.56 1.15 [2.4, 2.7] .01 -.07 -.16 -.00 -.05 -.11 -.40 .31 .37
7. Non-verbal Planning 4.67 2.25 [4.3, 5.0] -.18 -.20 .01 -.32 -.08 -.32 .49 .49
8. Verbal Inhibition 6.92 5.11 [2.3, 2.6] .45 .02 .17 .03 .33 -.22 -.20
9. Non-verbal Inhibition 19.99 11.09 [1.2, 1.3] -.12 .22 .14 .41 -.30 -.25
10. Verbal Switching .08 .09 [0.7, 1.0] .10 -.15 -.03 -.03 -.03 11. Non-verbal Switching 28.90 11.97 [27.0, 30.8] .07 .22 -.38 -.34
12. Simple Reaction Time 2.93 .12 [2.9, 2.9] .22 -.13 -.12 13. Naming Speed 1.45 .13 [1.4, 1.4] -.68 -.61
14. BAS-II NVAE 141.08 38.07 [135.1, 147.0] .78
15. BAS-II VAE 130.14 31.45 [135.1, 147.0]
Table 2. Beta coefficients, standard error and confidence intervals from the hierarchical regression analysis concerned with the prediction of decoding from EF variables.
VARIABLES
STANDARDISED BETA COEFFICIENTS
UNSTANDARDISED BETA
COEFFICIENTS
STANDARD ERROR
95% CI
R2 Change at Step 1 Verbal ELWM
.48***
.18* 0.7 0.3 [0.1, 1.2]
Non-verbal ELWM .11 0.5 0.3 [-0.2, 1.2]
Verbal Fluency .33*** 0.6 0.2 [0.3, 1.0]
Non-verbal Fluency .07 1.5 1.8 [-2.0, 5.0]
Verbal Planning .15* 2.0 0.9 [0.2, 3.8]
Non-Verbal Planning .05 0.3 0.5 [-0.6, 1.4]
Verbal Inhibition -.16* -2.4 1.0 [-4.3, -0.4]
Non-verbal Inhibition -.03 -2.0 4.4 [-10.6, 6.6]
Verbal Switching -.08 -13.1 9.9 [-32.8, 6.5]
Non-verbal Switching .10 0.1 0.1 [-0.0, 0.3]
Table 3. Standardised beta coefficients from the regression analysis of the prediction of decoding from EF variables (step 1), non-verbal age-equivalent scores (step 2) and verbal age-equivalent scores (step 3), simple processing speed (step 4), and naming speed (step 5). Note that Step 1 and Step 5 are included to help with the inspection of the data. Data about unstandardized beta, standard error, lower and upper 95% confidence intervals are given in parentheses.
VARIABLES STANDARDISED BETA COEFFICIENTS
STEP 1 (EF)
STEP 2 (EF + NVAE)
STEP 3 (EF + NVAE +
VAE)
STEP 4 (previous variables + RT)
Step 5 (previous variables + naming speed)
R2 Change .48*** .02* .03** .00 .04***
Verbal ELWM .21** (0.8, 0.3 0.3 – 1.3)
.14^ (0.5, 0.3 -0.0 - -1.0)
.09 (0.3, 0.3 -0.3 – 0.9)
.09 (0.4, 0.3 -0.2 – 0.9)
.03 (0.1, 0.3 -0.5 – 0.7)
Verbal Fluency .39*** (0.8, 0.1 0.5 – 1.1)
.32*** (0.6, 0.2 0.3 – 0.9)
.26** (0.5, 0.2 0.2 – 0.8)
.28** (0.6, 0.2 0.2 – 0.9)
.21* (0.4, 0.2 0.1 – 0.7)
Verbal Planning .17** (2.3, 0.8 0.6 – 3.9)
.16* (2.1, 0.8 0.5 – 3.8)
.14* (1.8, 0.9 0.2 – 3.5)
.14* (1.9, 0.8 0.3 – 3.5)
Verbal Inhibition -.19** (-2.8, 0.9 -4.5 - -1.0)
-.17** (-2.5, 0.9 -4.3 - -0.8)
-.17** (-2.5, 0.9 -4.2 - -0.8)
-.17** (-2.5, 0.9 -4.2 - -0.8)
-.11* (-1.7, 0.9 -3.4 - -0.0)
NVAE .20*
(0.1, 0.0 0.0 – 0.1)
.06 (0.0, 0.0 -0.1 – 0.1)
.05 (0.0, 0.0 -0.1 – 0.1)
.06 (-0.0, 0.0 -0.1 – 0.1)
VAE .28**
(0.1, 0.5 0.4 – 0.2)
.27** (0.1, 0.1 0.0 – 0.2)
.28** (0.1, 0.0 0.5 – 0.2)
RT .07
(8.2, 7.5 -6.6 – 23.1)
-.08 (10.3, 7.2 -4.0 – 24.5)
Naming Speed -.32***
Table 4. Standardised beta coefficients from the regression analysis of the prediction of decoding from EF variables (step 1), simple processing speed (step 2), naming speed (step 3) and non-verbal age-equivalent score (step 4) and verbal age-equivalent score (step 5). Data about unstandardized beta, standard error, lower and upper 95% confidence intervals are given in parentheses.
VARIABLES STANDARDISED BETA COEFFICIENTS
STEP 1 (EF)
STEP 2 (EF + RT)
STEP 3 (EF + RT + Naming Speed)
STEP 4 (previous variables + NVAE) Step 5 (previous variables + VAE)
R2 Change .48*** .01 .05*** .00 .03**
Verbal ELWM .21** .22* .11 .09 .03
(0.8, 0.3 0.3 – 1.3)
(0.8, 0.3 0.3 – 1.4)
(0.4, 0.3 -0.1 – 1.0)
(0.3, 0.3 -0.2 – 0.9)
(0.1, 0.3 -0.5 - -0.7)
Verbal Fluency .39*** .42*** .29** .21* .21*
(0.8, 0.1 0.5 – 1.1)
(0.8, 0.1 0.5 – 1.1)
(0.6, 0.2 0.3 – 0.9)
(0.5, 0.2 0.2 – 0.8)
(0.4, 0.2 0.1 – 0.7)
Verbal Planning .17** .17** .12* .10 .10
(2.3, 0.9 0.6 – 3.9 )
(2.3, .8 0.6 – 3.9)
(1.6, .8 -0.0 – 3.2)
(1.5, 0.9 -0.0 – 3.2)
(1.3, 0.8 -0.3 – 2.9)
(-2.8, .9 -4.5 - -1.0)
(-2.7, .9 -4.5 - -1.0)
(12.9, 7.3 -1.6 – 27.4)
(-1.7, 0.9 -3.5 - -0.0
(-1.7, 0.9 -3.4 - -0.00)
RT .09 .10 .08 .08
(11.5, 7.7 -3.8 – 26.7)
(12.9, 7.3 -1.6 – 27.4
(12.1, 7.4 -2.4 – 26.7)
(10.3, 7.2 -4.0 – 24.5)
Naming Speed -.31*** -.32** -.32***
(-41.1, 9.8 -60.4 - -21.8)
(-37.1, 10.4 -57.7 - -16.6)
(-38.0, 10.2 -58.1 - -17.9)
NVAE .09
(0.0, 0.0 -0.0 – 0.1)
-.06 (-0.0, 0.0 -0.1 – 0.1)
VAE .28**