City, University of London Institutional Repository
Citation
:
Kyriacou, P. A. (2012). Development and in vitro evaluation of an artificial spinal
disc loading cell. 2012 Annual International Conference of the IEEE Engineering in Medicine
and Biology Society (EMBC), pp. 4887-4890. doi: 10.1109/EMBC.2012.6347089
This is the accepted version of the paper.
This version of the publication may differ from the final published
version.
Permanent repository link: http://openaccess.city.ac.uk/11713/
Link to published version
:
http://dx.doi.org/10.1109/EMBC.2012.6347089
Copyright and reuse:
City Research Online aims to make research
outputs of City, University of London available to a wider audience.
Copyright and Moral Rights remain with the author(s) and/or copyright
holders. URLs from City Research Online may be freely distributed and
linked to.
City Research Online:
http://openaccess.city.ac.uk/
[email protected]
Abstract— One of the common diseases for chronic low back pain is Disc Degeneration Disease (DDD). In this disease, spinal intervertebral disc loses its ability to safely handle the mechanical stresses. The knowledge of the in-vivo loading on the spinal disk is of great importance in the understanding of low back pain. In this study a loading cell has been developed utilizing an artificial spinal disc which was loaded with strain gauges and piezoresistive sensors in an effort to investigate the behavior of the sensors during in vitro loading of the disc. The artificial disc with all sensors was loaded in a laboratory environment. The in vitro loading produced reliable and repeatable results and therefore suggesting that such approach might aid in the development of an artificial intelligent disc which will contribute in the better understanding of the in vivo loading of the human spine.
I. INTRODUCTION
Low Back pain is one of the most common reasons for chronic disability and incapacity for work in the western world. The total solution of low back pain requires a multi-disciplinary and holistic study of the biomechanics, kinematics and physical properties of the spine, specifically lumbar spine. In the majority of cases, low back pain normally occurs in the lower region of the spine known as the lumbar region. One of the common diseases for chronic low back pain is Disc Degeneration Disease (DDD). In this disease, spinal intervertebral disc loses its ability to safely handle the mechanical stresses. Moreover, the relationship between DDD and loading of the spine has been well documented [1-3]. Repetitive loading and acute overloading both have been correlated with high incidence of degenerative disease. Therefore, in vivo data on spine loading are vital and essential for the understanding of the
This work was supported in part by the Emerald Technology Transfer Fund, London, UK. P. A. Kyriacou, is Professor with the School of Engineering and Mathematical Sciences, City University London, UK. He is also Associate Dean for Postgraduate studies and Director of the Biomedical Engineering Research Group at the School of Engineering and Mathematical Sciences, City University of London. (corresponding author,
phone: +44-20-70408131; fax: +44-20-70408568; e-mail:
visco-elasticity of the spine which may lead to the optimization of treatment and management of low back pain. Also, such knowledge will facilitate the better and more efficient design of spinal implants such as artificial disc prosthesis and also, will enable the surgeons to optimize their spinal surgical procedures.
The hypothesis underlying this work is the development of intelligent implantable spinal disc prosthesis with the capability of remotely monitoring in vivo spinal loading information. More specifically this paper describes the design and development of a prototype intelligent artificial spinal disc loading cell and processing system, and the presentation of results from the in vitro loading of the spinal disc loading cell.
II.MATERIAL AND METHODS
A commercial artificial spinal disk comprising miniature strain gauges and piezoresistive sensors was used for the development of the loading cell which will be used the in vitro loading investigation. All instrumental developments, both hardware and software, and experimental set-up will be described in this section.
A. Design and development of the load cell
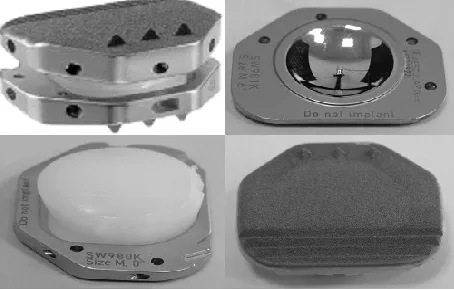
[image:2.612.326.553.538.683.2]A commercial, L4/L5 (Lumbar 4 and 5 vertebrae) Activ-L™ artificial spinal disk prosthesis (Aesculap, B-Braun, Germany), was selected as a base for the development of the load cell (Fig. 1).
Figure 1: B.Braun Spine disc - Active-L spinal disc prosthesis (Top Left),
Upper or Superior end-plate (Top Right), Lower or Inferior end-plate with UHMWPE inlay material (Bottom Left) and Outer side of end-plates with anchor studs and porous titanium & Calcium phosphate layer for enhancing osseous induction process (Bottom Right) (B.Braun Inc., 2010).
Development and
in vitro
evaluation of an artificial spinal disc
loading cell
The artificial disk comprises of mainly three parts (see Fig. 1), the upper or superior end-plate, the lower or inferior plate (both made-up of Cobalt-Chromium alloy) and the inlay material (UHMW Polyethylene). One of the major advantages of using a commercial artificial spinal disc for such investigations is the flexibility it enables in the placement of sensors, such as strain gauges, within the body of the disc, something which will be almost impossible with a human spinal disc.
For this experiments a total of eight strain gauges (Linear Foil Strain Gauges, OMEGA, KFG-02-120-C1-11L3M3R) were placed on both plates of the disc. Four strain gauges were installed on the lower end-plate (strain gauges 0-3) and the other four on the upper end-plate (strain gauges 4-7). Two piezoresistive (FlexiForce®, Tekscan Inc., MA, USA) sensors were also utilized and placed at the top and at the bottom of the inlay material. Further details on this set-up are described by Kyriacou et al. [4].
B. Signal conditioning and data acquisition system
A signal processing and data acquisition system has been developed to process all the signals acquired from all sensors, digitize, display and store them on a computer. All sensor output signals were digitized using an NI CompactDAQ USB Data Acquisition System (National Instruments Corporation, Austin, Texas). The digitized signals were analyzed by a Virtual Instrument (VI)
implemented in LabVIEW® (National Instruments
Corporation, Austin, Texas). This VI read the voltage outputs from all sensors, converted them into a spreadsheet format and saved them into a file specified by the user and displayed the signals in real time on the screen of the computer.
C. In vitro experimental set-up
This section describes the details of the study protocol of the invitro loading of the artificial spinal disc prosthesis load cell. The proposed experimental method satisfies the FDA standard F2346-05 for static and dynamic tests with axial load, shear load and torsion. In this experiment, the compressive loading was applied in the normal direction to the artificial disc (with all sensors embedded) using a computer controlled Universal Testing Machine (Instron, Bucks, UK). The load that was applied to the disc was from 0 to 4 kN, which is the typical natural maximum range of load that the human spinal disc can be exposed [5]. The study protocols (7 experiments) were designed in such a way that the visco-elastic characteristics, i.e. creep and relaxation can also be investigated. In these experiments the applied load was also held constant at certain value for some time and in some protocols the position of the upper movable tool of the UT machine’s position was also maintained for a specified period of time. In these protocols, the loading speed was also variable in order to study the effects of
loading speed on the sensor’s output. A summary of the seven experiments are:
1. Exp1:0-4-0@500NPS&LH300S (Loading range: 0–4–0 kN;
Loading speed: 500 Newton per second; Holding interval: 300 seconds with load holding)
2. Exp2: 0-4-0@500NPS&PH300S (Loading range: 0–4–0 kN;
Loading speed: 500 Newton per second; Holding interval: 300 seconds with position holding
3. Exp3: 0-4-0@500NPS&NOH (Loading range: 0–4–0 kN;
Loading speed: 500 Newton per second; No Holding interval)
4. Exp4: 0-4-0@100NPS&NOH (Loading range: 0–4–0 kN;
Loading speed: 100 Newton per second; No Holding interval)
5. Exp5: 0-4-0@10NPS&NOH (Loading range: 0–4–0 kN; Loading
speed: 10 Newton per second; No Holding interval)
6. Exp6: 0-4-0@step1k@500NPS&LH30S (Loading range: 0–4–0
kN with a step of 1 kN; Loading speed: 500 Newton per second; Holding interval: 30 seconds at each step of 1 kN with load holding)
7. Exp7: 0-4-0@step1k@10NPS&LH30S (Loading range: 0–4–0 kN
with a step of 1 kN; Loading speed: 10 Newton per second; Holding interval: 30 seconds at each step of 1 kN with load holding)
III.RESULTS
In this paper only the results from experiment 1 will be presented and discussed. The graphs in Figure 2 present the outputs from all eight strain gauges (s.gauge 0 to s.gauge 7) and the outputs from the two piezoresistive-Flexiforce® sensors (F.force_upper (place on top of inlay material) and F.force_lower (placed at the bottom of inlay material)) when a compressive load is applied (with respect to time). The last graph depicted in Figure 2 entitled as “Load Vs Time” presents the analog output of the applied compressive load by the universal testing machine. In the graphs, outputs from all strain gauges are presented in Microstrain (Microstrain = strain x 10-6) and outputs from the two Flexiforce® sensors are in analogue dc volt (Y-axis). The time is in seconds (x-axis). The grey color portions in all graphs shows the noisy raw signal and the black line plots are the best fit lines. Similarly in Figure 3, the graphs present the outputs from all eight strain gauges (s.gauge 0 to s.gauge 7) and the outputs from the two piezoresistive-Flexiforce® sensors (F.force_upper and F.force_lower) when a compressive load is applied (with respect to the applied compressive load). The black line plots are the best fit lines of the raw data.
Fig 2: Exp1: 0-4-0@500NPS&LH300S; All eight strain gauge’s outputs, two piezoresistive-Flexiforce® sensor’s outputs and applied compressive load in Newton with respect to time in seconds.
Fig.3: Exp1: 0-4-0@500NPS&LH300S; All eight strain gauge’s outputs and two piezoresistive-Flexiforce® sensor’s outputs with respect to applied compressive load in Newton.
IV.CONCLUSION
A loading cell has been successfully designed and developed comprising of eight strain gauges and two piezoresistive sensors encapsulated inside the body of a commercial artificial spinal disc. In vitro experiments were conducted in order to evaluate the developed technology and also to rigorously investigate the loading behavior of the new loading cell. All in vitro experiments were designed in order to simulate various loading scenarios and were conducted by applying 0-4 kN compressive load in normal directions only. All sensor outputs with respect to the applied compressive load were repeatable, consistent, accurate and more
importantly predictable by fitting into certain regression models with acceptable tolerances. More specifically the graphs of the outputs of strain gauges in Fig.2 and Fig.3 show that all strain gauge’s output show almost identical and repeatable result graphs with adequate tolerances. All sensors were exposed to a ramp-type linear compressive load by the UT machine, however the output from all sensors experienced a non-linear behavior because of the visco-elastic characteristic of artificial disk prosthesis.
[image:4.612.68.553.327.547.2]design with low power requirements. Some of the undesirable characteristic of strain gauges such as sensitivity and susceptibility to noise can be overcome by advance signal processing techniques and better mechanical design of the whole system. Further research experiments are required by changing speed of loading and application of load at, different angles.
REFERENCES
[1] I. A. F. Stokes, J. C. Iatridis, “Mechanical Conditions That Accelerate Intervertebral Disc Degeneration: Overload Versus Immobilization” Spine, 29(23): 2724-2732, 2004
[2] M. Liuke, S. Solovieva, A. Lamminen, K. Luoma, P Leino-Arjas, R Luukkonen and H Riihimäki, “Disc degeneration of the lumbar spine in relation to overweight” International Journal of Obesity, 29, 903– 908, 2005
[3] A. Nachemson, G. Elfstrom, “Intravital dynamic pressure measurements in lumbar discs”, Scand J Rehabil Med, Suppl;S1:1–40, 1970.
[4] P. A. Kyriacou, M. P. Pancholi and J. Yeh, “Investigation of the in-vitro loading on an artificial spinal disk”, J. Phys.: Conf.Ser. 178012023, doi: 10.1088/1742-6596/178/1/012023, Volume 1, 2009. [5] A.A White and M.M. Panjabi: Clinical Biomechanics of
The Spine, 2nd ed., 1990, Lippincott Williams &