City, University of London Institutional Repository
Citation
:
Milojevic, M. and Rakocevic, V. (2013). Short paper: Distributed vehicular traffic congestion detection algorithm for urban environments. IEEE Vehicular NetworkingConference, VNC, pp. 182-185. ISSN 2157-9857
This is the unspecified version of the paper.
This version of the publication may differ from the final published
version.
Permanent repository link: http://openaccess.city.ac.uk/3729/
Link to published version
:
Copyright and reuse:
City Research Online aims to make research
outputs of City, University of London available to a wider audience.
Copyright and Moral Rights remain with the author(s) and/or copyright
holders. URLs from City Research Online may be freely distributed and
linked to.
City Research Online: http://openaccess.city.ac.uk/ [email protected]
Short Paper: Distributed Vehicular Traffic Congestion
Detection Algorithm for Urban Environments
Milos Milojevic and Veselin Rakocevic
City University London
{milos.milojevic.1, v.rakocevic @city.ac.uk}
Abstract— Vehicular traffic congestion is a well-known
economic and social problem generating significant costs and safety challenges, and increasing pollution in the cities. Current intelligent transport systems and vehicular networking technologies rely heavily on the supporting network infrastructure which is still not widely available. This paper contributes towards the development of distributed and cooperative vehicular traffic congestion detection by proposing a new vehicle-to-vehicle (V2V) congestion detection algorithm based on the IEEE 802.11p standard. The new algorithm allows vehicles to be self-aware of the traffic in the street, performing congestion detection based on speed monitoring and cooperation with the surrounding vehicles. Cooperation is achieved using adaptive single-hop broadcasting which depends on the level of congestion. The paper presents the congestion detection algorithm and the cooperative communication in detail, and presents performance evaluation using large-scale simulation in Veins framework based on OMNeT++ network simulator and SUMO vehicular mobility simulator. Results show that precise congestion detection and quantification can be achieved using a significantly decreased number of exchanged packets.
Keywords— traffic congestion detection and management; vehicular ad hoc networks; intelligent transport systems; cooperation; data aggregation;
I. INTRODUCTION AND RELATED WORK
According to the results of the survey provided by the Centre for Economics and Business Research and traffic information company Inrix, the cost of traffic congestion for the UK economy is estimated on more than £4.3bn a year [1]. In addition to the economic costs, traffic congestion also affects the quality of life and the environment, by causing pollution which has well-known negative effects on health and climate. It usually occurs in urban and highway environments when road capacity is smaller than traffic demand.
Managing traffic congestion is currently done via infrastructure based systems such as traffic lights, video cameras and inductive loops, which provide fixed-point information taken at specific location and therefore has limited accuracy. These systems are also expensive to cover large areas. Newly developed 802.11p standard designed specifically for use in vehicular ad hoc networks (VANETs) [2] makes alternative solutions possible by using vehicle to infrastructure (V2I) or vehicle to vehicle (V2V) communication. V2V is the only distributed way of exchanging traffic related information. Two categories of applications are common in VANETs, where first relates to safety and traffic information, and second
assumes infotainment, such as internet access or gaming. They are based on periodical exchange of messages between vehicles containing information about vehicles position, speed, and direction with other data regarding congestions, accidents.
Some well-known problems that exist in other types of mobile ad-hoc networks also exist in VANETs, especially in urban environments where the number of nodes is high and sometimes over the capacity of city streets. As discussed in [3] the broadcast storm problem is common in VANETs especially in traffic jams and might cause packet collisions. Supression techniques such as adaptive broadcasting are used to overcome this problem like in [3]. There is also hidden-terminal [4] and scalability problem in VANETs [5] as well.
Unlike those well-known problems, the traffic congestion detection with VANETs recently became the hot research topic, but the main focus was on the highway scenarios mostly considering V2I communications. One of the first solutions for distributed traffic congestion detection is SOTIS [6], where each vehicle monitors the traffic situation by analyzing the received information from other vehicles about their location, speed, direction, etc. It is simulated only in highway scenario, and it assumed periodic broadcasting of messages. Traffic View [7] is based on dissemination of average speed of vehicles on the road, while each vehicle aggregates received data and keeps records about all the nodes rather than about certain area. This approach assumes broadcasting and was simulated only based on 802.11b standard in highway environment. In [8] authors defined the road as congested only when the probability of finding it in the same state in the near future is high. Their algorithm assumes that each road segment needs to be observed for a day and that vehicles send their traversal times to centralized entity. Additionally, it remains unclear what type of communication vehicles use in order to exchange messages. In [9] authors presented cooperative V2V approach for congestion detection based on fuzzy logic and the use of system for classification of traffic congestion developed by Skycomp, which is based on aerial surveys of different highways. Congestion detection algorithm has been evaluated in highway scenario. Finally, the authors in [10], developed distributed traffic management system based on V2V communications, and evaluated its effectiveness on real traffic scenario. The system is based on gossip based routing where vehicles periodically broadcast the messages containing street section delay as a measure of congestion, and the authors concluded that it can reduce the traffic congestion.
traffic conditions obtained either from third party companies or local authorities is one of them. Also, most papers assume message exchange based on periodic broadcasting which is not suitable in case of traffic jams, and they also consider only highway scenarios. Therefore we propose the algorithm which contributes towards distributed V2V traffic congestion detection in urban environments independent of any additional information and relying on adaptive broadcasting algorithm. It enables each vehicle to determine traffic condition and cooperatively share this information with other vehicles. The result of such approach is reduction of broadcasting nodes while having the information about quantification of traffic congestion available. The rest of the paper is organized as follows: In section II we present the algorithm, while we evaluate it in the section III. Finally we make conclusions and explaining our future steps in section IV.
II. CONGESTION DETECTION ALGORITHM WITH ADAPTIVE
BROADCASTING
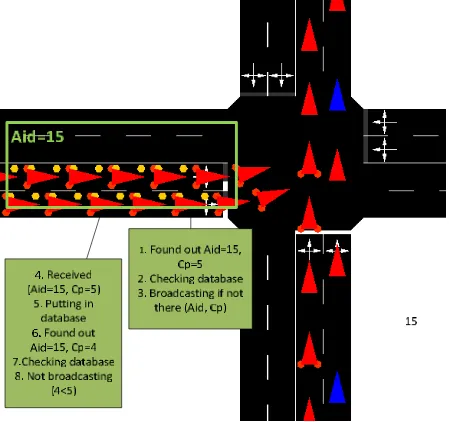
According to the WAVE standard [2] VANET applications are based on periodical broadcasting of Wave Short Messages (WSMs). In case of traffic jams it is important to reduce the number of broadcasting vehicles, and we propose an adaptive broadcasting algorithm based on congestion detection and quantification of congestion in vehicle’s neighborhood. We assume that each vehicle is equipped with a GPS, and that each street section has its own identification Aid which is always
[image:3.595.305.560.301.485.2]known to each vehicle. Also, we assume that vehicles have their own databases where they store messages received from other vehicles, and the typical view of urban traffic jam is shown in Fig.1.
Fig. 1. Traffic jam at intersection.
Most papers suggest that vehicles are exchanging data about their GPS coordinates, speed, direction, traversal time, etc. [10]. Then each of them processes received data to find out where traffic congestion exists. We propose that nodes send two simple parameters: location identification Aid and
congestion parameter Cp, which tells if the vehicle is in
congestion or not. This approach results in shorter processing times at receiving vehicles, since they receive already processed congestion information, which is useful for delay-sensitive safety applications. Traffic congestion is usually defined as the travel time or delay in excess of that normally incurred under light or free-flow travel conditions [11]. In this case vehicle needs to have upfront information about free-flow travel times for the whole environment, for example a city during the day.
Our algorithm consists of five procedures which are done consecutively by each vehicle independently and they are: speed monitoring, congestion detection, localization, aggregation and broadcasting, as shown in Fig. 2.
A. Speed Monitoring
We propose that speed should be the indicator of traffic congestion and the level of congestion should be based according to time intervals when vehicle has certain speed range. We define Vt as the threshold speed, and the moment
when Vc becomes different than Vt is the starting point of
[image:3.595.51.277.408.619.2]congestion detection algorithm.
Fig. 2. Pseudo code for the congestion detection algorithm.
B. Congestion Detection
The outcome of congestion detection process is congestion parameter Cp which has the value based on time interval in
which the current speed is smaller or greater than Vt. Vehicle
needs to spend certain amount of time τphaving this speed and
then congestion parameter is set to one of the six values. The value of Cp is determined by Cp=η∙π, where π can be 0, in case
Vc>Vt, or 1 in case Vc≤Vt. η can have one of the values η={1, 2,
3, 4, 5} depending on τp time interval: η=1 if 10<τp≤20, or η=2 if 20< τp ≤30 or η=3 if 30< τp ≤40, or or η=4 if 40< τp ≤50 or η=5 if 50< τp. The Cp parameter is included in the WSM
message when vehicle is broadcasting. Additionally, we refer to the congestion parameter value from the database as Cd.
C. Localization
Each street section (for example part of the street between two junctions) has unique identification. After node determines
A) Speed Monitoring:
if Vc≠Vt go to B.
B) Congestion Detection:
if Vc<Vt then
(start timer τc, when τc=η∙10s=> Cp=η)
else (start timer τc, when τc=10s=>Cp=0)
C) Localization:
find Aid of the current location, go to D
D) Aggregation:
get Cd(Aid)
if Cp≠0 then
if Cp(Aid) >Cd(Aid) then E, Cd(Aid)=Cp(Aid)
else skip E
else if Cp(Aid) ≠Cd(Aid) then E, Cd(Aid)=Cp(Aid) then E
else skip E
E) Broadcasting:
whether there is congestion or not, it does the localization process, which retrieves the identification of the node’s current location and sets Aid parameter to this value, which is included
in the WSM message together with the Cp parameter. It is also
used to store data received from other vehicles into database.
D. Aggregation
Aggregation process decides if the node will broadcast the message or not, and is responsible for adaptation of broadcast interval according to information that vehicle obtained itself and information received from other vehicles. The decision on whether it should broadcast the message or not, vehicle derives from comparison of Cp and Cd parameters for the same area Aid.
In case Vc <Vt vehicle will broadcast only if Cp>Cd. This means
that vehicle will broadcast the information only in case it detected higher level of congestion than other vehicles for the same area. In case Vc >Vt message is sent only if Cp≠Cd.
E. Broadcasting
Finally, after all previous procedures are finished successfully vehicle might broadcast the message containing
Cp and Aid parameters. This way all nodes who receive this
message will know about traffic situation in Aid area. By
following previously described steps vehicles will cooperate and only some of them will choose to broadcast instead of all of them broadcasting periodically.
III. SIMULATION SETUP AND EVALUATION RESULTS
In order to evaluate the congestion detection mechanism and its impact on vehicular communication we developed simulation environment based on Veins simulation framework [12]. This framework is based on OMNeT++ [13] network simulator bi-directionally coupled with SUMO traffic simulator [14]. Both simulators are well-known and have been used for simulations by many authors, while Veins is capable of simulating full 802.11p standard, which is the main reason for choosing it.
A. Simulation Setup
Evaluation of our algorithm is based on two bi-directionally coupled simulations: network simulation and road traffic simulation. We modelled Manhattan city section in dimensions of 1km x 1km in the SUMO traffic simulator. Five horizontal streets and five vertical are crossed at every 250m, and they have two lanes in each direction. Vehicles can turn right or left, or continue straight at junctions. There are 200 vehicles, grouped in 5 traffic flows, each taking different route in total distance of 2000m, and they are made to intersect certain points in order to simulate high number of vehicles, which is larger than capacity of street sections. This results in traffic congestion, which we detect by our algorithm. Finally, the maximum speed of the vehicles was set to 50km/h, while Vt
was set to 21.1km/h. The communication among vehicles is simulated in OMNeT++ with Veins framework which simulates 802.11p standard and is coupled with SUMO traffic simulation. We implemented our algorithm as application layer module in Veins and we compared it to the broadcasting application layer with fixed broadcast interval. Since most of
the VANETs applications will be based on exchanging both beacons and data packets, both of applications we simulated are based on sending beacons and data as well. Beacon interval
Bi=15s is same for both simulations, while data intervals are
different. Our algorithm (Protocol A) has adaptive data interval while periodic broadcasting (Protocol B) has fixed data interval
Di=10s. Following parameters were recorded: congestion
parameter and speed, total time average of received data packets, average number of sent packets, average number of times when node went in back-off, average total busy time of the node and, average data broadcast rate.
B. Results
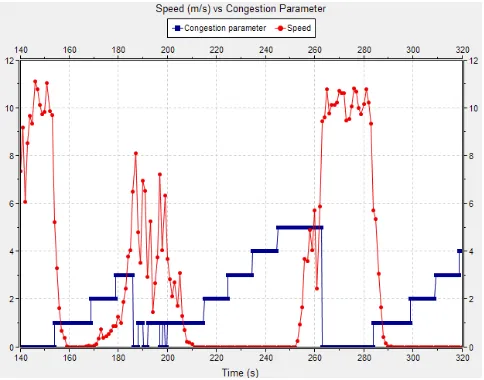
We recorded time changes of speed and Cp for each
vehicle, and the result for one of them is shown in Fig. 3. It can be seen that our congestion detection mechanism precisely quantifies the level of congestion of each vehicle, and as soon as speed becomes lower than threshold our algorithm starts quantifying the congestion, and when it reaches the maximum value Cp=5, it stays that way until speed becomes greater than
threshold Vt. Since vehicles know the congestion level in
current location, we tested if they know correct information about neighbouring areas as well. We chose one of the areas Aid
and recorded Cp it in two vehicles, one that visits this area and
other that’s not going through this area at all, but receives information about it from other vehicles. The Cp values are
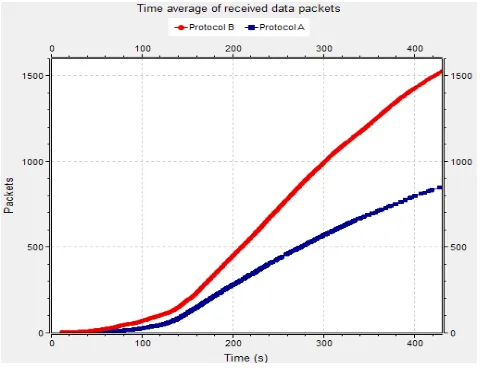
[image:4.595.312.554.511.701.2]shown in Fig.4, where they overlap most of the time and proving the vehicle which doesn’t go through the area has correct information about the congestion level there. We tested the impact of detection on the communication parameters and the network. To see the effect of congestion detection on adaptation of data broadcasting interval we recorded several parameters, including time average of received data packets, number of times each node went into back-off, total time while node was busy, and data interval. Fig.5. shows that time average of received data packets per vehicle is less when using our algorithm compared to periodic broadcasting. Table.1 shows the overview of simulations and indicates that our algorithm reduces the number of sent and received packets. Broadcast rate shows that our algorithm significantly reduces broadcasting interval of nodes.
Fig. 4. Comparison of congestion parameters for the same area of vehicles moving on different routes.
Fig. 5. Time average of received data packets in Protocol A and Protocol B.
TABLE I. OVERVIEW OF SIMULATION RESULTS
I. CONCLUSION
In this paper we presented an algorithm designed to detect and quantify the level of traffic congestion which is based on V2V communication and 802.11p standard. The main contribution of the proposed algorithm is it detects and quantifies the level of traffic congestion in completely
distributed way, independent of any supporting infrastructure and additional information such as traffic data from local authorities. It relies solely on observation of traffic conditions by each vehicle and information obtained from other vehicles. Communication is based on adaptive broadcasting. Results show that congestion detection performed by each vehicle corresponds to actual vehicle’s speed, and that congestion quantification is correct. Finally, the algorithm ensures that less amount of data is sent which contributes towards reducing the network load, especially important for VANETs since there will be many different applications running on limited number of channels. Our future work will include development of more advanced cooperative solutions for distributed congestion detection and management.
REFERENCES
[1] “Traffic congestion on roads costs UK economy £4.3bn a year,” www.inrix.com
[2] 802.11p-2010 - IEEE Standard for Information technology-- Local and metropolitan area networks-- Specific requirements-- Part 11: Wireless LAN Medium Access Control and Physical Layer (PHY) Specifications Amendment 6: Wireless Access in Vehicular Environments, 2010. [3] N. Wisitpongphan, O. K. Tonguz, J. S. Parikh, P. Mudalige, F. Bai, and
V. Sadekar, “Broadcast storm mitigation techniques in vehicular ad hoc networks”, IEEE Wireless Communications, Vol. 14 , Issue 6, 2007. [4] X. Ma, , J. Zhang, and T. Wu,” Reliability analysis of one-hop
safety-critical broadcast services in VANETs”, IEEE Transactions on Vehicular Technology, Vol. 60 , Issue 8, 2011.
[5] T. Kosch, C. J. Adler, S. Eichler, C. Schroth,“The scalability problem of vehicular ad hoc networks and how to solve it,”, IEEE Wireless Communications, October 2006, Issue 5, Vol. 13.
[6] L. Wischhof, A. Ebner, H. Rohling, M. Lott and R. Halfmann,” SOTIS - a self-organizing traffic information system,” IEEE Vehicular Technology Conference 2003,VTC 2003-Spring.
[7] T. Nadeem, S. Dashtinezhad, C. Liao, and L. Iftode,”TrafficView: a scalable traffic monitoring system,” IEEE International Conference on Mobile Data Management, 2004.
[8] G. Marfia, and M. Roccetti,” Vehicular congestion detection and short-term forecasting: a new model with results,” IEEE Transactions on Vehicular Technology, Vol. 60, Issue 7, 2011.
[9] R. Bauza, J. Gozalvez, and J. Sanchez-Soriano,”Road traffic congestion detection through cooperative vehicle-to-vehicle communications,” IEEE 35th Conference on Local Computer Networks (LCN), 2010 [10] I. Leontiadis, G. Marfia, D. Mack, G. Pau, C. Mascolo, and M.
Gerla,”On the effectiveness of an opportunistic traffic management system for vehicular networks”, IEEE Transactions on Intelligent Transportation Systems, Vol. 12 , Issue 4, 2011.
[11] Overview Of Simulation Results T. J. Lomax, “Quantifying congestion,” NCHRP Rep. 398, Vol 1, 1997.
[12] C. Sommer, R. German, and F. Dressler, "Bidirectionally coupled network and road traffic simulation for improved IVC analysis," IEEE Transactions on Mobile Computing, vol. 10 (1), pp. 3-15, 2011. [13] OMNeT++,www.omnetpp.org
[14] D. Krajzewicz, J. Erdmann, M. Behrisch, and L. Bieker, “Recent Development and Applications of SUMO - Simulation of Urban Mobility,” International Journal On Advances in Systems and Measurements, 5 (3&4):128-138, December 2012
[15] S. Panichpapiboon, and W. Pattara-atikom,“A review of information dissemination protocols for vehicular ad hoc networks,” IEEE Communications Surveys & Tutorials, Vol. 14, Issue 3, 2012.
[16] C. Campolo, A. Vinel, A. Molinaro, and Y. Koucheryavy,” Modeling broadcasting in IEEE 802.11p/WAVE vehicular networks” IEEE Communications Letters, Vol. 15, Issue 2, 2011.
Parameter Protocol A Protocol B
Average number of sent packets 19 29 Average number of received data packets 1424 2666 Average number of times when node went
[image:5.595.43.283.270.454.2]