Rochester Institute of Technology
RIT Scholar Works
Theses Thesis/Dissertation Collections
5-20-2013
Using word and phrase abbreviation patterns to
extract age from Twitter microtexts
Nathaniel Moseley
Follow this and additional works at:http://scholarworks.rit.edu/theses
This Thesis is brought to you for free and open access by the Thesis/Dissertation Collections at RIT Scholar Works. It has been accepted for inclusion in Theses by an authorized administrator of RIT Scholar Works. For more information, please [email protected].
Recommended Citation
Using Word and Phrase Abbreviation Patterns
to Extract Age From Twitter Microtexts
Approved by Supervising Committee:
Dr. Manjeet Rege Committee Chair, Department of Computer Science
Dr. Cecilia Ovesdotter Alm Reader, Department of English
Using Word and Phrase Abbreviation Patterns
to Extract Age From Twitter Microtexts
by
Nathaniel Moseley
THESIS
Presented to the Faculty of
the B. Thomas Golisano College of Computing and Information Sciences
Department of Computer Science
Rochester Institute of Technology
in Partial Fulfillment
of the Requirements
for the Degree of
Master of Science
Rochester Institute of Technology
c
Copyright 2012 by Nathaniel Moseley
Acknowledgments
I wish to thank my friends and mother who provided valuable feedback on the reading of this
document through its development, as well as reminding me to keep at the task of writing. I would
also like to thank my parents for supporting me throughout my education.
I must extend gigantic thanks to my thesis committee, for their time spent proofreading this
document and for invaluable input on the progress of my experimentation and ideas. This would
Abstract
The wealth of texts available publicly online for analysis is ever increasing. Much work in
com-putational linguistics focuses on syntactic, contextual, morphological and phonetic analysis on
written documents, vocal recordings, or texts on the internet. Twitter messages present a unique
challenge for computational linguistic analysis due to their constrained size. The constraint of 140
characters often prompts users to abbreviate words and phrases. Additionally, as an informal
writ-ing medium, messages are not expected to adhere to grammatically or orthographically standard
English. As such, Twitter messages are noisy and do not necessarily conform to standard writing conventions of linguistic corpora, often requiring special pre-processing before advanced analysis
can be done.
In the area of computational linguistics, there is an interest in determining latent attributes
of an author. Attributes such as author gender can be determined with some amount of success
from many sources, using various methods, such as analysis of shallow linguistic patterns or topic.
Author age is more difficult to determine, but previous research has been somewhat successful at
classifying age as a binary (e.g. over or under 30), ternary, or even as a continuous variable using
various techniques.
Twitter messages present a difficult problem for latent user attribute analysis, due to the pre-processing necessary for many computational linguistics analysis tasks. An added logistical
chal-lenge is that very few latent attributes are explicitly defined by users on Twitter. Twitter messages
are a part of an enormous data set, but the data set must be independently annotated for latent writer
attributes not defined through the Twitter API before any classification on such attributes can be
done. The actual classification problem is another particular challenge due to restrictions on tweet
length.
Previous work has shown that word and phrase abbreviation patterns used on Twitter can be
indicative of some latent user attributes, such as geographic region or the Twitter client (iPhone,
Android, Twitter website, etc.) used to make posts. This study explores if there there are age-related patterns or change in those patterns over time evident in Twitter posts from a variety of
English language authors.
This work presents a growable data set annotated by Twitter users themselves for age and
other useful attributes. The study also presents an extension of prior work on Twitter abbreviation
patterns which shows that word and phrase abbreviation patterns can be used toward determining
user age. Notable results include classification accuracy of up to 82.6%, which was 66.8% above
relative majority class baseline (ZeroR in Weka) when classifying user ages into 10 equally sized
Contents
Page
Acknowledgments iv
Abstract v
List of Tables viii
List of Figures ix
1 Introduction 1
2 Background 3
2.1 Twitter and the Character of Tweets . . . 4
3 Related Work 5 4 Hypothesis 8 5 Pre-Experimental Design and Implementation 8 5.1 Data Collection . . . 8
5.2 Demographic Data Pre-Processing . . . 11
5.3 Tweet Loading . . . 12
5.4 Abbreviation Features and Extraction . . . 13
6 Data Set Analysis 16 6.1 Tweet Information . . . 18
6.2 Demographic Information . . . 22
7 Experiments 25 7.1 Initial Pilot Experiments . . . 30
7.1.1 Parameter Selection Experiments . . . 30
7.1.2 Grouping Experiments . . . 31
7.1.3 Binning Experiments . . . 32
7.2 Selected Data Set Experiments . . . 32
7.2.2 Numeric Feature Experiments . . . 33
7.2.3 N-gram Feature Experiments . . . 35
7.2.4 Boolean and Numeric Feature Experiments . . . 37
7.2.5 Boolean and N-gram Feature Experiments . . . 38
7.2.6 Numeric and N-gram Feature Experiments . . . 39
7.2.7 Boolean, Numeric, and N-gram Feature Experiments . . . 40
7.2.8 Withheld Users Experiments . . . 41
7.3 Association Mining . . . 43
7.4 Longitudinal Analysis . . . 47
8 Conclusions 48
9 Future Work 49
Appendices 55
Appendix A Demographic Tables 55
List of Tables
Page
1 Feature type names, examples, and occurrence rates compared to the work of
Gouwset al.[17] . . . 13
2 Basic information about the present data set . . . 18
3 Per-tweet minimum, maximum, and mean counts for types of tweet tokens . . . 20
4 Tweet examples from the collected data set . . . 20
5 Feature names and the difference of relative percentages found in the collected data set and the work of Gouwset al.[17] . . . 21
6 N-grams generated and their frequencies. . . 25
7 Age values covered by equal size classification bins . . . 26
8 Accuracy values for boolean feature experiments . . . 34
9 Accuracy values for numeric feature experiments . . . 35
10 Accuracy values for n-gram feature experiments . . . 36
11 Accuracy values for boolean and numeric feature experiments . . . 37
12 Accuracy values for boolean and n-gram feature experiments . . . 38
13 Accuracy values for numeric and n-gram feature experiments . . . 39
14 Accuracy values for boolean, numeric, and n-gram feature experiments . . . 40
15 Results of withheld user testing, 100 tweets per instance. . . 41
16 Results of withheld user testing, 75 tweets per instance. . . 42
17 Some association rules found in analysis. . . 43
List of Figures
Page
1 The web form prepared in this study for Twitter users to submit their information . 9
2 The web form suggests options as the user types . . . 10
3 The web form highlights input errors and displays an associated message . . . 11
4 Description of the nine abbreviation features from Gouwset al.. Each word pair was assigned one feature type classification. Some feature types overlap, such as drop last characterandword begin. In these cases, the more specific classification was assigned (drop last character). . . 15
5 Text cleanser algorithm provided by Gouwset al.[17] . . . 16
6 Abbreviation feature assignment algorithm . . . 17
7 Tweet and token distributions . . . 19
8 User demographic data specified for the data set . . . 23
9 Reported birth years of participants and age ranges at time of publication . . . 24
10 Metrics used in evaluation of classifiers. . . 27
11 Plots ofYou to Ufeature use percentages over time. . . 46
1
Introduction
Discovering latent data about authors of texts is a recognized topic of interest in natural language
processing. With the rising popularity of the internet, many texts and recordings that can be
sub-jects of computational linguistics analysis are available online, and online texts themselves
rep-resent ever growing corpora. Computational linguistics provides methods to process and analyze
these large language collections. Many corpora of internet language have received such attention,
such as blog posts, online news, and scientific publications [41, 42].
One of the newest corpora developing and increasingly receiving attention is a set of texts linguists have termedmicroblogs. These include short, often character-limited messages, such as
those found on Facebook update messages, SMS cell phone text messages, and Twitter messages.
These present an interesting type of linguistic corpus, but often, particularly in the case of Twitter,
the texts are noisy and more challenging to work with because of nonstandard language use. In
addition, character restrictions prompt authors to develop and use word and phrase abbreviations
to convey their messages in fewer characters [18]. Cook and Stevenson identified 12 types of
abbreviations often used in SMS messages [11]. Usage of these abbreviations results in messages
with a significant percentage of tokens that are out-of-vocabulary (OOV) for the language in which
they are written. Such increased linguistic sparsity can make linguistic analysis, such as for context, genre, and topic detection, more difficult to perform [29].
Part of the process of preparing Twitter messages for analysis involves mapping OOV word
and phrase abbreviations to in-corpus equivalents. Gouws et al. identified 9 word abbreviation
patterns used in Twitter messages which accounted for over 90% of the lexical transformations used
in a large collection of English tweets [17]. These abbreviation patterns are word-level changes
done in order to save characters in a message. The 9 identified abbreviation pattern features are
further discussed in subsection 5.4. Several of the types of abbreviation patterns are phonemic
changes, substituting a character for a phoneme or whole word. Gouwset al.used these patterns
to identify the region from which English-writing Twitter users were posting (according to time zone data provided by Twitter) as well as the client (iPhone, Android, Twitter website, etc.) used
to post the message [17]. Based on Sarawgiet al.’s success of using deep syntactic patterns and
shallow, token-level linguistic features to identify author gender [42] and Raoet al.’s success with
identifying user age [39], it is reasonable to assume that such abbreviation patterns can help identify
user age on Twitter.
Some prior studies have looked at identifying Twitter user age with relative success, but each
had to develop a data set by hand. Because of the required and costly manual annotation and
classification. Rao et al.began with a seed set of users selected from keywords in their account
description. They then had annotators choose from the seed set and users connected to them that
definitely fit in each of two bins: over or under 30 [39]. While the data were carefully selected for accuracy, such age classification is still a challenging problem. Rao et al. only managed 9-14%
correct classification over the baseline in evenly split binary classification [39].
Age is a constantly changing real-valued attribute and is not strictly linked to communication
preferences. Those discourse patterns that are sometimes indicative of age can not always be relied
on either, as discourse style changes with social context. Increased use of informal language can
be indicative of an adolescent [37], but the same person may completely change their register when
in a conversation with an employer or other adult.
Age and other demographic data are not supplied by Twitter. Users are able to supply a
lo-cation, but it can be any value they want, and it can be changed at any time. Additionally, users can supply a description, which may or may not hint at demographic data. Geography is best
rep-resented via the timezone a user selects to post from or view Twitter from, but more fine-grained
location and other demographic data are not available. Demographic data are used a great deal
in targeted marketing, which seeks to advertise relevant products to a user based on their
demo-graphic information. By only advertising to those demodemo-graphics who would be most interested in
a product, advertisers can save on costs and increase revenues [4]. When such information is not
available, it must be determined other ways, such as through text analysis applied to social media
services, such as Twitter or Facebook.
As demographic-tagged Twitter data sets are sparse and mostly not available, I contribute and present a novel data set developed to improve future Twitter research. In addition, I report on
analysis and processing methods, and I present updating findings regarding user age classification
using word and phrase abbreviations found in Twitter messages.
Section 2 gives a background of computational linguistics as it pertains to my topic. Section 3
covers previous work pertaining to Twitter analysis in computational linguistics. Section 4 explains
the details of my hypotheses as they relate to existing problems. Section 5 outlines the
methodolo-gies that I used in collecting and analyzing data. Section 6 presents an analysis of the collected data
set and extracted abbreviation features. Section 7 presents the details of my experimentation and
2
Background
Computational linguistics was boosted by machine translation efforts in the 1950s, because
re-searchers believed that computers would be able to produce effective translations more quickly
than their human counterparts [21]. Today, computational linguistics has many other applications
beyond automatic translation. An understanding of language and meaning can allow a computer
to more effectively interact with its human operators and can be used for text data analytics. This
takes many forms: In advertising, products such as Google’s Adsense show topic-centered ads
based on page content [23]; In email, spam filters analyze messages for typical real usage and spam usage then automatically flag messages that seem like spam; In intelligent human-computer
interaction, a computer can be able to communicate with and adapt to its user more effectively if it
knows different ways to present information based on its user’s age, education, emotional state, or
other attributes.
Computerized linguistic analysis has additional data available when analyzing speech than
when analyzing text. In speech, patterns in prosody, filled pauses such as umm, and so on can
indicate various details about a speaker. Additionally, speech can often be analyzed as part of a
conversation. Social factors such as social status (a boss or a child), gender,etc. can affect
vocab-ulary and many other linguistic factors in a conversation [14]. In contrast, when analyzing text, especially online texts, those extra speech components are not available, and in many cases,
con-versational information is not either. This sparsity restricts analysis to certain linguistic patterns.
Most studies analyze data that falls into two categories: shallow or deep linguistic features.
These categories are not always consistent between linguists, however. Shallow features often
in-clude information that is based on analysis of surface text, such as through tokenization, sentence
splitting, Part-of-Speech (PoS) tagging, lemmatization, sentence phrase structures, word
frequen-cies, genre or topic, and formality [16, 35]. Deep linguistic features involve further linguistic
analysis of a text. These features are usually context independent and deal with individual words,
phrases, and sets of characters. Deep features can include phrase type, voicing, word and sen-tence length, and word or character n-grams [9, 22]. Different studies assign features to different
categories, depending on perspective. Those above are based on the cited works.
Age is an acknowledged factor in language use, as noted by Wagner [49]. Wagner explains that
a person’s writing and speech patterns change over time as they learn and develop (‘age grading’)
[49]. An individual goes through many stages of language use through childhood, adolescence, and
adulthood. In childhood, language is acquired and understanding and conversational-interaction
skills are developed. Adolescence marks a period of change in many respects, and a person trying
use continues to change, often in response to changes in community language use (‘generational
change’). “Women have been repeatedly identified as the leaders of generational language change”
[49]. The variety of ways that language use changes over time and that language use with respect to age varies differently depending on gender and other individual features make age classification
a challenging and attention-deserving problem.
Texts found on the internet represent a gigantic collection for analysis of linguistic changes with
respect to age. The simplicity and low cost of writing on the internet allows individuals to publish
a prolific library of formal and informal texts. Many people keep blogs, write on message boards
and newsgroups, or participate in social networking sites. The types of writing available range
from long, scientific writing, which adheres to language standards with standard grammar, syntax,
and orthography, to short, informal messages, rich in nonstandard language found on Twitter.
2.1
Twitter and the Character of Tweets
Twitter is a relatively new service, made public in 2006, which allows users to post 140 character
updates. They can follow other users, such as friends, celebrities, or companies to receive a live
digest of those users’ updates. Users can engage in public or private conversations with these short
messages, forward messages they think their followers will be interested in byretweeting, or just
post whatever they are doing, thinking, or want to write [27]. Twitter has reported having over
140 million active users and 340 million tweets per day, meaning there is an incredible amount of
information and text exchanged on Twitter [26].
The Twitter service provides two special keyword annotations of note. First is the@-username
construct, often used in a conversation between two users, noting that a tweet is a reply to
some-thing another user has said, as a method of bringing a message to the attention of another user, or,
in aretweet, noting the original author of a quoted phrase or message. An at sign precedes a series
of up to 15 alphanumeric characters and underscores which correspond with the username of a
Twitter account. The entire token, including the at sign is hyperlinked, pointing to the associated
home page of that Twitter account.
The second construct is the hashtag, denoted with a ‘#’ symbol, which provides a tagging
interface for use in tweets. The hashtag symbol is followed by a keyword or phrase (no spaces)
that is relevant to the tweet. The hyperlink created from the hashtag points to a page that lists all other tweets with the same tag. As hashtags can occur anywhere within a tweet, they make the
process of cleaning a tweet into a standard language sentence somewhat difficult, as there is no
strict rule whether or not the hashtag is a part of a sentence or auxiliary. Hashtags that are most
removed [12]. Commonly, hashtags at the end of a tweet are dropped from sentence cleaning, and
those within sentences are treated as relevant words and have the ‘#’ symbol stripped for analysis
purposes. Gimpelet al.found 35% of hashtags were treated as words rather than tags [15].
In July 2011, Twitter crossed the one million mark for developer applications registered to
use the Twitter API [24]. Twitter provides developers and researchers a robust API with which
to interact with accounts and access user information and tweets. Every user defines a username,
and optionally a real name, description, and location. Also available are the account’s associated
timezone and the account creation timestamp. Each tweet is associated with several pieces of
information in addition to the message, such as its timestamp, the Twitter client it was posted
from, if it was part of a conversation, a retweet, and the count of people who retweeted it. However,
Twitter does not elicit other data about the author that might be useful for latent attribute analysis,
such as age or other demographic information.
Several corporate entities have published various studies of the demographics on Twitter. Most
use data mining techniques to extract a set of demographic features from the defined user attributes,
relying on instances where users have published their age, gender, or location as part of their profile
or somewhere in their tweets. Others, such as the Pew Research Center, utilize other forms of data
collection. In their internet and social media use survey, they used phone interviews to get data
on internet and social media (Twitter included) use and demographics [44]. Consumers of this
information tend to be in marketing, as companies are always seeking the best way to advertise to
their target audiences.
3
Related Work
A variety of work has been published that focuses on linguistic analysis for author age, much
of which focuses on lexical and contextual clues, such as analyzing topic and genre or n-gram
patterns. N-gram patterns can refer to several elements of linguistic analysis. On a lexical level,
n-grams are groupings of lengthnof word tokens, found adjacently in text. They are also referred
to as unigrams, bigrams, trigrams, etc. for n of 1, 2, and 3 respectively. On a character level,
n-grams can refer to groupings of adjacent characters within a word, in much the same way as
groupings of words. Depending on the approach, special characters may be used as marks at word boundaries. As an example, Cavnar presents trigrams for the word text, such as T, TE, TEX,
EXT, XT , and T [7]. This work, as many others, focus on token analysis. Tokens, as defined for
this work, consist of sets of characters, generally separated by spaces in the original text, but not
adjoining word tokens. Additionally, words recognized as contractions are separated into two word
tokens,e.g. “shouldn’t”→“should” and “n’t”.
Garera and Yarowsky used linguistic features (amount of speech in conversation, length of utterances, usage of passive tense,etc.) for characterizing types of speech in telephone
conversa-tions between partners in their research. They found that such sociolinguistic features improved
the accuracy of binary attribute classification for speaker age, gender, and native language [14].
Many features that are available in an audio corpus, such as prosody and vocal inflections, are
not available in a purely textual corpus, making related classification problems more challenging.
Garera and Yarowsky were able to get about 20% improvement over guessing the most common
class when classifying phone conversations for age with a binary classifier [14].
Nguyenet al.went a step beyond many other studies and classified age as a continuous variable
in online texts and transcribed telephone conversations. They found that stylistic, unigram, and part of speech characteristics were all indicative of author age with mean absolute errors between 4.1
and 6.8 years [37].
Rosenthal and McKeown analyzed online behavior associated with blogs (i.e. usually larger
depth than tweets) and found that behavior (number of friends, posts, time of posts, etc.) could
effectively be used in binary age classifiers, in addition to linguistic analysis techniques similar to
those mentioned above [41].
Similarly, many works investigating linguistic gender and age indicators focus on non-contextual
and deeper analysis, such as through statistical language models. A statistical language model is
a probability distribution over words, sentences, phrases, or characters in a language. A language model might hold probabilities representing n-grams. Those probabilities can be used in various
types of linguistic analysis [40].
With respect to examining another demographic feature, Sarawgiet al.explored non-contextual
syntactic patterns and morphological patterns to find if gender differences extended further than
topic analysis and word usage could indicate. They used probabilistic context-free grammars,
token-based statistical language models, and character-level language models, that learn
morpho-logical patterns on short text spans. With these, they found that gender is evident in patterns at the
character-level, even in modern scientific papers [42].
Much of linguistic analysis that has been completed focuses on formal writing or conversation transcripts, which generally conform to standard English corpora and dialects, syntax, and
orthog-raphy. Recently, more works have begun to look at new written and online texts which do not
tend toward prescriptive standards, including SMS messages and social networking blurbs, such
typ-ically noisy texts. Misspellings, unusual syntax, and word and phrase abbreviations are common
in these texts, which many linguistic analysis tools do not deal with.
Rao et al. found n-gram and sociolinguistic cues, such as a series of exclamation marks,
el-lipses, character repetition, use of possessives,etc., in unaltered Twitter messages could be used to
determine age (binary: over or under 30), gender, region, and political orientation, similar to works
that have focused on more formal writing. These textual sociolinguistic features yielded 20-25%
improvements over relative baselines [39]. These improvements are similar to those found in this
work. In the best cases, classifiers examined in this work using only numeric abbreviation
fea-tures performed almost 5% better. Abbreviation feafea-tures combined with n-gram feafea-tures showed
improvements of as much as 66.8%.
Gimpelet al.developed a part-of-speech tagger designed to handle the unique Twitter lexicon
by extending the traditionally labeled parts of speech to include new types of text such as emoticons and special abbreviations [15]. Part-of-speech analysis can be used as a part of normalizing noisy
text, or the part-of-speech patterns can be used themselves as features for classification.
Some research takes a different approach to noisy text, such as that found on Twitter. Before
performing traditional text analysis, noisy texts are often first cleaned or normalized. There are
various ways to approach the text normalization problem, such as treating it as a spell-checking
problem, a machine translation problem, in which messages are translated from a noisy origin
lan-guage to a target lanlan-guage, or as an automatic speech recognition (ASR) problem [45]. ASR is
often useful for analysis of texts such as SMS, since many of the OOV words are phoneme
ab-breviations using numbers [17]. Kaufmann and Kalita presented a system for normalizing Twitter messages into standard English. They observed that pre-processing tweets for orthographic
modi-fications and twitter-specific elements (@-usernames and # hashtags) and then applying a machine
translation approach worked well [29].
Gouws et al.built on top of the techniques of Contractoret al.[10] using the pre-processing
techniques of Kaufman and Kalita [29] to determine types of lexical transformations used to create
OOV tokens in Twitter messages. Such transformations include phonemic character substitutions
(“see”→ “c”; “late”→ “l8”), dropping trailing characters or vowels (“saying”→ “sayin”), and phrase abbreviations (“laughing out loud”→“lol”). These transformations are discussed further in subsection 5.4. Gouwset al.analyzed patterns in usage of these transformations compared to user time zone and Twitter client to see if there was a correlation. The analysis showed that variation in
usage of these transformations were correlated with user region and Twitter client [17].
In sum, prior work suggests that text-based age prediction is tenable and leaves room for
to user age.
4
Hypothesis
There are presently some techniques to determine latent user attributes from general texts, but few
that specifically target Twitter messages and their unique corpus characteristics. Of those works
that have focused on Twitter messages, they have two main types of shortcomings: (1) they focus
on a small set of gathered data from hand-picked users, where latent attributes are determined from
limited descriptions on user profiles or key tweeted phrases and are entered by human annotators,
as opposed to by the Twitter users providing the information themselves; or (2) they use the full
set of Twitter users and messages, but tend to be limited to the latent attributes that are provided
through the Twitter API.
Based on these observations, first, I present my solution to these issues through collection of
a new, more robust data set where the tweeters themselves label their Twitter feeds with
demo-graphic information. Second, based on the work of Gouws et al., I hypothesize that word and
phrase abbreviation patterns used to write tweets are indicative of user age, as they are indicative
of a user’s region and Twitter client [17]. Third and last, I hypothesize that usage of these
abbre-viations changes as a user ages or spends more time using the Twitter service, similar to the ways
in which language changes as a person ages and community language use evolves. I present my
experimental analysis of collected data seeking to examine these hypotheses.
5
Pre-Experimental Design and Implementation
The pre-experimental work of this thesis is comprised of four parts: (1) collection of a Twitter data
set, described in subsection 5.1; (2) pre-processing of the collected user demographic information,
described in subsection 5.2; (3) collection of user tweet data, described in subsection 5.3; and (4)
extraction of abbreviation pattern features from the collected data, described in subsection 5.4.
5.1
Data Collection
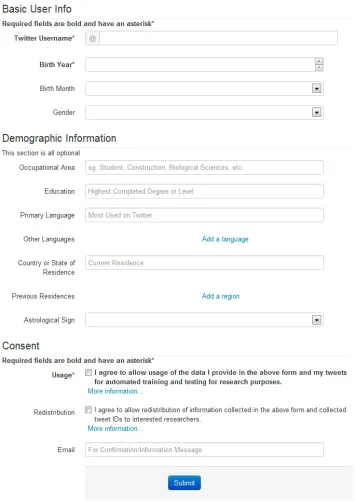
The first contribution of this thesis is collection of a user-driven Twitter data set, containing at a
minimum a user’s Twitter username, year of birth, and collected tweet IDs. The data set is
popu-lated via a user-friendly web form, shown in Figure 1, via Twitter users entering information to be
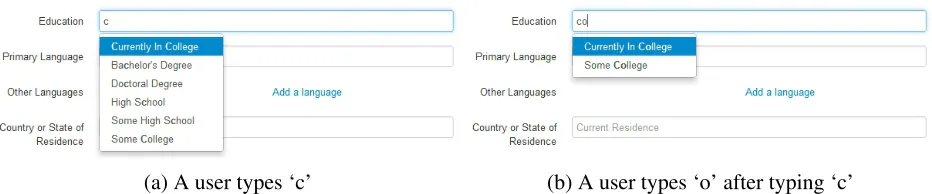
(a) A user types ‘c’ (b) A user types ‘o’ after typing ‘c’
Figure 2: The web form suggests options as the user types, sorted alphabetically. The top option in Figure 2a is a user-generated option that has been used more than a threshold number of times. The other options are predefined.
are being truthful in their supplied demographic data, but it is possible that falsified information can be submitted. When the data set is large, the majority of information collected should be truthful,
and a submission of falsified information may show as an outlier in some part of the analysis.
The web form explains basic requirements of the data collection and links to pages with more
information. Users are informed of the privacy of their data and given the opportunities to allow
their data to be redistributed to future researchers, update the information they provide, or opt
out entirely from the research. The minimum amount of information collected is Twitter
user-name and year of birth. Twitter users can also supply 8 additional attributes: (1) month of birth,
(2) gender, (3) occupational area, (4) highest education level, (5) languages used, (6) regions of
residence, (7) astrological sign, and (8) email. Most users appeared willing to include some if not all of this additional information. In the interest of future research, non-identifying
demo-graphic information is collected in addition to the age information that will be used for this thesis.
Astrological sign is suggested as a control variable, since there has been no support of a scientific
link between astrology and personal characteristics [19].
Email is collected for part of the form processing and future automated notifications. On
com-pletion of the form, users are shown a confirmation page with links to opt out or to update their
information. If they provided an email, they are emailed the same collection of information. Lastly,
a Twitter account for this thesis (@NMoseleyThesis) follows the user. In the event that the user’s
tweets are protected (only authorized users may view their tweets), this allows them to be read for later analysis.
The web form populates a database backend which in turn offers suggestions for the form
inputs. As shown in Figure 2, a set of predefined values for each attribute, as well as the most
frequently used user-created values, are suggested via JavaScript as a user types in the form. The
suggestions help increase initial data coherence. Additionally, each form field only allows certain
Figure 3: The web form highlights input errors and displays an associated message, requiring the user to correct errors before the form will submit.
Two checkboxes are included in the form which have brief sentences indicating user
con-sent. Adjoining links that point to a more in-depth explanation also show the same explanation on mouseover, if the user has JavaScript enabled. The first checkbox is required to be selected for
submission of the form. It explains that the data collected will be used for autonomous analysis
and will not be sold or redistributed except when the user checks the second consent box.
Check-ing the second checkbox acknowledges that the user is willCheck-ing to allow the data collected to be
redistributed to interested researchers in the future. It defines collected data to include all entries in
the web form, as well as collected tweet identifiers. The tweets themselves cannot be redistributed,
but the identifiers produced by Twitter can be, as per the Twitter data use policy [25].
The web form is cross-browser compatible, including on mobile platforms, and performs the
same with or without JavaScript enabled. Some added functionality, such as the above input sug-gestions and consent information mouseover, is not available without JavaScript. All value
check-ing is still done server-side, whether or not value checkcheck-ing is done with JavaScript. However, when
JavaScript is enabled, users are required to enter correct values and are informed of their errors, as
shown in Figure 3.
Data were solicited from a range of sources on the internet, as well as through QR code fliers
around the city of Rochester. Pages linked to from the web form offer social networking buttons,
allowing users to suggest to their contacts that they should also participate. In future research,
soliciting participation from public figures with many followers could potentially dramatically
boost the number of Twitter users who provide access to their tweets. Statistics about the collected data are discussed in section 6.
5.2
Demographic Data Pre-Processing
Before the collected user data could be used in analysis, each of the 10 values (section 5.1) had to
be pre-processed to ensure that data values are consistent and useful. Username, birth year, month,
gender, astrological sign, and email did not need any additional pre-processing. The web form
and database backend ensures that each of those fields has a valid value. The username must be
format, and the rest must be empty or contain one of the relevant pre-specified type values.
Occupation, education, languages, and regions needed special pre-processing for graphing and
other analysis, since users are allowed to write in any value that conforms to the character level constraints. Unique values were most frequently included in education and region where users
wrote phrases or sentences explaining their educational history or history of where they had lived.
Additionally, each of these values needed to be generalized in order to be most useful. Some
Twit-ter users included cities in their submitted regions, for example, and these were generalized to the
respective state or country region. Highest educational level completed was generalized to general
degree names (e.g. Master’s Degree, Doctoral Degree), college, and high school. For data set
redistribution, these values are left unaltered, as they were collected with future research in mind,
and any pre-processing should be done with the full data set, in the context of the research being
conducted. As most of the demographic data collected was not used in this work’s experiments, limited analysis of the demographic data was done for this thesis to see how the collected data
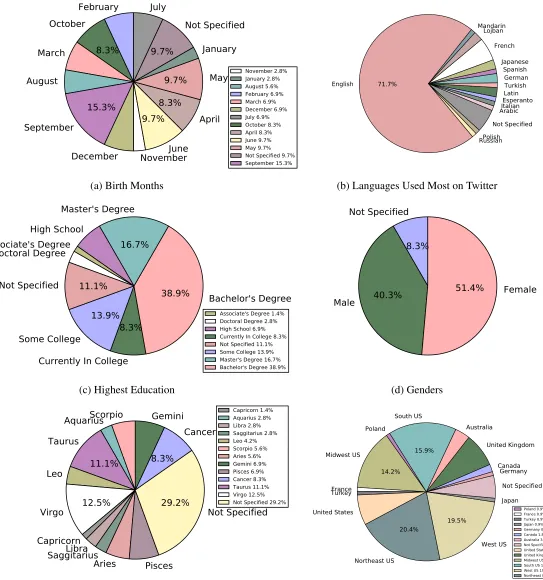
compares to other published statistics. Some of the results are shown in Figure 7 and are discussed
in subsection 6.2.
5.3
Tweet Loading
As part of the web form submission and in order to download users’ tweets, the users must be
followed on Twitter. Following users as they participate via the web form and downloading their
tweets is accomplished by using three programs developed as part of this work. All use Java and
the Twitter4J library for interfacing with Twitter [50].
The first program is a library to handle authentication using the thesis Twitter account. Twitter
uses an interactive OAuth authentication system [13], which requires authenticating applications
to ask the program operator to visit a web address. Upon opening the web address, the operator is
shown a pin to enter in the application, allowing it to authenticate with Twitter using the operator’s
Twitter account. Once the application has authenticated, it is possible to store the generated keys
and avoid authenticating in the future. The library handles storage and retrieval of the keys, or
generating them if they can not be found.
The second application handles following participating Twitter users and updating database
fields to reflect follow status. It is run after a user submits the web form shown in Figure 1 and described in subsection 5.1. First, after a new participant’s information is entered in the database,
the application queries the database for users marked as new or pending. Next, it queries Twitter
for users followed by the thesis account (this returns users as followed or pending). Using set
Feature Name Example Present Work Gouwset al.
Single Character (“see”→“c”) 1.0 % 29.1%
Word End (“why”→“y”) 1.1 % 18.8%
Drop Vowels (“should”→“shld”) 11.2 % 16.4% Word Begin (“schedule”→“sched”) 8.0 % 9.0%
You to U (“your”→“ur”) 1.7 % 8.3%
Drop Last Char (“saying”→“sayin”) 3.2 % 7.0% Repeat Letter (“food”→“fooooooood”) 3.0 % 5.5% Contraction (“birthday”→“b’day”) 70.7 % 5.0%
[image:23.612.117.499.70.219.2]Th to D (“this”→“dis”) 1.0 % 1.0%
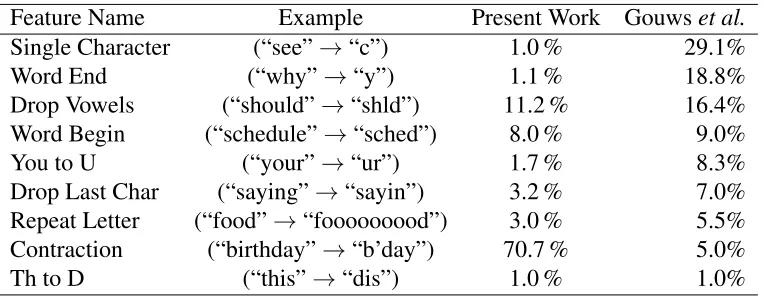
Table 1: Feature type names and examples with a comparison of relative percentages found in the collected data set to the work of Gouws et al. and ordered by the frequencies found by Gouws
et al.[17]. Percentages above reflect the percentage of abbreviation features identified that belong
to each class (excluding unidentified abbreviation patterns).
With the same set logic, it also determines what users in the database need to have their followed
status updated and executes the updates. The followed status can either be unfollowed (new users),
pending (requires user approval to follow), or followed. This logic is used to reduce the number of Twitter API queries and to ensure that the following program can be run without any other checks.
The last application is run manually to load new tweets. Using Twitter4J, as many tweets as
possible are downloaded from Twitter and stored in compressed files along with some metadata
that allows tweet downloading to be continued later. Because the Twitter API only allows the most
recent 3200 tweets, give or take a few, to be downloaded, the timestamps of the collected tweets
will only go back so far. The oldest collectable tweet corresponds inversely to the rate at which a
person tweets. For a person who only tweets about once a day, their tweets can be collected from
9 years ago (if Twitter were that old). The most prolific participant tweets about 15 times per day.
As a result, that participant’s tweets can only be collected to around 7 months prior to the date of first collection.
5.4
Abbreviation Features and Extraction
In order to develop a model for predicting Twitter user age, the collected tweets are analyzed for
abbreviation features. The abbreviation features used are those found by Gouwset al.to be most
frequent in an overall Twitter corpus [17]. Those features are descriptively titledsingle character,
word end,drop vowels,word begin,you to u,drop last character,repeat letter,contraction, andth
to d. The usage frequency of abbreviation patterns found in the collected data set are compared to
are discussed in relation to the collected data set below.
The tweets collected using the Java framework described in subsection 5.2 were fed to a python
framework for further analysis. The text of each tweet was given to the cleanser framework de-veloped by Gouws et al., which attempted to text-normalize each tweet into a standard English
sentence. Different stages of the text normalization utilized functions from the python Natural
Language Toolkit (NLTK) framework [33] and the SRI Language Modeling Toolkit (SRILM) [46].
The algorithm is outlined in Figure 5. (1) For each tweet, remove any series of punctuation
de-termined to be emoticons, as well as HTML bracket artifacts, should they exist. A simple regular
expression approach is taken to recognizing emoticons, as the problem is in itself quite difficult,
as outlined by Bedrick [5]. Because of this difficulty, only a small subset of all emoticons could
be correctly identified, so such features are not included in this work’s analysis. (2) Tokenize each
tweet into individual word tokens and punctuation. The NLTK tokenize.punktlibrary is used for tokenizing sentences, as it is effective at separating words and punctuation, as well as separating
contraction words into multiple tokens,e.g. “shouldn’t”→“should n’t”. (3) Generate substitution candidates for each OOV token using a string subsequence kernel [32]. Each candidate is paired
with a probability used as an evaluation of the similarity to the original OOV token. Tokens that
are not OOV are assigned a substitution candidate the same as the original token and a probability
of 1. Probabilities are generated by the SRILM ngram program using n-gram language models
based on Gouwset al.’s LA Times corpus [17] and Han and Baldwin’s Twitter corpus [18]. (4) A
word mesh (a confusion network that can be translated into a probabilistic finite-state grammar) is
generated from the list of candidates and probabilities, which is given to thelattice-toolprogram of SRILM to decode into a most likely cleaned sentence, consisting of the candidates with the
lowest expected word error. (5) The uncleaned original and tokenized texts are recorded, along
with a list of pairs consisting of an OOV token and its generated substitution. Non-OOV tokens
are retained as part of the tokenized text, but since they are not abbreviated, they are not recorded
in the substitution pairs, as the pairs are used for abbreviation feature generation.
The abbreviation features are determined on a per-tweet level, based on a per-token analysis
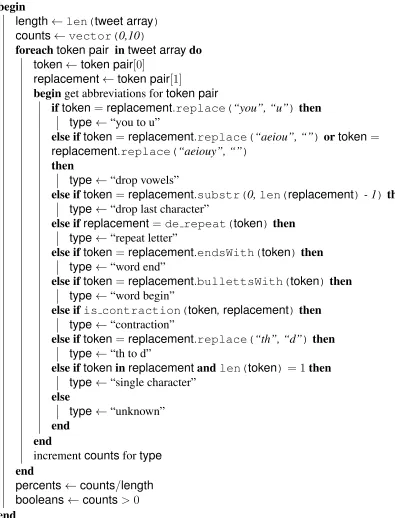
using the algorithm outlined in Figure 6. The input is the list of token and substitution pairs
gen-erated by the algorithm above. (1) For each tweet, each token and substitution pair are passed
to an abbreviation-finding function. (2) The function applies a series of regular expressions and substring checks, which correspond to each of the defined abbreviation features. (3) Each token
pair is thereby assigned an abbreviation feature classification representing which abbreviation type
it matches. (4) The tweet’s set of token abbreviation feature classifications are consolidated into
Single Character
Replace a word with a single character. This is often a phonemic transliteration, such as “see”→“c” or “to”→“2”. This is overridden by other feature classifications.
Word End
Drop all characters except a substring at the end of the identified replacement word, such as in “why”→“y” or “them”→“em”.
Drop Vowels
Vowels make up approximately 38% to 40% of English words [2]. Dropping vowels is often used to shorten words. This feature is defined as elision of one or more ortho-graphic vowels in a word,e.g. “could”→“cld” or “interesting”→“intersting” (elision of a single ‘e’).
Word Begin
Drop all characters except a substring at the beginning of the identified replacement word, such as in “undergraduate”→“undergrad” or “schedule”→“sched”.
You to U
“You” is sometimes abbreviated as “u” in various pronoun-based words, such as you, your, you’re, etc.
Drop Last Character
The last character can often be omitted without affecting the reading of a word, as in the gerundive (-ing) case in English as in “saying”→“sayin” or in “what”→“wha”.
Repeat Letter
Sometimes letters are repeated rather than omitted. This can be to communicate empha-sis or emotion, such as in “food”→“fooooooood” or “amazing”→“amaaaaazinggg”.
Contraction
A traditional space saving method of abbreviating two words as one. Due to the dif-ficulty of detecting compounds that do not utilize an apostrophe, this feature only de-scribes words that are contractions using an apostrophe, such as nonstandard “breakfast”
→“b’fast” or standard “could not”→“couldn’t”.
Th to D
Some words are perceived similarly when substituting the letter “d” for a “th”. This feature could include “the” →“da”, as a special case, but this was not considered, as it did not appear in the collected data set. Some cases that did appear in the data set include “that”→“dat” and “this”→“dis”.
Figure 4: Description of the nine abbreviation features from Gouws et al.. Each word pair was assigned one feature type classification. Some feature types overlap, such asdrop last character
Data: tweet text
Result: normalized tweet text
begingenerate sentence candidates
Remove emoticons and HTML artifacts
tokens←Tokenize sentence using NLTK + customization
candidates←foreachtoken intokensdoGenerate substitution candidates and probabilities
ifOOV but valid(token)then returntoken, 1.0
end
returnlist of substitution candidates and probabilities fortoken
end
lattice←generate confusion network forcandidates
replacements←generate lowest word error sentence fromlattice
returnreplacements
end
Figure 5: Text cleanser algorithm provided by Gouws et al. [17]. This work added some cus-tomization in tokenization and small fixes, but otherwise the algorithm is the same.
of tokens in the tweet which utilize each abbreviation type. (5) The percentages are further
gen-eralized to a boolean vector, which describes if a given abbreviation feature type was used at all
in a tweet. Equivalent experiments were run using the percentage vectors and the boolean vectors and compared. Studies have found that enough information can often be found in a single tweet to
do effective binary classification, such as on gender [6]. By comparing the results of classification
using the percentage and boolean vectors, it can be determined how much abbreviation feature
in-formation is necessary for a good classification. Additionally, combining boolean and percentage
features with word n-gram features, as well as best first feature selection or principal component
analysis feature extraction, was found to further improve classification results.
6
Data Set Analysis
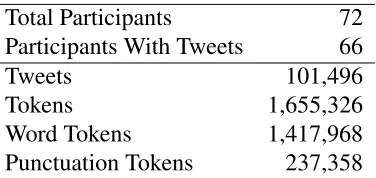
A total of 72 Twitter users supplied their demographic information. Of those 72 participants, 66
had tweets. This is in part due to several users having no tweets, and some who disappeared from
Twitter after submitting the web form data. This means 8% of participating users have no tweets.
According to Beevolve Technologies, as many as 25% of users have never tweeted [48]. In the
present data set, the average number of tweets submitted by a user is 1538. Beevolve Technologies
Data: tokenized tweet array
Result: abbreviation feature vectors (percentsandbooleans)
begin
length←len(tweet array) counts←vector(0,10)
foreachtoken pair intweet arraydo
token←token pair[0]
replacement←token pair[1]
beginget abbreviations fortoken pair
iftoken=replacement.replace(“you”, “u”)then
type←“you to u”
else iftoken=replacement.replace(“aeiou”, “”)ortoken=
replacement.replace(“aeiouy”, “”)
then
type←“drop vowels”
else iftoken=replacement.substr(0,len(replacement)- 1)then
type←“drop last character”
else ifreplacement=de repeat(token)then
type←“repeat letter”
else iftoken=replacement.endsWith(token)then
type←“word end”
else iftoken=replacement.bullettsWith(token)then
type←“word begin”
else ifis contraction(token,replacement)then
type←“contraction”
else iftoken=replacement.replace(“th”, “d”)then
type←“th to d”
else iftokeninreplacementandlen(token)= 1then
type←“single character”
else
type←“unknown”
end end
incrementcountsfortype
end
percents←counts/length booleans←counts>0
[image:27.612.92.487.106.624.2]end
Total Participants 72 Participants With Tweets 66
Tweets 101,496
Tokens 1,655,326
[image:28.612.214.402.70.159.2]Word Tokens 1,417,968 Punctuation Tokens 237,358
Table 2: Basic information about the present data set
average for tweets per person of 590, much lower than in the collected data set [48]. Basic
de-scriptive data set information is shown in Table 2. From the participants, over a hundred thousand
tweets were collected, comprising 1.65 million tokens. Of those tokens, about 1.4 million were
words and around two hundred thousand were punctuation. More detailed information about the
collected tweets from the 66 users that had tweets follows in subsection 6.1. Information about the
demographic data collected as part of the data set (all 72 users) is in subsection 6.2.
6.1
Tweet Information
The number of tweets collected for participating users varies widely, as shown in Figure 7a. As
discussed in subsection 5.2, only about the most recent 3200 tweets can be collected from a user.
The average of 1538 tweets collected per user and median of 1065 suggest that for as many users
for whom the number of tweets downloaded reached the maximum number (3200), there were
equally as many who had published under a thousand tweets. Additionally, several users only
contributed a few tweets, and a few contributed none.
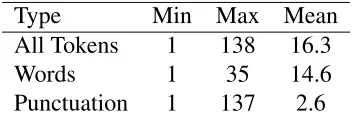
On the tweet level, most tweets had a token count in the teens or low twenties, as shown
in Figure 7b. This token count includes both word tokens and punctuation tokens. A punctuation
token includes standard clausal punctuation, such as commas and periods, as well as emoticons and
other only-punctuation elements in tweets. Additionally, the token count is based on tokenization
by the NLTK punkt tokenizer, which splits contractions into two word tokens, so a space-based
token count would have been a bit lower. Word tokens are the set of unigram tokens left over
when the punctuation tokens are removed. As indicated by Figures 7b and 7c, an average tweet
might be a single sentence, with two punctuation marks and 14 word tokens. The most extreme
outlier consists of a three character interjection (“YAY”), followed by 137 exclamation points. The
tokenizer splits standard punctuation, so this greatly increased the token count by splitting each of the 137 exclamation marks into its own token. The amount of punctuation tokens in a tweet is
Collected Tweets Per User
0
500
1000
1500
2000
2500
3000
3500
Count
(a)Average: 1538 Median: 1065
Tokens Per Tweet
0
20
40
60
80
100
120
140
Count
(b)Average: 16.3 Median: 16
Word Tokens Per Tweet
0
5
10
15
20
25
30
35
40
Count
(c)Average: 14 Median: 13
Punctuation Tokens Per Tweet
0
5
10
15
20
25
30
Count
[image:29.612.81.535.146.539.2](d)Average: 2.24 Median: 2
Type Min Max Mean All Tokens 1 138 16.3
Words 1 35 14.6
[image:30.612.218.394.152.211.2]Punctuation 1 137 2.6
Table 3: Per-tweet minimum, maximum, and mean counts for types of tweet tokens
All Tokens
Minimum (1) Glargleargleblaaaaarqa
Maximum (138) YAY!!![134 more !]
Mean (16) I called for a shuttle half an hour ago. Wtf. I am cold.
Word Tokens
Minimum (1) Nononono.a
Maximum (35) So if I do the pinch hit for Tari I’ll have about 5500 words due in Nov -TWRB is 3k, pinch hit is 1k, Avenger fest is 1k or 1.5 and K/S
Mean (14) Father daughter swim: 9-yr old Claire swam 2050 yds in 1 hr, congrats!
Punctuation Tokens
Minimum (1) Today I learned my bathroom door knob is broken and if I close the door I can’t get out and have to use the emergency call button. - -b
Maximum (137) YAY!!![134 more !]
Mean (2) I feel that I’ve been lured into a trap. There will be no cake.
Table 4: Tweet examples from the collected data set. Since actual counts are integer value, and means are floating point, examples below include floor values of the mean.
aMade up words and emotionally illustrative utterances can be difficult to effectively pair with a cleaned
represen-tation and subsequently label with features, as there is generally no equivalent pair already encountered for use by the normalization algorithm.
bTerminating hashtags, username @-references, and emoticons are not counted toward punctuation or word token
Feature Name Difference between Gouwset al.and present work Single Character 28.1 %
Word End 17.7 %
Drop Vowels 5.2 %
Word Begin 1.0 %
You to U 6.6 %
Drop Last Char 3.8 %
Repeat Letter 2.5 %
Contraction −65.7 %
[image:31.612.134.481.70.218.2]Th to D 0.0 %
Table 5: Feature names and the difference of relative percentages found in the collected data set and the work of Gouwset al.[17]. Differences shown are equivalent to subtracting the present work’s results from those of Gouwset al. in Table 1. A notable difference is for the Contraction feature (bolded), which accounted for a larger percentage of the detected word and phrase abbreviations in the present work than in the work of Gouwset al.. In all other cases, the percentages in the present work were lower than those in the work of Gouwset al..
and examples of average tweets and outliers are shown in Table 3 and Table 4, respectively.
As shown in Table 5, the distribution of abbreviation pattern features in the collected data set
is very different from those reported by Gouwset al. [17]. While Gouws reported 90% coverage
with the 9 defined abbreviation types with a large Twitter data set, those types only cover 43%
of the found abbreviation patterns in this data set. There are several reasons for this that could
be contributing factors, most notably that the algorithmic definition of the abbreviation patterns may not have been consistent between the work of Gouwset al.and this work. Additionally, the
data set primarily captures people who have completed some level of college (see subsection 6.2
and Figure 8c). These more educated persons appear at a higher rate in the collected data set than
other studies have indicated [44]. Many collected tweets are written in mostly standard English
with standard English syntax. Newer slang and various context-specific tokens, which may be
considered standard to a human reading or writing the collected tweets, would not have shown up
in the LA Times corpus or Han and Baldwin’s tweet corpus used to train the sentence normalizer
used in this study. As such, many tokens are replaced with unnecessary substitutions, and decoding
the lattice into a normalized sentence will augment tokens around any that were considered OOV. This creates anomalous abbreviation patterns that do not fit into the defined categories at a higher
rate than a more general Twitter corpus, such as that used by Gouwset al., in which users utilize
6.2
Demographic Information
The collected user demographic information, while from a small set of users, presents an
interest-ing picture of Twitter users that is consistent with some published figures. In the collected data
set, users self-labeled as 51.4% female and 40.3% male (see Figure 8d). If we divide those who withheld gender information evenly between the two groups, we get about 55.6% female, 44.4%
male. This is quite consistent with various demographic studies, which suggest that Twitter has
a slightly higher female user base than male. The Pew Research Institute reported Twitter users
as 53.5% female, 46.5% male [44], while Pingdom reported a higher rate of female usage at 60%
female, 40% male [1].
The month data collected is similarly consistent with other general demographic data. It has
been established that there are more births in the months of September and August. A random
sampling of a population statistically would yield a larger number of people born in those months
than others [36]. This is reflected reasonably in the collected data, shown in Figure 8a. 15.3% of participants self-labeled as being born in September. Additionally, as is common, fewer people
were born November through January. Those months encompass a total of 12.5% of the
partici-pants (90.3% of whom provided their month of birth). While the dates associated are not identical,
a similar effect is seen in the reported astrological signs (see Figure 8e). Virgo (mostly consists of
birth dates in the month of September) comprises 12.5% of participants, and Sagittarius, Scorpio,
and Capricorn (those closest to the months of November through January) are a total of 9.7%. Just
over 70% of people labeled their astrological sign.
Participants were also allowed to specify their highest level of education completed. After
pre-processing the variety of responses, it becomes evident that the collected data set consists mostly of educated persons. 82% of participants reported that they had completed some or all of a college
stay. 7% reported being in high school, and 11% did not provide education information. According
to the Pew Research Institute, 6.25% of Twitter users over 18 have not completed high school and
26.9% have completed high school, but no college [44], which reflects a much higher rate of lower
education than that reported in the collected data set. The Pew Research Institute also stated that
25.9% of users were in college, while 40.2% had completed college [44]. In comparison to the
collected data set, 22% were in college and 60% had completed college. Again, the amount of
educational preparation of the users in the data set is generally higher and more homogeneous than
a general populous on Twitter. This could have various effects on the writing styles observed for these users. As noted in subsection 6.1, this could be a contributing reason for the lower usage of
the word and phrase abbreviations that this research uses as features.
February
October
8.3%
March
August
September
15.3%
December
November
June
9.7%
8.3%
April
May
9.7%
January
Not Specified
9.7%
July
November 2.8% January 2.8% August 5.6% February 6.9% March 6.9% December 6.9% July 6.9% October 8.3% April 8.3% June 9.7% May 9.7% Not Specified 9.7% September 15.3%(a) Birth Months
EsperantoLatin Turkish German Spanish Japanese French Lojban Mandarin English 71.7% RussianPolish Not Specified ArabicItalian
(b) Languages Used Most on Twitter
Some College
13.9%
Currently In College
8.3%
Bachelor's Degree
38.9%
Master's Degree
16.7%
High School
Associate's Degree
Doctoral Degree
Not Specified
11.1%
Associate's Degree 1.4% Doctoral Degree 2.8% High School 6.9% Currently In College 8.3% Not Specified 11.1% Some College 13.9% Master's Degree 16.7% Bachelor's Degree 38.9%
(c) Highest Education
Not Specified
8.3%
Male
40.3%
51.4%
Female
(d) Genders
Cancer
8.3%
Gemini
Scorpio
Aquarius
Taurus
11.1%
Leo
Virgo
12.5%
Capricorn
Libra
SaggitariusAries
Pisces
Not Specified
29.2%
Capricorn 1.4% Aquarius 2.8% Libra 2.8% Saggitarius 2.8% Leo 4.2% Scorpio 5.6% Aries 5.6% Gemini 6.9% Pisces 6.9% Cancer 8.3% Taurus 11.1% Virgo 12.5% Not Specified 29.2%(e) Astrological Signs
Canada United Kingdom Australia South US 15.9% Poland Midwest US 14.2% France Turkey United States Northeast US 20.4% West US 19.5% Japan Not Specified Germany Poland 0.9% France 0.9% Turkey 0.9% Japan 0.9% Germany 0.9% Canada 1.8% Australia 3.5% Not Specified 5.3% United States 7.1% United Kingdom 8.0% Midwest US 14.2% South US 15.9% West US 19.5% Northeast US 20.4%
[image:33.612.34.577.82.662.2]1950 1955 1960 1965 1970 1975 1980 1985 1990 1995
User Birth Year
0
1
2
3
4
5
6
7
8
9
Count of Users
0.00
0.02
0.04
0.06
0.08
0.10
0.12
Probability
(a) Distribution of participant birth years.
Ages Participants
≤24 43.1% 25-34 43.1% 35-44 12.5% 45-54 0.0% 55-64 1.3% 65+ 0.0%
[image:34.612.77.329.76.208.2](b) Participant ages within discrete ranges consistent with those used by other Twitter demographic research.
Figure 9: Reported birth years of participants and age ranges at time of publication
most used on Twitter, and regions of residence. Users were also allowed to submit any value
to these entries, if none of the suggested values were adequate. In spite of this, user-specified
languages did not need any additional cleaning. The regions of residence submitted did require additional cleaning, however. Several users were more specific with their region submissions,
listing their city of residence. Some other users submitted a phrase describing their residence
situation or history. In Figure 8f, these values are adjusted to country or US region. The majority
of participants were from the US (77% of total participants; 5% did not specify any region), so the
states specified within the US were separated into five geographical regions, plusUnited Statesfor
those who only submitted the country name. Languages much more frequently received multiple
values, and in a greater number than regions of residence. 71.7% of languages reported were
English. 91.7% of users reported using at least English, and 6.9% did not specify any language.
Frequently, those who did not specify a language did not specify a region of residence or other information. Only 1% did not specify English in their languages used. The user that did not
specify English was withheld from analysis, while those users that did not specify any language
were verified manually as using English.
The focal point of the data collection was participant birth years. The collected data are shown
in two forms in Figure 9. Other research that targets Twitter user age often treats age as a binary
classification, while much published demographic research uses age range bins of ten years. The
collected data show a similar distribution to these demographics with a higher usage rate in younger
people, with the usage rate tapering off for more aged persons. Almost 90% of participants were
under 35, which is a higher rate than many demographic publications on Twitter users. Pingdom
N-gram N Frequency
! 1 0.998
! ! 2 0.562
thank 1 0.335 thank you 2 0.258
N-gram N Frequency , too 2 0.187 , too . 3 0.115
[image:35.612.144.468.72.142.2]ur 1 0.103
Table 6: N-grams generated and their frequencies. The frequencies reflect those found in data sets with 100 tweets per instance. N-gram elements are space separated. Very few trigrams were selected, as their frequency was very low. Of those that were selected, most include some form of punctuation, such as, too . shown above.
participants were in the 35 to 54 and the 55 and over categories, respectively. It is difficult to do
comparisons with much published work, however, due to the differences in sampling and reporting
methods, but it becomes relatively clear that the collected data set is thus far heavily influenced by younger Twitter users. This is similar to the data reflected by Beevolve, which collected user
ages when they were defined in a user’s profile on Twitter textually. Beevolve found, of those
users that self-report their age on their Twitter profile (about 0.45%), almost 90% are under 35.
Of those, 73.3% are aged 15-25 [48]. This suggests that younger users are much more willing to
divulge their age, which could account for the prevalence of young participants in this data set, as
revealing age was mandatory for participation. These biases are part of what makes age prediction
such a difficult problem.
7
Experiments
The experiments were run on several hundred data sets with a number of classifiers and
differ-ent combinations of abbreviation features and n-gram features. The base feature types were (1)
boolean and (2) percentage vectors, as explained in subsection 5.4. Additionally, (3) n-gram
fea-ture vectors were created from the tokenized versions of each tweet, using Weka’s n-gram
tok-enizer. Since the tokenizing was already done as part of the pre-processing, the tokenizer simply
separated tokens by spaces, and additional parts of traditional n-gram processing, such as stop lists,
were not used. All n-gram tokens were processed in lower case, to avoid capitalization overlaps. A
Lovins stemmer [34] was applied as part of the process, since many words can appear with many derivational and inflectional suffixes. The most frequent n-grams (up to an n of 3) were selected
automatically by Weka, resulting in about 1200 text features. In experiments using n-grams,
fea-ture selection or extraction was run to reduce the number of feafea-tures, often to around 400 or less.
Bins Age Range 2 <= 25, <= 61
4 <= 22, <= 25, <= 30, <= 61
6 <= 20, <= 22, <= 25, <= 28, <= 32, <= 61
8 <= 20, <= 22, <= 23, <= 25, <= 28, <= 30, <= 33, <= 61
[image:36.612.97.519.76.157.2]10 <= 19, <= 21, <= 22, <= 23, <= 25, <= 27, <= 28, <= 30, <= 33, <= 61
Table 7: Age values covered by equal size classification bins. Bin time ranges were generated so that the number of instances were as equal as possible between bins. Instances are assigned a class based on the age of the user (in years) at the time of writing the tweet or tweets represented by the instance’s feature data.
if present, zero if absent. Some selected n-grams are shown in Table 6. These three feature types
were used in experiments individually, as well as in three combinations of two types and one of all
three types.
The data were comprised of a bit over a hundred thousand instances (one per tweet), which were combined in several ways for analysis. A group of data sets was created with one tweet per
instance, as well as with groups of 25, 50, 75, and 100 tweets. For example, in the 100 tweet
grouping, 100 tweets from the same user in chronological order were grouped and treated as one
instance and analyzed for the three types of feature vectors. Extra tweets that did not fill a full
group were ignored for those data sets, so that each instance was comprised of a full 100 tweets.
This reduced the total number of instances in the data set (around 1000 instances for 100 tweets
per group), while increasing the feature information contained in each instance. Initial experiments
were run on several tweet groupings in order to determine an optimal amount of data per instance.
Later experiments restricted the data sets to one tweet per instance, a group with 75 tweets per instance, and three groups with 100 tweets per instance. Experiments performed to determine
optimal grouping sizes are discussed in subsubsection 7.1.2.
About 30 thousand of the tweets (30%) did not have any recorded word and phrase
abbrevi-ation features, as they were written in standard English. For this reason, each group of data sets
were duplicated and filtered to only include tweets which exhibited at least one feature type. This
division was done on a per-tweet level, so when grouped, all tweets in a group would have had at
least one feature type alone. This generally improved classifier accuracy, except in the case of the
n-gram feature type. Since the division was based on the boolean and percentage vectors, there
was generally little or no improvement in n-gram based analyses between the filtered and unfiltered groups.
Using the age data provided by the study participants, and the timestamps of their collected
Accuracy = T P +T N
T P +F P +T N+F N (1)
P recision= T P
T P +F P (2)
Recall= T P
T P +F N (3)
F M easure= 2∗ Recall∗P reci


![Table 5: Feature names and the difference of relative percentages found in the collected data set and [17]](https://thumb-us.123doks.com/thumbv2/123dok_us/45740.4135/31.612.134.481.70.218/table-feature-names-difference-relative-percentages-collected-data.webp)