Int. J. Electrochem. Sci., 11 (2016) 6229 – 6243, doi: 10.20964/2016.07.10
International Journal of
ELECTROCHEMICAL
SCIENCE
www.electrochemsci.org
Inhibition Effect of Water-Soluble Chitosan N-quaternary
Ammonium Salt on Carbon Steel in 0.25 M H
2SO
4Solution
Xiumei Wang*, Qing Wang, Ye Wan, Ying Ma
School of Materials Science and Engineering, Shenyang Jianzhu University, Shenyang, Liaoning, China 110168
*
E-mail: [email protected]
Received: 4 March 2016 / Accepted: 29 April 2016 / Published: 4 June 2016
The corrosion inhibition of modified natural product (2-hydroxypropyltrimethyl ammonium chloride chitosan (HACC) for carbon steel in 0.25 M H2SO4 solution was studied through four methods
including weight loss method, potentiodynamic polarization curves, electrochemical impedance spectroscopy (EIS) and scanning electron microscopy (SEM) techniques. The concentration of HACC and solution temperature affected HACC inhibition efficiency. The weight loss results indicated the high HACC concentration and low temperature lead to good inhibition. HACC was a mixed inhibitor by retarding both anodic and cathodic processes simultaneously. Standard free adsorption energy ΔGo
ads was calculated and discussed. The adsorption of HACC obeyed the Langmuir isotherm and was
of spontaneous characteristic accompanied by joint physisorption and chemisorption. The corrosion rate of carbon steel was mainly controlled by Ea in 0.25 M H2SO4 solution.
Keywords: Carbon steel; EIS; Polarization Curves; Sulfuric Acid; Inhibition Efficiency1. INTRODUCTION
Various metal equipments such as reaction vessels, pipelines (water, gas and oil) and storage tanks are used extensively in many industrial fields. Carbon steel with high tenacity and good moldability is the main material to fabricate these equipments. Among these practical processes, hydrochloric and sulfuric acid solutions are the most common used agents leading to high corrosion rate of carbon steel because of its exposure to aggressive acid media resulting in economic losses and safety accidents, especially acid pickling, chemical cleaning of boilers, oil and gas recovery [1].
corrosion. The addition of corrosion inhibitor has become an effective method for metal against acid corrosion due to its high inhibition performance, simplicity of operation and considerable economic benefit on a world-wide scale [3]. In recent years, it has been reported in considerable details the prevention of organic compounds on carbon steel corrosion in corrosive electrolyte has achieved good effect [4-11]. The obvious characteristic of most organic inhibitors is that their structure contains O, N, P, S, π bond and/or conjugated system which endow organic molecules with the ability to reach metal surface by columbic attractions or transference of unshared electron pair [12-14]. The adsorptive ability of inhibitor on carbon steel surface is the most important factor affecting the inhibition efficiency. Generally, compound with heteroatom may be possible to behave as corrosion inhibitor. A variety of natural products have the potential to be used as corrosion inhibitor due to heteroatom in their structure of active constituents. Natural product chitosan is rich in hydroxyl and amino groups and it is environmental friendly, therefore, chitosan and its derivatives will be a promising inhibitor [15, 16]. In aqueous corrosive solution, the solubility is the prerequisite to determine the effect of corrosion inhibitor. Chitosan and its derivatives have low water-solubility and acid-solubility causing poor adsorption and poor inhibition effect. It is noticed that there is N atom in chitosan structure and N atom is easily modified into N-quaternary ammonium salt with good water-solubility by quaterisation. So the water-soluble chitosan N-quaternary ammonium salt is a promising preference. In this work, the aim is trying to evaluate the inhibition performance of water-soluble N-quaternary ammonium salt of chitosan (2-hydroxypropyltrimethyl ammonium chloride chitosan, HACC) on carbon steel in 0.25 M H2SO4 solution employing different methods. Adsorption isotherm is used to illustrate the adsorptive
mode of HACC molecule. Influences of HACC concentration and corrosive system temperature on inhibition effect will be made a detailed discussion.
2. EXPERIMENTAL
2.1. Material
For the present work, the carbon steel sample was composed of the below elements: 0.13% C, 0.05% Si, 0.30% Mn, 0.03% P and the remainder Fe. Before experiments, the carbon steels were mechanically made into specimens of 20 mm × 20 mm × 5 mm with a 3 mm hole in diameter for weight loss measurement. The specimens were polished with various grit paper (grade 100–800) gradually, washed with deionized water, put it into beaker containing 20 mL acetone and shook in ultrasonic bath for 10 minutes to remove surface grit and dust, finally dried with compressed air for use. For electrochemical experiments, the carbon steel sample was cut into a cuboid rod with 1 cm length and 1cm2 exposed surface areas, other surfaces were covered with resin. Before experiments, the exposed surface was polished with grit paper (grade 100–800), rinsed thoroughly with deionized water, degreased with ethanol, put it into beaker containing 20 mL acetone and shook in ultrasonic bath for 10 minutes to remove surface grit and dust, dried with compressed air and kept in desiccators. 0.25 M H2SO4 solution was made of AR grade sulfuric acid diluted by deionized water.
[image:3.596.230.361.137.368.2]
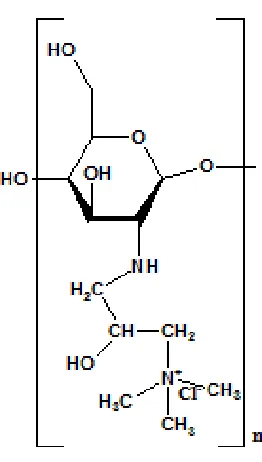
Bioengineering Co. Ltd. (Jiangsu, China)) was used without purification and it has the following structure (Fig.1).
Figure 1. Structure of 2-Hydroxypropyltrimethyl Ammonium Chloride Chitosan (HACC)
2.2. Weight loss measurements
The carbon steel specimens were weighed accurately by scale with ±0.1mg sensitivity, suspended with plastic hooks in triplicate in conical flask containing 250 mL corrosive electrolyte without and with various HACC dosages (10 to 100 mg L-1). The measurements were performed in H2SO4 solutions under natural condition. The carbon steel samples were taken out after they were
immersed in the corrosive media for 5 h, then flushed with tape water, shook in ultrasonic bath, rinsed thoroughly with deionized water, dried and reweighed accurately. At various temperatures (30-60℃), the experiments were repeated according to the same procedure. The weight loss of each sample was calculated for each corrosive solution. Equation (1) was used to determine the corrosion rate (CR).
(1)
where ΔW represents the weight loss of a carbon steel sheet (g), A represents the total geometrical area of a sheet (cm2) exposed to electrolyte, t represents the immersion time (h), ρ denotes Fe density (g cm−3). Average CR can be calculated at different corrosive solution.The surface coverage degree θ can be gained by equation (2) [17]:
The inhibitive effect of HACC for carbon steel is expressed as inhibition efficiency (ηw%)
calculated by equation (3)[18-20]:
(3) Where CRi and CR represent average corrosion rates (mmpy) of the tested sheets in corrosive
solution containing and without a specified HACC concentration (i), respectively.
2.3. Electrochemical Measurements
The cell equipped with three electrodes was applied to conduct electrochemical experiments. Saturated calomel electrode (SCE) was utilized as the reference electrode. Carbon steel sample with surface area of 1.0 cm2 and a platinum sheet (2 cm2, purity 99.9%) (CE) were employed as working electrode and counter electrode, respectively. Potentials of carbon steel were obtained versus SCE and shown in mV. All the experiments were conducted on electrochemical autolab Parstat 2273. In order to reach a steady state and ensure the reliable results, no obvious change should be observed in open circuit potential (OCP), so before electrochemical tests, the system was stabilized for 0.5 h.For potentiodynamic polarization experiments, the potentials vs OCP were obtained from -150 mV to +250 mV. 0.5 mV s-1 wasused as the scanning rate. EIS test was made at OCPThe frequency varied from 100000 to 0.01 Hz with 10 mV AC amplitude. The experiments were conducted under 30.0±0.1℃controlled by thermostatic water bath in a naturally aerated corrosive solution without stirring.
Cview was employed to analyze the potentiodynamic polarization curves. Nyquist plots were simulated with the suggested model by Zview.
2.4. Surface morphology of carbon steel
Observation of the corrosive morphology of carbon steel was the most visual method to judge the inhibitor performance. The carbon steel specimens were suspended in uninhibited H2SO4 solutions
and in presence of HACC (100 mg L-1) at 30.0±0.1℃ for 5 h, then taken out, washed and dried. The surface morphologies were obtained using SEM. The size of carbon steel sample was the same to that in weight loss experiments.
3. RESULTS AND DISCUSSION
3.1. Weight loss results
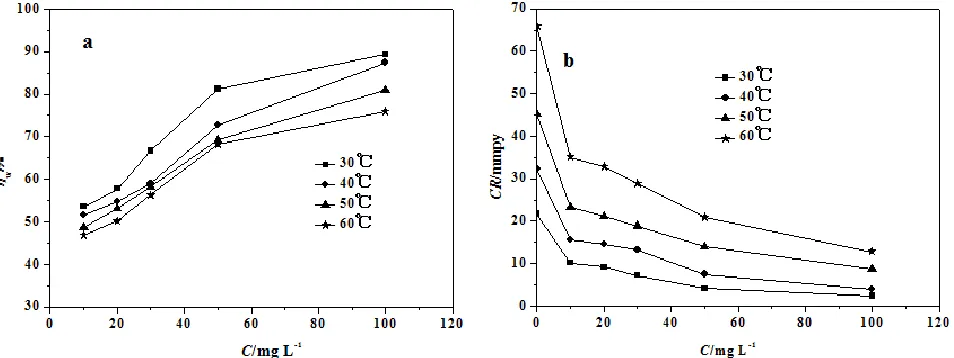
concentrations under certain temperature. The maximum ηw% is 89.3% with 100 mg L-1 HACC at
30℃. The inhibition phenomenon is ascribed to high surface coverage of adsorbed HACC molecules. Before saturation, high concentration and large coverage result in good inhibition performance.. Therefore the corrosion degree of carbon steel surface is decreased drastically [21, 22].
The variations of CR and ηw% with temperature are also presented in Fig.2. The reduction in
ηw% and an increase in CR from 30.0-60℃at specific concentration are observed. The results indicate
that ηw% reduced by the increment of temperature is due to the rapid dissolution of carbon steel
resulting in HACC molecules detached from steel surface. High temperature causes detachment of more HACC molecules and lower ηw%. But HACC still exhibits inhibitive effect even at the highest
temperature (60℃). This phenomenon implies that the stable protective layer formed and protects carbon steel from acid corrosion.
Figure 2. Plots of inhibition efficiency (ηw%) (a) and corrosion rate (CR) (b) for carbon steel in
uninhibited and inhibited 0.25 M H2SO4 solutions at 30-60℃.
3.2. Potentiodynamic polarization curves
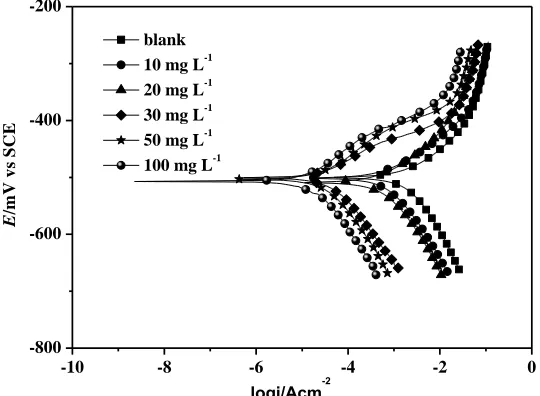
The potentiodynamic polarization e measurements may be employed to acquire the kinetic parameters of corrosion reactions of metal. The influence of HACC concentration on potential-current feature was presented in Fig. 3. From Fig.3, the existence of HACC shifts both anodic and cathodic curves towards low current densities even at the smallest concentration. The cathodic and anodic processes are greatly suppressed by HACC compared to those in the blank 0.25 M H2SO4 solution.
The increase of HACC dosage strengthens this suppression effect.
[image:5.596.66.543.282.461.2]
of the number of H+ cation on steel surface. HACC adsorption on steel surface downsizes surface area used for cathodic hydrogen reduction reaction.
-10 -8 -6 -4 -2 0
-800 -600 -400 -200
E
/m
V
v
s S
C
E
logj/Acm-2
[image:6.596.154.424.129.327.2]blank 10 mg L-1 20 mg L-1 30 mg L-1 50 mg L-1 100 mg L-1
Figure 3. Anodic and cathodic curves of carbon steel electrode in 0.25 M H2SO4 solution without and
with HACC at 30℃.
For anodic polarization branch, taking 100 mg L-1 as an example, at the low over potentials, with the potential increasing, the current density decreases slowly, which indicates that HACC adsorptive film has formed on steel surface [23-24]. At this time, the adsorption rate is over desorption rate. However, the inhibition is weakened with the continuous increase of over potential, even lost. In Fig.3, the current density increases rapidly and the inhibitor exhibits weak inhibition effect on carbon steel reaction as the potential continue to increase positively and reaches to above -400 mV, the potential is called as desorption potential indicating the desorption rate dominates the polarization process.
When the potential exceeds -340 mV the polarization curves exhibits the similar shape to that of the blank solution. Over potential reaches certain value the polarization curve coincides with that of blank solution. This suggests the electrode potential affects inhibition performance greatly. The behavior at higher over potentials is due to the fact that carbon steel dissolved significantly causing desorption of HACC molecules from steel surface [25]. This behavior is not clearly observed at low concentration.
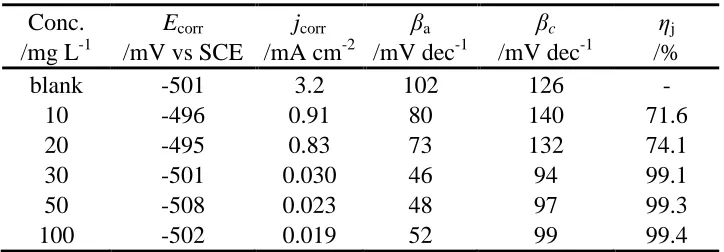
The corresponding electrochemical data extrapolated by polarization plots are presented in Table 1, such as jcorr, current density; Ecorr, corrosion potential; βc and βa, cathodic and anodic Tafel
slope; ηj%, inhibition efficiency calculated by jcorr employing equation(4) [26-27]:
(4) Where jcorr.,i(mA cm-2) and jcorr.,0 (mA cm-2) are the corrosion current densities in presence of a
Table 1 show in the presence of the HACC, the current density is reduced from 3.2 to 0.019 mA cm-2 in accordancewith the HACC concentration from 10 to 100 mg L-1, while ηj% improves with
the added HACC dosage, the highest value of ηj% is 99.4% at 100 mg L-1. Moreover, the addition of
HACC does not shift Ecorr value to positive direction or negative direction obviously. This indicates
that HACC may be defined as a mixed inhibitor, decreasing anodic rate together with cathodic rate simultaneously [28-29]. It was reported that [6, 30], the type of a compound as inhibitor depends on the Ecorr of metal in contrast to uninhibited solution. The compound is a cathodic or anodic inhibitor
when Ecorr value in inhibited solution is lower or higher 85 mV than that in blank solution. Considering
this work, the maximum variation in Ecorr versus blank solution is 7 mV, indicating that HACC
[image:7.596.118.480.308.434.2]behaves as a mixed inhibitor. Some researchers also reported the similar experimental results [6, 31].
Table 1. Electrochemical kinetic parameters obtained by extrapolation of potentiodynamic polarization curves at 30℃.
Conc. Ecorr jcorr βa βc ηj
/mg L-1 /mV vs SCE /mA cm-2 /mV dec-1 /mV dec-1 /%
blank -501 3.2 102 126 -
10 -496 0.91 80 140 71.6
20 -495 0.83 73 132 74.1
30 -501 0.030 46 94 99.1
50 -508 0.023 48 97 99.3
100 -502 0.019 52 99 99.4
3.3. Electrochemical impedance spectroscopy (EIS)
Fig. 4 recorded Nyquist diagrams of carbon steel at 30℃. The Nyquist plots show single depressed semicircle deviated from ideal semicircle. The phenomenon is due to the frequency dispersion in consistent with the high inhomogeneities of steel surface [32]. The characteristic of Nyquist plots implies that dissolution reaction of carbon steel may be controlled by charge transfer process. Nyquist plots remain the similar appearance to blank solution at chosen concentrations suggesting little variation in mechanism of carbon steel corrosion occurred after addition of HACC [33]. However, their sizes of semicircle increase significantly by increased HACC dosage.. The phenomenon was ascribed to the reduction of corrosion reaction by more HACC adsorption on steel surface [19].
An appropriate equivalent circuit could be applied to simulate the corrosive media/metal interface. Inspection of EIS characteristics in this case, equivalent circuit was adopted to model the H2SO4/carbon steel interface (Fig.5). Rs represents Helmholtz resistance; Rct denotes the charge transfer
The inhibition efficiency (ηR %) was obtained from Rct by the formula (5) [35].
(5)
where Rict and Rct represent charge transfer resistances in inhibited electrolyte and in blank
[image:8.596.68.540.184.363.2]solution, respectively.
Figure 4. Nyquist plots of carbon steel electrode in 0.25 M H2SO4 solution without and with different
concentrations of HACC at 30℃.
Figure 5. Suggested equivalent circuit model for the studied system.
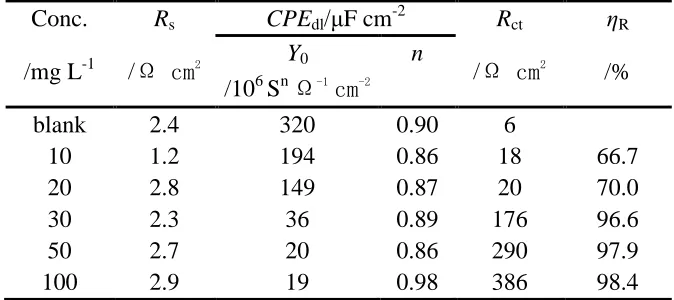
The fitting results such as Rs, Rct, Yo, n, ηR% are all tabulated in Table 2. The data suggest
presence of HACC leads to the significant increase of charge transfer resistance. Rct enhances with the
increasing HACC dosage. The fact indicates charge-transfer process predominantly affects the corrosion impedance. This is due to compact adsorptive film formed at interface [10, 36]. Also, ηR%
increases with added amount of HACC which is the consequence of higher surface coverage caused by more HACC molecules adsorbed on steel surface. Rct rises rapidly at low concentration but slowly at
high concentration. In comparison with Rct, CPE value tends to decrease. The dielectric constant of
[image:8.596.118.466.422.554.2][image:9.596.129.466.184.334.2]
the inhibition efficiency is different but gives the same tendency. The value difference in various methods may be due to the different environment conditions and states of carbon steel surface. The difference is unavoidable and acceptable.
Table 2. Impedance parameters and ηR% calculated by Rct for carbon steel electrode in 0.25 M H2SO4
solution without and with HACC at 30℃.
Conc. Rs CPEdl/μF cm-2 Rct ηR
/mg L-1 /Ω cm2 Y0 n
/Ω cm2
/% /106 Sn Ω-1
cm-2
blank 2.4 320 0.90 6
10 1.2 194 0.86 18 66.7
20 2.8 149 0.87 20 70.0
30 2.3 36 0.89 176 96.6
50 2.7 20 0.86 290 97.9
100 2.9 19 0.98 386 98.4
3.4. Adsorption isotherm
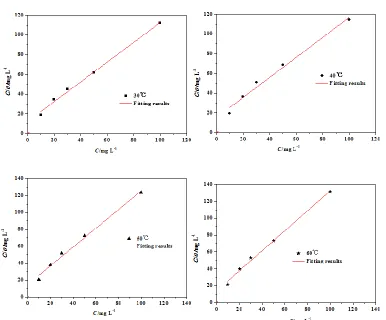
Inhibitor molecules interact with carbon steel surface by adsorption. Adsorption isotherm has been extensively adopted to provide explanation of the mode and degree of adsorption. Adsorption isotherm was expressed as equation of surface coverage degree (θ) vs inhibitor concentration (C). The values of C and θ were plotted to model the different adsorption isotherms [38].The obtained weight loss results (equation (2)) for HACC are introduced into various adsorption equations to verify the correlation. The best correlations between θ and C fit the Langmuir adsorption isotherm equation [39]:
(6)
where C represents HACC concentration (mg L-1), θ represents surface coverage derived from inhibition efficiency by weight loss measurements (θ value is equal to inhibition efficiency expressed in decimal form), Kads represents the standard equilibrium constant (L g-1). Kads is used to calculate
ΔGo
ads value employing equation(7) [40]:
(7)
where 1000 g L-1 is the concentration of water in solution, R (8.314 J mol-1 K-1) is the gas constant, T (K) is absolute temperature, and ΔGoads (kJ mol-1) is standard adsorption free energy. C/θ
vs C were plotted and shown in Fig. 6, the fitted results such as slope, linear correlation coefficient and the calculated ΔGoads and Kads were depicted in Table 3. From equation (6), it can be drawn that the
the HACC molecules [41-43]. In general, ΔGoads value higher than −20 kJ mol−1 is physisorption
(inhibitor molecules were adsorbed by coulombic forces). While chemisorption is associated with the value of ΔGoads lower than −40 kJ mol−1. Chemisorption is the result of electrons sharing or
transference between organic molecules and empty d-orbital of the steel [44-45]. ΔGoads value ranges
from −40 to −20 kJ mol−1 reflecting a mixed chemisorption and physisorption [46]. The calculated ΔGo
ads at different temperatures are in the range (-28.5 to -31.2 kJ mol-1) indicating HACC adsorptions
[image:10.596.92.506.258.358.2]are a mixed process of chemisorption and physisorption.
Table 3. Thermodynamic parameters for HACC adsorption on carbon steel at different temperatures (30-60℃).
Temp. Kads -ΔGoads slope r
/℃ /L g-1 /kJ mol-1 Correlation coefficient
30 81.33 28.5 1.00167 0.9932
40 65.04 28.8 1.01428 0.9805
50 69.03 29.9 1.11058 0.9897
60 70.93 31.2 1.18501 0.9926
Figure 6. Langmuir’s adsorption plots for carbon steel in 0.25 M H2SO4 solution containing various
[image:10.596.100.486.381.701.2]
Weight loss and electrochemical results confirmed that HACC exhibited good inhibition effect by adsorption on carbon steel surface. In general, several contributors affect inhibitor adsorption mechanism, such as metal nature, steric configuration of inhibitor molecules, molecular size, electron density of heteroatom, medium type, ect [47-48].
It is well-known that HACC is considered as N-quaternary ammonium salt. In aqueous solution, N-quaternary ammonium salt can be ionized into two parts, one is N-quaternary ammonium cation and the other is inorganic anion. In studied electrolyte, HACC is ionized into HAC+ and Cl -following the reaction:
HACC→ HAC+ + Cl-
The related results showed that carbon steel surface carried positive charges in H2SO4 solution
[49-50]. HACC molecules and carbon steel surface are carrying positive charges. Hence, according to the theory of repulsion and attraction, cations HAC+ exhibit weak adsorption ability. Inhibition efficiency of HACC may depend on two adsorption processes. First, the ionized Cl- anions may be attracted by Fe2+ cationsand adsorbed at the electrode/solutions interface through columbic interaction. TheCl- anions accumulation may lead to too much negative charge towards interface benefiting more HAC+ cations adsorption, and then the HAC+ cations can approach to the carbon steel surface covered by already adsorbed anions through electrostatic interactions (physical adsorption). During the process, the Cl- acts as a bridge connected inhibitor and carbon steel promoting formation of inhibitor adsorptive film. Second, HACC adsorption may occur via transferring unshared electrons from HACC to the empty orbital of the Fe atom (chemisorption) [51]. The transference of unpaired electrons strengthens the inhibition effect of HACC for carbon steel. It is also possible that both physisorption and chemisorption are simultaneous processes.3.6. Activation energy of corrosion process
The Arrhenius equation is used to explain the influence of variation of temperature on the reaction rate and is given in the equation (8) [52]:
(8)
where CR is corrosion rate at different temperatures in presence and absence of HACC (CR comes from weight loss method) (mmpy), Ea is apparent activation energy (kJ mol-1), A is
pre-exponential factor (mmpy), R is the universal gas constant (8.314 J mol-1 K-1), T is absolute temperature (K).
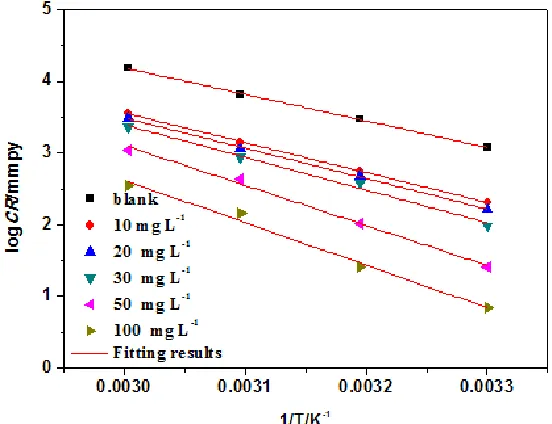
In this study, plots of log CR vs 1/T are depicted in Fig. 7. Plots should be straight lines and slopes are expressed as -Ea/2.303R. By linear fitting these plots, the slopes and intercepts are obtained.
Ea Values are calculated using slopes and A values are obtained via intercepts, Ea, A and r values are
recorded in Table 4. It is revealed that all the regression coefficients are around 1, implying Arrhenius equation can be used to illustrate steel corrosion in 0.25 M H2SO4 electrolyte. Ea values of carbon steel
corrosion with various concentration of HACC are high compared to blank 0.25 M H2SO4 solution.
The Ea and A values rise with the enhancement in HACC concentration. The high Ea values indicate
HACC molecules are adsorbed on steel surface through electrostatic character (physisorption) [53]. From equation (8), the corrosion rate CR is affected by both Ea and A, the lower corrosion rate is as a
over A, the A might become the main factor to affect carbon steel corrosion rate if the variation of A is extremely bigger than that of Ea implying lower A value can lead to lower corrosion rate and better
inhibition effect. In this case, both Ea and A increase with the rising HACC concentration, whereas CR
of carbon steel exhibits the opposite trend (Fig. 2 and Fig. 7));hence, it is concluded that the increment of Ea dominates CR of carbon steel, the higher Ea value results in the lower CR and higher η%.
Figure 7. Arrhenius plots for carbon steel in 0.25 M H2SO4 solution without and with different
concentrations of HACC.Table 4. The calculated thermodynamic parameters of adsorption from weight loss measurements.
Conc. r Ea A
/mg L-1 Correlation coefficiency /kJ mol-1 /mmpy
blank 0.9984 25.6 2.0×10¹⁵
10 0.9995 34.7 1.3×10¹⁶
20 0.9976 35.3 1.6×10¹⁶
30 0.9864 37.9 1.3×10¹⁷
50 0.9936 46.5 7.9×10¹⁹
100 0.9850 49.3 2.5×10²⁰
3.7. Surface morphology observation
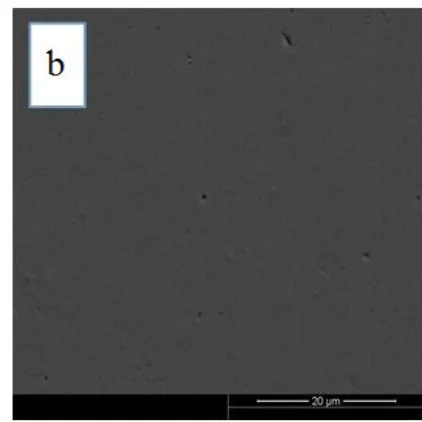
Fig. 8 represents the morphology of carbon steel after immersed in electrolyte for 5 h in presence and absence of 100 mg L-1 HACC at 30℃. The photographs reveal that, the surface of the sample taken out from blank solution presents the uniform corrosion with high surface roughness. While carbon steel immersed in inhibited solution is smooth and even with low surface roughness. . The fact is owing to adsorptive barrier of HACC molecules formed on steel surface [36] to separate carbon steel from H2SO4 solution. In Fig .8(b), the holes are the defects of carbon steel sample itself
[image:12.596.157.433.185.397.2] [image:12.596.104.494.469.588.2]
Figure 8. SEM images of carbon steel in 0.25 M H2SO4 solution (a) blank; (b) with 100 mg L-1 of
HACC.
4. CONCLUSION
(1) 2-hydroxypropyltrimethyl ammonium chloride chitosan (HACC) may be used as inhibitor for carbon steel in sulfuric acid medium. HACC shows certain inhibition at all chosen concentration. Inhibition effect increases by increased HACC dosage and decreases with the rise of temperature, the maximum inhibition 89.3% is obtained when 100 mg L-1 HACC is added at 30℃, the minimum value reaches 46.9% with 10 mg L-1 HACC at 60℃(weight loss measurements). The increment of Ea
dominates CR of carbon steel. (2) HACC is a mixed inhibitor via retarding hydrogen evolution together with carbon steel oxidation simultaneously. HACC adsorption and desorption is dependent on electrode potential.
(3) EIS plots with single depressed capacitive loop indicate that charge transfer process controlled steel corrosion reaction. Inhibitor HACC enhances Rct while reduces CPEdl in consistence
with the displacement of H2O adsorbed on electrode by HACC molecules.
(4) HACC adsorption follows Langmuir isotherm with a highly spontaneous mixture of physisorption and chemisorption. The mechanism of adsorption is that Cl- ions act as the bridge connecting carbon steel and HACC molecules.
ACKNOWLEDGEMENT
The authors express grateful acknowledgment to the financial support provided by China Scholarship Council (CSC, Grant No.201408210072) and Ministry of Housing and Urban and Rural Development of the People's Republic of China (Grant No.2014-K4-020).
References
[image:13.596.325.536.73.284.2]
2. H. P. Sachin, M. H. Moinuddin Khan, N. S. Bhujangaiah, Int. J. Electrochem. Sci., 4 (2009) 134. 3. G. Ji, S. Anjum, S. Sundaram, R. Prakash, Corros. Sci., 90 (2015) 107.
4. M. ElBelghiti, Y. Karzazi, A. Dafali, B. Hammouti, F. Bentiss, I. B. Obot, I. Bahadur, E. E. Ebenso, J. Mol. Liq., 218 (2016) 281.
5. N. Kıcır, G. Tansug, M. Erbil, T. Tüken, Corros. Sci., 105 (2016) 88. 6. A. Hamdy, N.Sh. El-Gendy, Egypt. J. Petro., 22 (2013) 17.
7. M. Mobin, S. Zehra, M. Parveen, J. Mol. Liq.,216 (2016) 598.
8. M. Finšgar, S. Fassbender, F. Nicolini, I. Milošev, Corros. Sci., 51 (2009) 525.
9. H. X. Zhang, D. D. Wang, F. Wang, X. H. Jin, T. R. Yang, Z. Y. Cai, J. Zhang, Desalination, 372 (2015) 57.
10.M. Znini, L. Majidi, A. Bouyanzer, J. Paolini, J. M. Desjobert, J. Costb, B. Hammouti, Arab. J. Chem., 5(2012) 467.
11.D. K. Singh., S. Kumar, G. Udayabhanu, R. P. John, J. Mol. Liq., 216 (2016) 738.
12.S. A. Umoren, M. M. Solomon, U. M. Eduok, I. B. Obot, A. U. Israel, J. Environ. Chem. Eng., 2 (2014) 1048.
13.E. A. Noor, Mater. Chem. Phys., 131 (2011) 160.
14.N. El Hamdani, R. Fdil, M. Tourabi, C. Jama, F. Bentiss, Appl. Surf. Sci., 357 (2015) 1294. 15.A. M. Fekry, R. R. Mohamed, Electrochim. Acta., 55 (2010) 1933.
16.M. N. El-Haddad, Int. J. Biol. Macromol., 55 (2013) 142.
17.R. A. Prabhu, T. V. Venkatesha, A. V. Shanbhag, G. M. Kulkarni, R. G. Kalkhambkar, Corros. Sci., 50 (2008) 3356.
18.C. B. P. Kumar, K. N. Mohana, Egypt. J. Petro., 23 (2014) 201.
19.M. A. Hegazy, M. Abdallah, M. K. Awad, M. Rezk. Corros. Sci., 81 (2014) 54. 20.M. Scendo, Corros. Sci., 50 (2008) 1584.
21.T. P. Zhao, G. N. Mu, Corros. Sci., 41 (1999) 1937.
22.P. Mourya, S. Banerjee, M. M. Singh, Corros. Sci., 85 (2014) 352. 23.W. J. Lorenz, F. Mansfeld, Corros. Sci., 31 (1986) 467.
24.R. Solmaz, G. Karda, B. Yaz, M. Erbil, Colloids and Surfaces A: Physicochem. Eng. Aspects., 312 (2008) 7.
25.B. El Mehdi, B. Mernari, M. Traisnel, F. Bentiss, M. Lagrenee, Mater. Chem. Phys., 77 (2002) 489.
26.S. Ghareba, S. Omanovic, Corros. Sci., 52 (2010) 2104.
27.N. A. Odewunmi, S. A. Umoren, Z. M. Gasem, J. Environ. Chem. Eng., 3 (2015) 286. 28.D. Jayaperumal, Mater. Chem. Phys., 119 (2010) 478.
29.W. Li, Q. He, S. Zhang, C. Pei, B. Hou, J. Appl. Electrochem., 38 (2008) 289. 30.M. H. Hussin, M. J. Kassim, Mater. Chem. Phys., 125 (2011) 461.
31.Q. Hu, Y. B. Qiu, G. A. Zhang, X. P. Guo, Chin. J. Chem. Eng., 23 (2015) 1408.
32.K. K. Anupama, K. Ramya, K. M. Shainy, A. Joseph, Mater. Chem. Phys., 167 (2015) 28. 33.P. B. Raja, A. K. Qureshi, A. A. Rahim, H. Osman, K. Awang, Corros. Sci., 69 (2013) 292. 34.J. M. Zhao, H. B. Duan, R. J. Jiang, Corros. Sci., 91 (2015) 108.
35.M. Behpour, S. M. Ghoreishi, M. Khayatkashani, N. Soltani, Mater. Chem. Phys., 131 (2012) 621. 36.T. Ibrahim, H. Alayan, Y. Al Mowaq, Prog. Org. Coat., 75 (2012) 456.
37.M. S. Nooshabadi, M. S. Ghandchi, J. Ind. Eng. Chem., 31 (2015) 231. 38.M. M. Saleh, A. A. Atia, J. Appl. Electrochem., 36 (2006) 899.
39.J. Saranya, M. Sowmiya, P. Sounthari, K. Parameswari, S.Chitra, K. Senthilkumar, J. Mol. Liq., 216 (2016) 42.
40.A. Biswas, S. Pal, G. Udayabhanu, Appl. Surf. Sci., 353 (2015) 173. 41.V. R. Saliyan, A. V. Adhikari, Corros. Sci., 50 (2008) 55.
42.M. Ozcan, J. Solid State Electrochem., 12 (2008) 1653.
44.U. M. Eduok, S. A. Umoren, A. P. Udoh, Arab. J. Chem., 5 (2012)325.
45.X. Y. Ma, X. H. Jiang, S. W Xia, M. L. Shan, X. Li, L. M. Yu, Q. W. Tang, Appl. Surf. Sci., 371 (2016) 248.
46.K. Rose, B. S. Kimd, K. Rajagopal, S. Arumugam, K. Devarayan, J. Mol. Liq., 214 (2016) 111. 47.S. Andreani, M. Znini, L. M. Paolini, B. Hammouti, J. Costa, A. Muselli, Int. J. Electrochem. Sci.,
8 (2013) 11896.
48.A. Singh, Y. H. Lin, E. E. Ebenso, W.Y. Liu, J. Pan, B. Huang. J. Ind. Eng. Chem., 24 (2015) 219. 49.A. Popova, M. Christov, A. Vasilev, Corros. Sci., 94 (2015) 70.
50.A. Popova, M. Christov, A. Vasilev, A. Zwetanova, Corros. Sci., 53 (2011) 679. 51.G. N. Mu, X. M. Li, G. H. Liu, Corros. Sci., 47 (2005) 1932.
52.M. Yadav, S. Kumar, T. Purkai, L. O. Olasunkanmi, I. Bahadur, E. E. Ebenso, J. Mol. Liq., 213 (2016) 122.
53.M. A. Deyab, J. Ind. Eng. Chem., 22 (2015) 384.